


« Prev Next »
Distribution limits of organisms are dependent on biotic and abiotic environmental factors. Organisms maximize their fitness at an "optimal" environmental range, and can survive only short periods in environmental conditions that exceed a threshold in their "critical tolerance limits." Breadth of optimal environments, and the range of environments between critical limits vary depending on physiological adaptation and energetics. Critical limits may serve to define species distributions, community structure, and how communities respond to environmental changes. Variation in fitness between environmental factors that define an organism's critical limits can be diagrammed as a "performance curve," the shape of which can be interpreted in the context of physiological mechanisms at the organismal and cellular level.
In this article we introduce readers to performance curves, describe physiological mechanisms that play a role in determining the shape of the curves, and discuss ecological implications of these curves in the context of biogeography and climate change. For simplicity, our examples will consider only one abiotic environmental condition — temperature — as temperature similarly impacts all organisms through direct effects on molecules. Similar performance curve, optimal range, and critical limits concepts apply to other abiotic factors, although the mechanisms that define the shape of the curves may differ across abiotic factors.
Thermal Performance Curves
To understand how organisms respond to environmental variation, ideally scientists would directly measure fitness. However, fitness can be difficult to assess, as multiple-generation studies are required, so correlated measures of an organism's performance are used as indirect measures of fitness. Performance curves illustrate an organism's performance across a range of environmental conditions, such as temperature (Figure 1) (Huey & Kingsolver 1989, Spicer & Gaston 1999, Pörtner et al. 2006, Angilletta 2009). Performance is maximized under a range of optimal temperatures, and declines to zero just beyond upper and lower critical temperatures that define the organism's thermal tolerance range. Critical thermal limits, which define the breadth of temperatures over which the organisms can tolerate at least short exposure, are normally indexed by one of two metrics, upper and lower LT50 or CTmax and CTmin. Eurythermal organisms have a wide thermal breadth, and can inhabit a wide range of thermal environments, whereas stenothermal organisms are restricted to narrow thermal environments or must behaviorally thermoregulate.
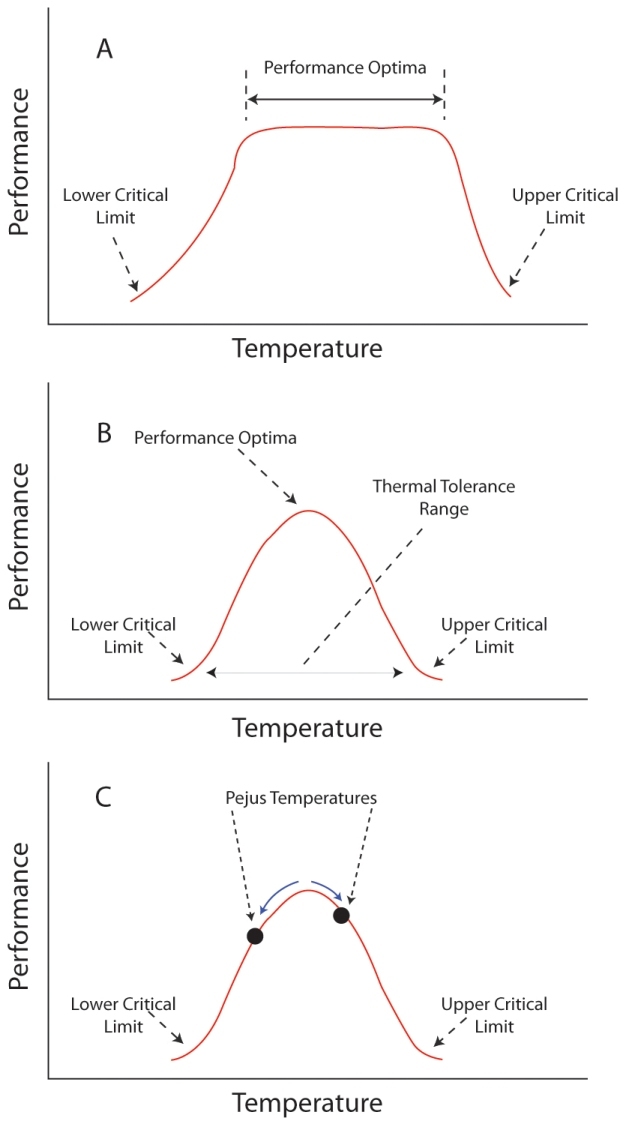
Figure 1
Hypothetical physiological performance curves for endothermic (A) and ectothermic (B, C) animals. Critical limits refer to temperatures beyond which only short-term exposure is possible. (Pörtner et al. 2006).
© 2012 Nature Education All rights reserved. 
Physiologists categorize animals based upon their thermal interactions with their environment, and often the simplest categorization concerns whether an animal is an endotherm or an ectotherm. This distinction is important because it determines how an organism responds to variation in environmental temperature. For an endotherm within its optimal range of temperature — termed the thermal neutral zone (TNZ) — metabolism is constant and minimized (Figure 1A). At temperatures above and below the TNZ, endotherms elevate their metabolic rate while inducing physiological responses to maintain a constant body temperature (e.g., shivering to warm, sweating to cool). Ectotherms show a very different response to changes in temperature, as they have no TNZ (Figure 1B), but do have an optimal temperature at which they perform most efficiently. Mobile ectotherms may behaviorally thermoregulate a specific body temperature by moving between environments, but doing so is energetically taxing and could reduce fitness in food-limited conditions.
Recently the conceptual framework surrounding the use of thermal performance curves has been expanded, recognizing that even before reaching upper and lower critical limits organism perform less and less well (Pörtner et al. 2006). Hence, as temperatures increase or decrease from the optimal, performance is reduced. The temperatures where performance begins to decline are referred to as pejus temperatures, and are less extreme than the critical limits (Figure 1C). Pejus temperatures may represent thermal transitions that are more ecologically relevant than critical thermal limits, because well before reaching temperatures that result in immanent death, an organism may be required to mount compensatory mechanisms that divert energy away from performance parameters with direct fitness correlates (Pörtner et al. 2006).
Mechanistic Bases of Thermal Performance Curves
In this section we take a look at the physiological processes that are occurring in each region of a thermal performance curve, moving from the cold to the warm end of the thermal spectrum. These processes have implications for critical tolerance limits, rates of performance, and efficiency of performance. Performance optima occur when physiological rates and metabolic efficiency are both maximized.
Lower critical thermal limits
Organisms that can survive in conditions where temperatures are below their thermodynamic freezing point employ a number of physiological mechanisms to prevent formation of intracellular ice (Hochachka & Somero 2002). Generally, organisms cannot survive the formation of ice inside of cells, but ice can form outside of cells as long as the ice grows in a controlled and directed manner. Ectothermic terrestrial vertebrates (e.g., frogs (Storey & Storey 1992)) and invertebrates (e.g., insects (Storey 1985)), and marine intertidal zone invertebrates (e.g., mussels (Russell & Storey 1996)) that experience temperatures below freezing are freeze tolerant, as they allow extracellular ice to form, but prevent intracellular ice formation in several ways related to the colligative properties of water (Figure 2). First, compatible solutes or osmolytes such as glycerol and glucose are concentrated inside cells, lowering the freezing point of the cytosolic fluid. Second, ice formation is encouraged to occur in extracellular fluid by ice nucleators. When nucleated ice formation begins, the remaining solutes are concentrated in the extracellular fluids, and this creates an osmotic pressure gradient, causing water to move out of cells, further concentrating the intracellular fluid and reducing its freezing point. Other organisms are freeze resistant, in that they prevent freezing of body tissues by limiting the size of ice crystals using antifreeze proteins and glycoproteins (Figure 3). Antifreeze proteins and glycoproteins, found in polar marine fishes and insects, coat growing ice crystals and prevent them from growing to harmful size. Mammals that live in cold winter environments often enter a period of hibernation during the winter, which reflects reduced access to food. Large animals like bears have modest reductions in body temperatures, but small hibernators like Arctic squirrels allow body temperature to fall slightly below 0°C — however, they do not freeze. Although energy is saved during periods of reduced body temperature (reduced metabolism), periodic arousal leads to large, albeit temporary increases in metabolic rate during the hibernation periods. Lower critical thermal limits of tropical ectothermic organisms are typically above the freezing point of tissues, thus mechanisms other than failure to tolerate or avoid freezing are involved in setting lower thermal tolerance limits. These mechanisms include maintenance of enzymes and membranes in the range of marginal stability required for proper function (Hochachka & Somero 2002).
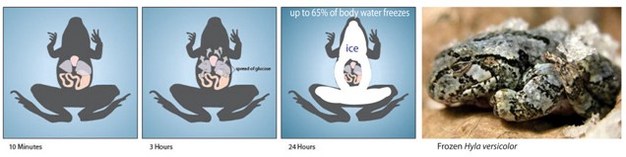
Figure 2
Wood frogs endure freezing during the wintertime, but only fluids in extracellular spaces (e.g., blood) freeze. Exposure to freezing temperatures for just a few minutes causes ice crystals to form beneath the skin. This ice formation stimulates the frogs to produce and transport glucose out of their vital organs into extracellular spaces within several hours. Doing so creates an osmotic gradient that draws water out of the cells, concentrating the remaining solutes inside of the cells and lowering the freezing point of the intracellular fluids to below the habitat temperature minima. As the habitat continues to cool ice forms throughout the extracellular spaces, and up to 65% of the body water can turn to ice. A frozen gray tree frog is pictured, showing that it is directly in contact with ice.
© 2012 Nature Education Images courtesy of Professor Ken Storey/Carleton University and via Washington Post as reproduced in the Seattle Times. All rights reserved.
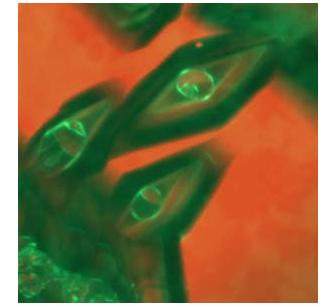
Figure 3
Antifreeze proteins limit the size of ice crystals by binding to the ice surface and forming curved surfaces between adjacent protein molecules that limit ice growth beyond a specific geometric structure. In this picture of ice crystals that reach a terminal bipyramidal shape, antifreeze proteins have been labeled with a green fluorescent protein tag. The curvature of those proteins coating surfaces of growing ice can be observed in the core of the crystal. For more information and a video of ice crystal growth with antifreeze proteins, see Pertaya et al. 2008.
Science Daily. Image courtesy of Ido Braslavsky. All rights reserved.
Marginal stability
Enzyme function requires conformational shifts, changes in the 3-dimensional shape of molecules, to bind reactants and to release products. Conformational shifts require that the enzyme is stable enough to maintain its shape to recognize and bind its substrates and precisely orient reactants in the active site, but not so stable that it becomes rigid and unable to bind reactants or release products. Thus, most molecules involved in biological processes have marginal stability, or are labile, under normal physiological conditions. The three dimensional structure of enzymes, membranes, and molecular complexes, like those involved in the regulation of gene expression, depend on many weak bonds that collectively stabilize the molecule, but are each highly temperature sensitive. Small increases in temperature, such as those that organisms experience in nature, have little effect on covalent bonds, but a large impact on weak bonds. Therefore, changes in temperature impact the stability, flexibility, and structure of molecules involved with biological processes. For all organisms, the thermodynamic impact of increasing temperature is an increase in the rate of biological reactions and a reduction in stability of molecules like enzymes whose structures are dependent on integrity of weak bonds.
Reduction in metabolic efficiency
As temperatures continue to rise, increased thermal energy breaks more and more of the weak bonds that give molecules their marginal stability, and leads to reduced metabolic efficiency, as the biological machinery works less well, even though overall metabolic rates may continue to increase. As weak bonds break in membranes they become less of a barrier to ions such as protons (H+), and this results in a reduction of the efficiency by which energy in food or sunlight is converted into the biological energy currency, ATP, in chloroplasts and mitochondria (Pörtner et al. 2006). In these organelles, the electron transport chain generates a H+ gradient, and the energy stored in that H+ gradient (the proton motive force) is used to power the ATP synthase enzyme that attaches the terminal phosphate on ADP to replenish ATP (Figure 4). As membranes become leakier to H+ ions, the same amount of electron transport generates a smaller proton motive force, and makes less ATP. Thus increase in temperature ultimately leads to lower ATP per unit energy input. Organisms can compensate for that reduction in efficiency by gathering more light or eating more food, but if the energy source is limiting, reduction in efficiency can have fitness consequences.
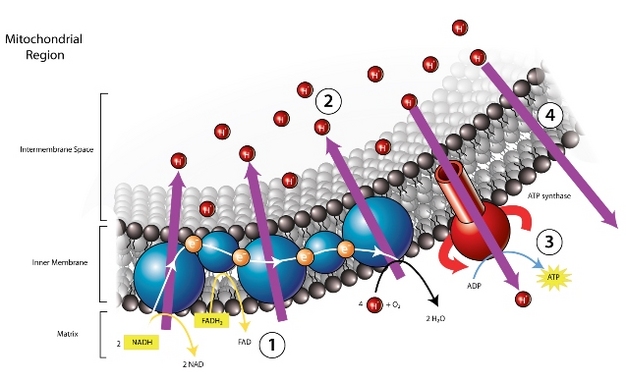
Figure 4
A diagrammatic representation of the inner membrane of a mitochondria and the molecular components of oxidative ATP generation. Through the electron transport chain (1) protons are transported from the mitochondrial matrix to the intermembrane space. The accumulation of protons in the intermembrane space (2) generate a proton motive force across the mitochondrial inner membrane. Protons will tend to move down their concentration gradient and back into the mitochondrial matrix, across the inner mitochondrial membrane. When the inner membrane is intact the only means of moving across it is through the ATP synthase molecule (3), generating ATP in the process. When the structure of the inner membrane has been compromised (e.g., by thermal stress) protons may move through the inner membrane bypassing the ATP synthase and ATP production, in a process referred to as proton leakage (4).
Image modified from BiologyCorner.com. Some rights reserved.
Oxygen limitation and fermentative metabolism
At some temperature, the supply of oxygen to cells reaches a maximal rate, set by properties of environmental oxygen availability and oxygen transport mechanisms, and mitochondria reach a maximal rate of electron transport, thus setting an upper limit on the rate of ATP synthesis (Frederich & Pörtner 2000). Whether rates of mitochondrial ATP synthesis decrease first as a consequence of oxygen limitation or of decreased proton motive force probably varies, depending on whether the organism obtains its oxygen from air or water, as oxygen concentration in water is much lower than in air. In either case, as temperatures rise further, mismatches between the energy demand to power increasing rates of biological reactions, and decreasing rates of energy supply through oxidative processes involving chloroplasts or mitochondria cause organisms to begin to use fermentative ATP generation pathways (Frederich & Pörtner 2000). Such pathways do not require oxygen, and produce ATP directly as a substrate-level phosphorylation independent of proton motive force. Fermentative pathways can deliver ATP quickly, but are highly inefficient (e.g., fermentative glycolysis delivers 1/18th-1/19th the amount of ATP than does complete oxidation of glucose through mitochondrial respiration), and require a rapid supply of reduced compounds (e.g., glucose for glycolysis) from energy stores like starch or glycogen. If organisms are living in an energy-limited environment, increased fermentative metabolism will tax energy stores that could otherwise be used to power reproductive output, thus further decreasing fitness. Organisms in food-rich environments can potentially have optimal reproductive fitness at temperatures warm enough to reduce metabolic efficiency, which can vary the breadth of the optimum temperature range.
Cellular stress response
At upper critical temperatures, beyond which organisms can only tolerate short-term exposure, thermal energy is great enough to break large numbers of weak bonds, causing proteins to lose their structural stability and unfold. When this happens, organisms induce a cellular stress response, sometimes referred to as a heat shock response. During a heat shock response cells preferentially upregulate the expression of specific proteins called heat shock proteins (HSPs) that function as molecular chaperones. HSPs act to refold proteins that are damaged during heat stress, but this process is energetically costly as ATP is needed to make and use these chaperones. Often few other proteins are synthesized during a heat shock response, and thus this response is a dramatic departure from normal function to a "rescue" operation at the cellular level. HSPs offer some protection from critical temperatures, and organisms can recover from increased expression of HSPs, although at a performance cost.
Additional aspects of the cellular stress response include the regulation of redox state, cell cycle arrest, and programmed cell death (apoptosis). The cellular stress response is tightly coupled to free radical levels and changes in redox state. As mitochondria become leakier at higher temperatures they release hydroxyl radicals that are damaging to macromolecules such as lipids, proteins, nucleic acids. Consequently changes in redox state — in this example, due to changes in temperature — may serve as a separate trigger of the cellular stress response. Cell cycle arrest and the impairment of growth represent another universal effect of stress-preserved energy is redirected towards macromolecular stablization and repair. When cellular stress exceeds tolerance limits, apoptosis, or programmed cell death, occurs representing the final step in the cellular stress response (Kültz 2005).
Membrane integrity
Increasing heat energy breaks the hydrophobic interactions that hold phospholipid molecules in a lipid bilayer membrane. When an adequate number of those bonds are broken, membranes become more than leaky; they destabilize and form non-bilayer complexes (Hazel & Williams 1990, Hazel 1995), at which stage they no longer are effective barriers between cells, or environments for intercellular communication. Thus, the loss of membrane structure leads to rapid loss of coordinated biological function (Cossins & Bowler 1987). Ectotherms often compensate for the thermal sensitivity of membrane structure by modifying membrane composition through changes in phospholipids head groups, acyl-chain length, acyl-chain saturation, and sterol content. The adaptive reordering of membrane composition to assure a biologically optimal range of membrane fluidity is referred to as homeoviscous adaptation (HVA) (Hazel & Williams 1990). Similar compensatory mechanisms to ensure membranes remain in the proper shape or phase are referred to as homeophasic adapations.
Upper thermal limits
When environmental temperatures exceed the ability of the organism to protect partially unfolded proteins, and when membranes no longer provide a barrier between intra and extracellular spaces, organisms are unable to recover, and thus survival for longer than just a few moments is not possible. At CTmax loss of neuromuscular coordination is commonly observed, resulting from a breakdown of the neuromuscular junction due to loss of neurotransmitter fidelity (Cossins & Bowler 1987, Hochachka & Somero 2002).
Ecological Implications
In this section we consider the implications of having a specific set of thermal limits and how this influences an organism's ecology and sensitivity to changes in its thermal environment. For excellent reviews on this topic see (Portner et al. 2006, Somero 2011).
Distribution limits — Rocky coast example
Rocky coastlines have long been valuable arenas in which to test ecological theories concerning the role of physiological optima and critical tolerance in setting distributional limits because, across a small spatial scale between the high and low tide lines, abiotic factors vary dramatically (Ricketts et al. 1985). In the space of a few meters, one can study environmental gradients of similar magnitude to those that take place across a large latitudinal range, or from the base to the peak of a mountain. The classic vertical zonation of organisms in the northeastern Pacific intertidal zone (Figure 5) features, at the lowest level (closest to the water), a horizontal band of algae and anemones, above which is found a band of mussels, above which is found a band of barnacles. Careful study has demonstrated that upper distribution limits for each band is set by abiotic tolerance limits such that each organism is unable to live any higher on the rock given its performance curve (Stillman & Somero 1996, Tomanek & Helmuth 2002, Denny et al. 2004). Lower distribution limits are typically set by biotic interactions, most commonly competition for space and predation. Understanding those factors that set the thermal optima and thermal performance limits of organisms makes it possible to explain where organisms live, their range limits, and distribution patterns.
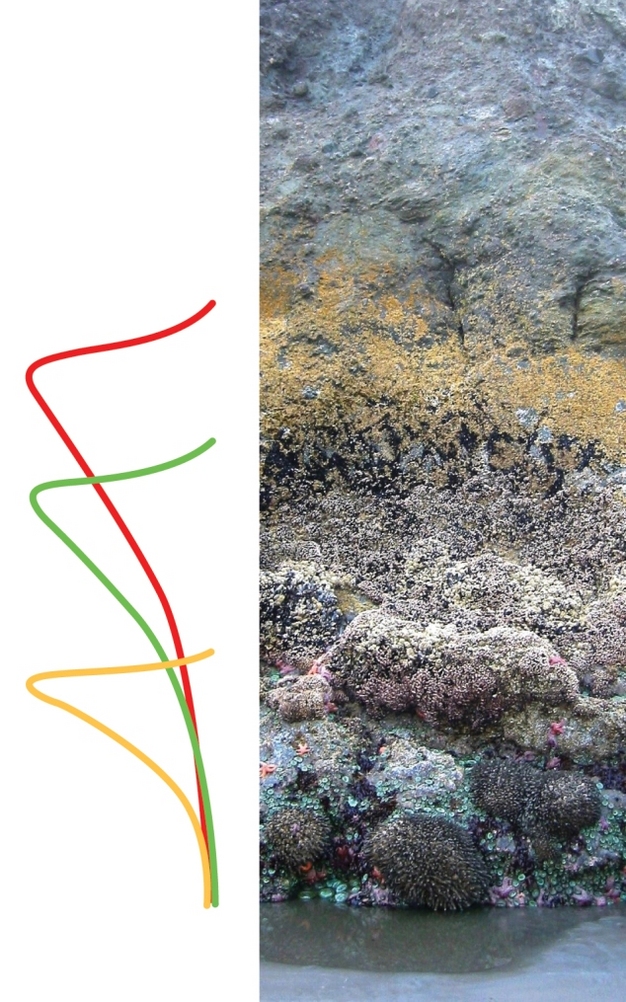
Figure 5
Rocky intertidal zone image showing vertical zonation and idealized performance curves (colored lines) for organisms living in each vertical zone. The vertical zones within the intertidal zone are driven in part by the fact that organisms differ in their thermal performance. Individual organisms do not live higher on the rock than the upper limits of their performance curves, though other organisms with different performance curves can. For example, the most heat tolerant organisms such as barnacles (red performance curve) live highest on the shore. The fact that each organism could potentially live lower on the rock (within their performance curve) but does not, suggests that additional factors play a role in determining lower distribution limits. Careful study has demonstrated that in many cases lower vertical distributions in the rocky intertidal are determined by biological interactions (such as competition).
Photo courtesy of Bcasterline via Wikimedia Commons. Some rights reserved.
Responses to climate change
Thermal tolerance limits and optima are also important in predicting how organisms may respond to climate-change related increases in habitat temperature, such as have been observed during the last half century (Figure 6). The Intergovernmental Panel on Climate Change (IPCC) predicts that global mean temperature will increase over the next 100 years, with extreme events such as heat waves becoming more common (IPCC 2007). Evidence that climate and weather patterns outside of the norm can have dramatic impacts on organisms is mounting. There were increased human fatalities during extreme heat waves that occurred recently in France, 2003, and Russia, 2009 (D'Ippoliti et al. 2010, Alexander 2011). In 2010, a two-week heat wave in Western Australia led to the mass death of thousands of birds, primarily budgerigars, as temperatures topped 45 °C — temperatures that exceeded the critical thermal limits of these birds. Because of the importance for mammals of evaporative cooling, it is predicted that the increases in temperature and humidity that might accompany global warming could preclude the existence of mammals, including humans, at many low latitude sites within the next few centuries (Sherwood & Huber 2010).
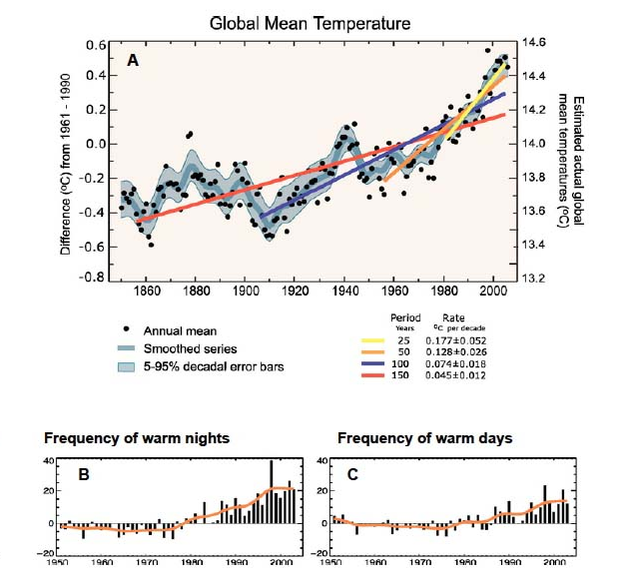
Figure 6
Global temperature data indicating (A) increased global mean temperature over the past 150 years, including accelerated pace of warming during past 50 years seen by increasing slopes of regression fits (colored lines), and (B,C) the frequency of extreme warm days (B) and nights (C) during the past 50 years.
© 2012 Nature Education Sources: A: IPCC Fourth Assessment Report: Climate Change 2007, Working Group I: The Physical Science Basis, Faq 3.1, How are Temperatures on Earth Changing?; B,C: IPCC Fourth Assessment Report: Climate Change 2007, Working Group I: The Physical Science Basis, Faq 3.3, Has there been a Change in Extreme Events like Heat Waves, Droughts, Floods and Hurricanes? All rights reserved.
For some organisms, current habitat temperatures are well below their thermal optima, and they presently have suboptimal performance and/or fitness. Consequently, increases in habitat temperature bring those organisms closer to their thermal optima and increase performance (Figure 7A). Other organisms currently live at or near their thermal optima, and increases in habitat temperature may drive them over their thermal optima, towards their upper pejus or critical temperatures, and reduced performance (Figure 7B). The degree to which changes in climate increase or decrease the performance of a given species depends upon the thermal performance curve for that species, the current temperature, and the degree to which habitat temperature changes (Angilletta et al. 2010).
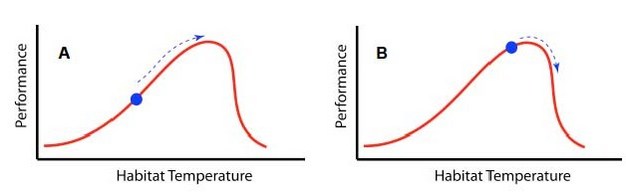
Figure 7
Theoretical thermal performance curves and impacts of climate warming for organisms currently living below (A) and at (B) their thermal performance optima. Organism currently living below their thermal performance optima will be moved closer to that optima by climate change and therefore may benefit. Alternatively, organisms currently living at their thermal performance optima may be moved beyond it by climate change, and experience declines in performance as a result.
© 2012 Nature Education All rights reserved.
In recent analyses of closely related species, there is evidence that while those currently living at the highest temperatures — those from the tropics-have the highest thermal tolerance limits, they also currently experience habitat temperatures near their thermal limits. Consequently, the most heat tolerant species are also those most at risk from further increases in habitat temperature (Stillman 2002, 2003, Deutsch et al. 2008, Dillon et al. 2010, Somero 2010). Using thermal performance curves and global predictions of changes in habitat temperature it is possible to generate estimates of the fitness consequences of climate change (Deutsch et al. 2008). This type of analysis, which has been performed with insects and other ectotherms (Figure 8), has suggested that by the year 2100 the fitness of tropical species may drop below zero — representing population shrinking — as these species are pushed well beyond their thermal optima.
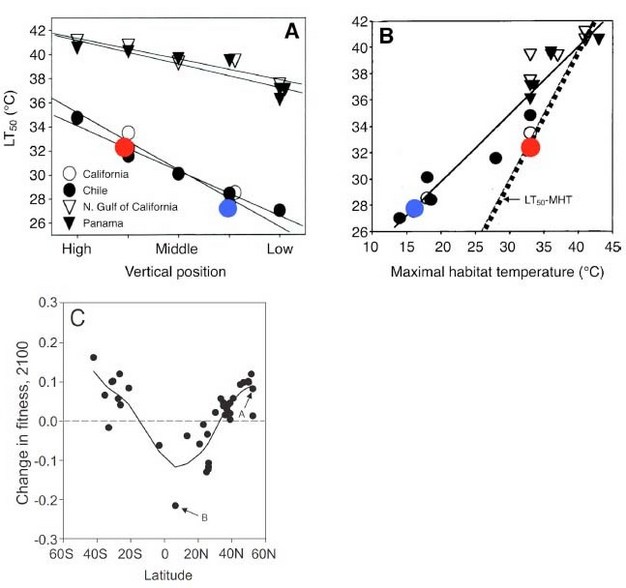
Figure 8
Thermal tolerance relationships of ectotherms from latitudinal and intertidal zone thermal gradients. (A, B) Porcelain crabs (genus Petrolisthes) from different latitudes and vertical positions have upper thermal tolerance limits that reflect their thermal environments. (A) Lethal temperature (LT50) as functions of biogeographic and vertical distributions. (B) Relationship of LT50 to maximal habitat temperature (MHT). The line of equality (LT50=MHT) allows estimation of risk of heat death under contemporary habitat conditions. Red symbol: crab living close to thermal limits (P. cinctipes); blue symbol: crab living far from its thermal limits (P. eriomerus) (modified from Stillman 2002, in Somero 2010). (C) Insects from high latitudes are expected to see an increase in fitness under warmer climates, but tropical insects are expected to have lower fitness under future climate scenarios (Deutsch et al. 2008).
© 2012 Nature Education All rights reserved.
Summary
We have presented a basic introduction to the concepts, mechanisms, and ecological implications for physiological optima and tolerance limits. This proverbial "tip of the iceberg" treatment of the subject will hopefully aid students in their searches through an incredible wealth of information in the scientific literature on the topic.
Glossary
Biotic: Interactions between organisms such as competition or predation.
Abiotic: Physical parameters of the environment such as temperature, salinity, pH, oxygen, carbon dioxide, light, hydrostatic pressure, water current, wind velocity, substratum type, rainfall amount, humidity, and others.
Fitness: Reproductive success in terms of numbers of offspring that also have reproductive success.
Adaptation: The process by which organisms evolve to increase fitness following natural selection.
Energetics: The amount and manner in which energy is obtained and used.
Community structure: The species present and interactions of those species within an ecosystem.
Performance: In this instance, performance is a phenotype with a correlate to reproductive fitness. For example, growth rates, running speed, and respiration (oxygen consumption) rates may all correlate to reproductive fitness as larger individuals may have more offspring, faster individuals may be better at catching food or escaping predation, and both of those are correlated to the rates at which food is metabolized and oxygen consumed.
Upper and Lower LT50: A thermally static method for determining thermal tolerance limits where organisms are held at a range of constant temperatures for a predetermined amount of time and their survival assessed at the end of the experiment. For example, specimens could be held at 1°C temperature intervals between 28–34°C for 2h when upper LT50 is near 31°C. The temperature at which 50% of the organisms die is referred to as the LT50 and serves as a measure of the organism's thermal limit at that particular time of incubation.
CTmax and CTmin: A dynamic method where the experimenter slowly or quickly ramps the organisms from a moderate temperature to a high or low temperature while assessing their physiological state. The temperature at which the organism begins muscular spasms, loses the ability for coordinated movement, or other sign of imminent death is termed the critical maximum (CTmax) or critical minimum (CTmin) and serves as a measure of the organism's thermal limit. In principle such measurements are relatively easy to perform, though care must be taken when choosing the rate of thermal ramping and the starting temperature for the experiments (Terblanche et al. 2007, Rezende et al. 2011).
Eurythermal: Organisms capable of tolerating a wide thermal range.
Stenothermal: Organisms that can only inhabit a narrow range of temperatures.
Endotherms: Animals that warm their body above their habitat temperature by producing and conserving metabolic heat. All mammals and birds, and some fish and reptiles are endotherms. Endothermy may be systemic, when the temperature of the entire body is regulated through controlled heat production and dissipation, or regional (as in some fishes and insects) when temperatures of only some regions of the body are so regulated.
Ectotherms: Animals for which habitat temperatures determine body temperatures. Ectothermic organisms may have variable body temperatures, or may maintain stable body temperatures by moving between environments. Ectotherms are fundamentally unable to produce and conserve adequate metabolic heat to maintain a body temperature that is above their habitat temperature.
Pejus: Defined as "turning worse." For example, a "pejus temperature" is one at which physiological performance ceases to be optimal.
Thermodynamic Freezing Point: The temperature at which ice is predicted to form (if no supercooling occurs). Some organisms live in environments that are colder than their freezing point and survive through supercooling or the use of antifreeze molecules.
Colligative properties: Those properties of solutions that depend on the concentration of dissolved solutes, but not the identities of the solutes.
Compatible solutes: Solutes that do not perturb the structure or function of proteins or membranes and are used by diverse taxa to achieve osmotic balance.
Osmolytes: Solutes whose concentrations are regulated to establish the appropriate osmotic balance between fluid compartments, e.g., cytosolic fluid and blood.
Cytosolic fluid: The fluid inside of cells, or the cytoplasm.
Extracellular fluid: Fluid outside of cells.
Ice nucleators: Molecules that make the crystallization of water from liquid to solid more favorable, and cause ice to form at the true thermodynamic freezing point, such that supercooling is avoided.
Osmotic pressure gradient: The force driving the movement of water molecules across membranes.
Hibernation: A behavior whereby during the winter mammals enter a quiescent state where they let their body temperature drop in order to save the metabolic energy that would be required to maintain an elevated body temperature. During hibernation a minimum body temperature, one that is above the freezing point, is maintained. Hibernating mammals make periodic arousals where body temperature is raised to the normal summertime level.
Enzymes: Catalyst molecules that lower the activation energy of chemical reactions and are an essential component of the fast rates of reactions that characterize biology. Biological enzymes are usually proteins or RNA molecules (ribozymes).
Membranes: Bilayers of phospholipids along with protein and sterol molecules (e.g., cholesterol) that define compartments within cells (e.g., plastids, vesicles) and the outer barrier of cells (cell or plasma membrane).
Conformational shifts: Physical change in the shape of enzymes that occurs during enzymatic reactions.
Weak bonds: Hydrogen bonds, ionic bonds, van der Waals interactions, hydrophobic interactions. Although biological molecules (e.g., polypeptides, lipids) are primarily structured with strong covalent bonds with typical bond energies of 100-700 kCal/mol, the manner in which these molecules interact with themselves (in the case of a polypeptide folding to a protein), other molecules (in the case of lipids forming membranes) to undergo biological reactions, and form cellular structures depends on weak bonds with typical bond energies of 1-7 kCal/mol.
Covalent bonds: Bonds where electron clouds are shared between atoms and that have high bonding energy (100-700 kCal/mol).
ATP: Adenosine triphosphate.
Molecular chaperones: Molecular chaperones help to direct the folding of proteins and prevent formation of cytotoxic aggregates of unfolded proteins in the cell. Many molecular chaperones are produced constitutively, to function in normal protein synthesis and compartmentalization. Others-commonly termed heat-shock proteins-are expressed only when stress from heat or another perturbant of protein folding creates sufficient damage to the proteins of the cell to necessitate increased levels of chaperoning activity.
Thermodynamic: Thermodynamically, we can consider the effect of temperature on the rate of biological processes by the equation:
where k is a transition factor (usually =1), K is the Boltzmann constant, h is Planck's constant, R is the universal gas constant, -∆G‡ is the Gibbs free energy, and T is the absolute temperature (Hochachka & Somero 2002).
References and Recommended Reading
Alexander, L. Climate science extreme heat rooted in dry soils. Nature Geoscience 4, 12-13 (2011).
Angilletta, M. J. Thermal Adaptation, a Theoretical and Empirical Synthesis. Oxford, UK: Oxford University Press, 2009.
Angilletta, M. J., Huey, R. B. & Frazier, M. R. Thermodynamic effects on organismal performance: Is hotter better? Physiological and Biochemical Zoology 83, 197-206 (2010).
Cossins, A. R. & Bowler, K. Temperature Biology of Animals. London, UK: Chapman and Hall, 1987.
D'Ippoliti, D. et al. The impact of heat waves on mortality in 9 european cities: Results from the EuroHEAT project. Environmental Health 9, 37 (2010). doi:10.1186/1476-069X-9-37
Denny, M. W. et al. Quantifying scale in ecology: Lessons from a wave-swept shore. Ecological Monographs 74, 513-532 (2004).
Deutsch, C. A. et al. Impacts of climate warming on terrestrial ectotherms across latitude. Proceedings of the National Academy of Sciences of the United States of America 105, 6668-6672 (2008).
Dillon, M. E., Wang, G. & Huey, R. B. Global metabolic impacts of recent climate warming. Nature 467, 704-706 (2010). doi:10.1038/nature09407
Frederich, M. & Pörtner, H. O. Oxygen limitation of thermal tolerance defined by cardiac and ventilatory performance in spider crab, Maja squinado. American Journal of Physiology: Regulatory, Integrative, and Comparative Physiology 279, R1531-R1538 (2000).
Hazel, J. R. & Williams, E. E. The role of alterations in membrane lipid composition in enabling physiological adaptation of organisms to their physical environment. Progress in Lipid Research 29, 167-227 (1990).
Hazel, J. R. Thermal adaptation in biological-membranes - is homeoviscous adaptation the explanation. Annual Review of Physiology 57, 19-42 (1995).
Hochachka, P. W. & Somero, G. N. Biochemical Adaptation: Mechanism and Process in Physiological Evolution. New York, NY: Oxford University Press, 2002.
Huey, R. B. & Kingsolver, J. G. Evolution of thermal sensitivity of ectotherm performance. Trends in Ecology & Evolution 4, 131-135 (1989).
IPCC. Climate Change 2007: The Physical Science Basis. Contribution of working group i to the fouth assessment report of the Intergovernmental Panel on Climate Change, Cambridge, UK, and New York, NY: Cambridge University Press, 2007.
Kültz, D. Molecular and evolutionary basis of the cellular stress response. Annual Review of Physiology 67, 225-257 (2005).
Pertaya, N., Marshall, C. B., Celik Y., Davies, P. L. & Braslavsky, I. Direct visualization of Spruce budworm antifreeze protiens interacting with ice crystals: Basal plane affinity confers hyperactivity. Biophysical Journal 95, 333-341 (2008).
Pörtner, H. O. et al. Trade-offs in thermal adaptation: The need for a molecular to ecological integration. Physiological and Biochemical Zoology 79, 295-313 (2006).
Ricketts, E. F. et al. Between Pacific Tides. Stanford, CA: Stanford University Press, 1985.
Russell, E. L. & Storey, K. B. Freezing and the regulation of enzymes of carbohydrate metabolism in the salt marsh bivalve Geukensia demissus. Cryo-Letters 17, 233-240 (1996).
Sherwood, S. C. & Huber, M. An adaptability limit to climate change due to heat stress. Proceedings of the National Academy of Sciences of the United States of America 107, 9552-9555 (2010).
Somero, G. N. The physiology of climate change: How potentials for acclimatization and genetic adaptation will determine 'winners' and 'losers'. Journal of Experimental Biology 213, 912-920 (2010).
Somero, G. N. Comparative physiology: A "crystal ball" for predicting consequences of global change. American Journal of Physiology - Regulatory, Integrative and Comparative Physiology 301, R1-14 (2011).
Spicer, G. S. & Gaston, K. J. Physiological Diversity and its Ecological Implications. Oxford, UK: Blackwell Science, 1999.
Stillman, J. H. & Somero, G. N. Adaptation to temperature stress and aerial exposure in congeneric species of intertidal porcelain crabs (genus Petrolisthes): Correlation of physiology, biochemistry and morphology with vertical distribution. Journal of Experimental Biology 199, 1845-1855 (1996).
Stillman, J. H. Causes and consequences of thermal tolerance limits in rocky intertidal porcelain crabs, genus Petrolisthes. Integrative and Comparative Biology 42, 790-796 (2002).
Stillman, J. H. Acclimation capacity underlies susceptibility to climate change. Science 301, 65 (2003).
Storey, K. B. Biochemical principles of freeze tolerance in insects. Cryo-Letters 6, 410-413 (1985).
Storey, K. B. & Storey, J. M. Natural freeze tolerance in ectothermic vertebrates. Annual Review of Physiology 54, 619-637 (1992).
Tomanek, L. & Helmuth, B. Physiological ecology of rocky intertidal organisms: A synergy of concepts. Integrative and Comparative Biology 42, 771-775 (2002).
Glossary References
Hochachka, P. W. & Somero, G. N. Biochemical Adaptation: Mechanism and Process in Physiological Evolution. New York, NY: Oxford University Press, 2002.
Rezende, E. L., Tejedo, M. & Santos, M. Estimating the adaptive potential of critical thermal limits: Methodological problems and evolutionary implications. Functional Ecology 25, 111-121 (2011).
Terblanche, J. S. et al. Critical thermal limits depend on methodological context. Proceedings of the Royal Society B: Biological Sciences 274, 2935-2942 (2007).