
.", "true", "Figure 2", "Note that the scale is logarithmic (each tick increases by a factor of 10) (McMahon & Bonner 1983).", "true", "All rights reserved.", '401', '696', 'http://www.nature.com/scitable');)
.", "true", "All rights reserved.", '350', '342', 'http://www.nature.com/scitable');)


« Prev Next »
Introduction
"O wonderful! I am food! I am food! I am the eater of food!"
With gleeful excess, the Upanishads summarize an important ecological principle: Organisms are defined by the resources that they use and how they are themselves used as resources. Plants harvest energy from the sun, carbon dioxide from the atmosphere, and minerals from the soil. They emit the oxygen that sustains animal life. Animals eat plants, eat each other, expel carbon dioxide and excrete many other waste products. These waste products provide nutrients for plants and microbes. Using resources (energy and materials) to make new cells, to repair old ones, and to get rid of wastes requires the assemblage of biochemical pathways that we call metabolism. Metabolism is a universal feature of life that links organisms with their environment, and with each other.
The problem with metabolism at the chemical level is that it is complicated. The chart of life's metabolic reactions connects substrates, products, and enzymes in a maze of bewildering complexity (Figure 1). To understand how an organism's metabolism determines its ecological interactions within food webs and ecosystems, we need a simpler and more synthetic theory of metabolism in relation to macroscopic and measureable properties of organisms. Fortunately, we can describe the metabolic features of an organism with just a few numbers. These numbers can often be obtained by measuring the rate at which organisms exchange gases with the environment. For example, although photosynthesis is a complex biochemical process, we can readily estimate how fast it takes place by measuring the rate at which plants exchange gases with the environment. In a similar fashion, we can measure the rate at which many organisms use energy by respiration by the rate at which they consume oxygen. And we can make a good guess of the rate at which an organism photosynthesizes and respires if we know only two things: its size and its temperature.

Figure 1: The collection of metabolic pathways used by living organisms is represented in this tapestry.
Each point is a substrate that is transformed along the pathway. Most organisms only use a subset of this global pathway.
© 2010 Nature Education Courtesy of Kyoto Encyclopedia of Genes. All rights reserved. 
Why Body Size Matters
The sizes of organisms range over many orders of magnitude. The largest animals and plants weigh about 21 orders of magnitude (1021 times) more than the smallest microbes (Figure 2). The smallest known organism is the tiny microbe Nanoarchaeum equittans, which lives in hydrothermal vents off the coast of Iceland and measures only 400 nm (≈0.00002 inches). The largest organism is the giant sequoia, Sequaiodendron sempervirens, which can be 100 m tall and 17 m in diameter at its base. To a large extent the diversity of function in life is the result of diversity in size. George Bartholomew (1981) observed that "the most important attribute of an animal, both physiologically and ecologically is its size." Indeed, if we know an animal's mass, we can make accurate educated guesses about many of its characteristics. To see why this is so, we can go back to the ancient Greeks who discovered and applied the principle of geometric similarity: If a collection of objects has the same form, we call them geometrically similar, and surface area (S) increases as the square, and volume (V) as the cube, of linear dimensions. Here it is represented in formulae, taking L to represent any linear dimension (e.g., the total animal's length or the length of one of its legs):
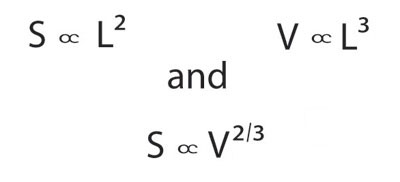

Many interesting consequences follow from these elementary principles. For example, fisheries biologists weigh fish with a measuring tape — referring to the relationship that relates mass (M, which is proportional to the fish's volume) with L3:
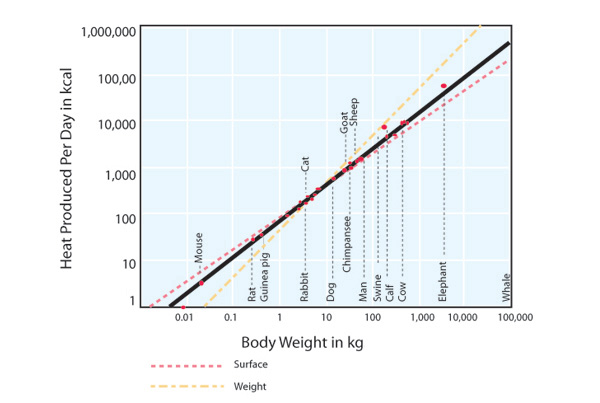
In 1879, the German physiologist Karl Meeh applied the principle of geometric similarity to animals and found that their surface increased with body mass raised to an exponent equal to 2/3. This result, which has withstood the test of time, is remarkable because animals vary greatly in form: Animals of different sizes are not geometrically similar. In spite of this variation, the relationship holds quite well. Max Rubner, a contemporary of Meeh, reasoned that because heat loss should be proportional to an animal's surface (S), then the rate at which mammals use energy should be proportional to S and hence to M2/3. He tested this relationship with dogs of various sizes and found good agreement with his conjecture. His idea of surface area as the determinant of the rate at which animals use energy was accepted for many years, and came to be known as Rubner's rule.
Fifty years passed until Max Kleiber, a nutritionist at the University of California published a data set that included mammals of a much wider range of sizes. Like Rubner, Kleiber found that the rate of energy use in mammals increased with mass. But unlike Rubner, he found that the exponent of the relationship was not 2/3 but instead was close to 3/4 (0.75), which Kleiber suggested should be used (Figure 3). Kleiber's suggestion of using an exponent of 0.75 was subsequently adopted, and Kleiber's law supplanted Rubner's rule.
Figure 3: Max Kleiber's (1947) original figure reporting the relationship between the metabolic rate of a collection of mammals and body mass
Note that the relationship has a gradient that differs from both 1 and 2/3.
© 2010 Nature Education All rights reserved.
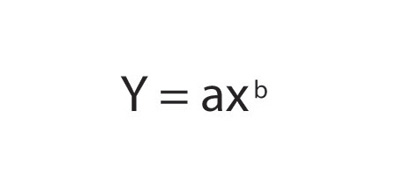
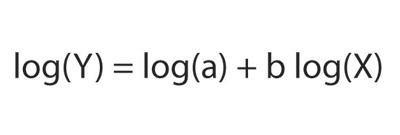
Because the relationship between metabolic rate and body mass is described by a power function of the form
an ordinary graph of metabolic rate against mass is a decelerating curve. When the data are plotted on logarithmic coordinates, points fall along a straight line with slope/gradient equal to the exponent b:
In Figures 2 and 3, factors of 10 along the axes are spaced by the same distance: 100 kg is as far from 10 kg as 10 kg is from 1 kg. Hence, we find that many features of animals and plants that interest ecologists vary as power functions of body mass. The study of these relationships is called allometry and the equations that relate an organism's feature with body mass are called allometric equations (from the Greek roots allo which means "other" and meter which means "measure"). When organisms obey the principle of geometric similarity described above, then we refer to the relationship between a trait and body mass as isometric. For example, the relationship between surface area and body mass is isometric.
Many clever explanations have been proposed to explain why the exponent of the relationship between metabolic rate and body mass should be 3/4 rather than 2/3, and the proponents of each have engaged in heated debates that have gone on for decades. In reality, although the exponent is often close to 0.75, it can vary from 0.5 to 1, frequently differs among groups of organisms, and depends on whether we are measuring the metabolic rate of animals that are at rest or active and on whether the data points represent the adults of several species or growing individuals of the same species. The rate of respiration and photosynthesis in plants also increases as a power function of plant mass, but the exponent often differs from 3/4. Nature keeps violating Kleiber's law.
Notwithstanding this issue of the exact value of b, the relationship between metabolic rate and body mass is important because energy use shapes many aspects of an organism's biology.
Why Temperature Matters
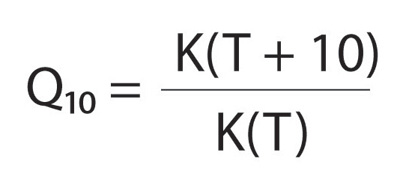
We can say much about an organism if we know how big it is. We can say more if, in addition, we know how hot it is. The relationship between how fast biological processes take place has been known for a long time. Harold Shapley, who is better known as an astronomer than an ant-watcher, found that the speed at which ants ran along the trails of Mount Wilson Observatory increased so regularly with temperature that he could use ant speed as an accurate thermometer. Recognizing that the speed of biological processes increases roughly exponentially with temperature, physiologists devised a thermal sensitivity index called the Q10 factor. Q10 simply tells you the factor by which the reaction increases when you raise temperature by 10 degrees centigrade (or Kelvin). If temperature equals T and rate equals q, then Q10 equals the ratio of the rate of the process at T + 10 [q (T + 10)] divided by that at T[q (T)]:
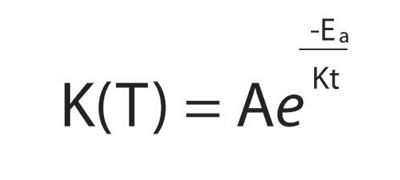
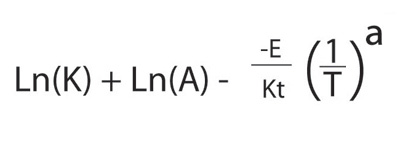
A better relationship was derived for chemical reactions by the pioneering physical chemists Jacob Van't Hoff and Svante Arrhenius in the late nineteenth century:
Ea and kB are the "energy of activation" and Boltzmann constant, respectively. The Arrhenius equation is particularly convenient in its linearized form
The Metabolic Theory: Combining Allometry and Temperature
With remarkable insight, James Gillooly and his collaborators at the University of New Mexico conjectured that we can estimate metabolic rate (B) as the product of an allometric function and the Arrhenius equation:
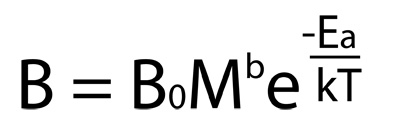
This simple equation has enormous descriptive power, and is at the center of what is called the metabolic theory of ecology (MTE). MTE aims to find the relationship between body mass and temperature and a variety of ecological phenomena, and does it successfully. MTE's central equation is very useful for four major reasons:
- It summarizes a lot of biological information in a very compact form.
- We can combine it with other equations to make a variety of inferences about ecological processes that range from the behavior of individuals to the biogeochemical processes in ecosystems.
- MTE's central equation can be used to make educated guesses ("first order predictions") about features of organisms and magnitudes of ecological processes that have not been studied directly. We use the term educated guesses because, although MTE's predictions can be quite accurate, they are also rather imprecise.
- MTE's central equation allows us to make comparisons between the traits of different organisms that might differ in body mass and temperature.
MTE's equation allows us to ask if the traits of organisms vary only because of differences in body mass and temperature or because other factors are at play. Because body mass and temperature have such pervasive effects on all biological processes, we need to account for their differences in both body mass and temperature when we compare the traits of different species. For example, if we want to know whether animals that live in arid places have larger home ranges than those that live in moister, more productive places, we need to account for the observation that the animals that we want to compare might differ in both size and body temperature.
Making Ecological Inferences from Body Mass and Temperature
The rate at which organisms process energy and materials determines how fast they grow and reproduce, how long they live, and how rapidly they move through space. Thus it is not surprising that a number of key ecological traits depend on body mass and temperature. For example, John Damuth hypothesized that the maximal population abundance (or carrying capacity, large K) that a species can achieve is determined by how much energy is available (Etotal) and how much energy is used by each individual (Eindividual), so that Etotal is proportional to KEindividual. Because Eindividual is proportional to body mass raised to an exponent b (Mb where b ≈ 3/4), then Etotal is proportional to KM3/4, and K is proportional to EtotalM-3/4.
This relationship, called the energy equivalence rule, tells you two things: 1. mice can reach higher abundances than elephants and 2. if the populations of elephants and mice are at their carrying capacity, these populations will use the same amount of energy (KEindividual is proportional M-3/4 + 3/4 = M0). Because, at a given site, not all species will be at carrying capacity, the abundance to body mass relationship will have a lot of scatter, and its exponent will not be -3/4. The relationship works well when a large number of species, including a very broad range of body sizes from all over the globe, are plotted together, probably because a sufficiently large number of species close to their carrying capacity are represented.
Another important ecological trait that is influenced by body size and temperature is rmax, the intrinsic rate of population increase (i.e., the rate at which populations can grow in the absence of food or space limitations). We have known for a very long time that populations of small animals can grow faster than those of large ones. More precisely, ecologists found that rmax is proportional to M-b. In 1974, Tom Fenchel conjectured that the value of rmax would be set by the organism's mass-specific metabolic rate (i.e., the ratio of metabolic rate to body mass), and hence that b should be about -0.25. In 2004, Vance Savage and his collaborators hypothesized that rmax would depend on both body mass and temperature. Both conjectures proved to be roughly correct (Figure 5). Both the maximal rates at which populations can grow and their potential carrying capacity are influenced by body size and temperature. Ecologists have documented similar effects for processes as disparate in scale as molecules evolving, and the flow of energy and materials through ecosystems. Temperature and size affect how organisms work because organisms cannot break the limits imposed on them by physics and chemistry. The physical and chemical principles that rule the transfer of energy and materials within and among organisms generate order in the riotous, and sometimes seemingly overwhelming, complexity of ecological systems.
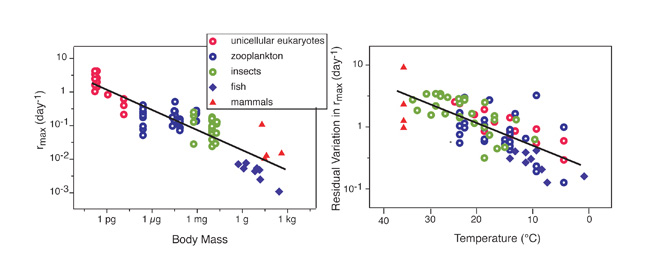
Figure 5: The intrinsic rate of population increase, rmax, decreases with body mass (note that both axes are logarithmic).
The variation that remains after the effect of body size has been removed can be explained by temperature. The relationship that links rmax with body mass (M) and temperature (T in °K) is Ln(rmax) = 22.72 - 0.21Ln(M) - k-10.60(1/T) and explains about 89% of the variation in the Ln(rmax) (Savage et al. 2004).
© 2010 Nature Education All rights reserved.
References and Recommended Reading
Brown, J. H. et al. Toward a metabolic theory of ecology. Ecology 85,1771–1789 (2004).
Frazier, M., Huey, R. B. et al. Thermodynamics constrains the evolution of insect population growth rates: "warmer is better". American Naturalist 168, 512–520 (2006).
Gillooly, J. F., Brown, J. H. et al. Effects of size and temperature on metabolic rate. Science 293, 2248–2251 (2001).
Kleiber, M. Body size and metabolic rate. Physiological Reviews 27, 511–541 (1947).
McMahon, T. & Bonner, J. T. On Size and Life. New York, NY: Scientific American Library (1983).
Savage, V. M. et al. Effects of body size and temperature on population growth. American Naturalist 163, 429–441 (2003).
Shappley, H. Note on the thermokinetics of Dolichoderine ants. Proceedings of the National Academy of Sciences 98, 1095–1100 (1924).