


« Prev Next »
Allometry, in its broadest sense, describes how the characteristics of living creatures change with size. The term originally referred to the scaling relationship between the size of a body part and the size of the body as a whole, as both grow during development. However, more recently the meaning of the term allometry has been modified and expanded to refer to biological scaling relationships in general, be it for morphological traits (e.g., the relationship between brain size and body size among adult humans), physiological traits (e.g., the relationship between metabolic rate and body size among mammal species) or ecological traits (e.g., the relationship between wing size and flight performance in birds). Indeed, allometric relationships can be described for almost any co-varying biological measurements, resulting in broad usage of the term. However, a unifying theme is that allometry describes how traits or processes scale with one another. The study of allometry concerns the functional mechanisms that generate these scaling relationship, how they impact ecology, and how they respond to and influence evolution.
Allometry and Relative Growth
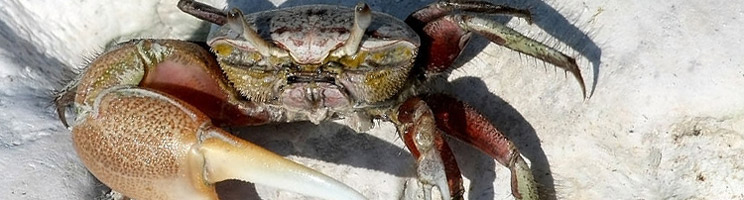
The term allometry was coined by Julian Huxley and Georges Tessier in 1936 (Huxley & Tessier 1936), when it was applied to the phenomenon of relative growth. Huxley had been studying the extraordinarily large claw (or chela) of the male fiddler crab, Uca pugnax, and was interested in how the crab grew to produce such an exaggerated trait (Figure 1; Huxley 1924). He measured the body size and chela size of crabs at different developmental stages and plotted the relationship between the two on a chart. The result was a curvilinear relationship that, remarkably, was linearized when the data were re-plotted onto a log-log scale (Figure 1). Even more interesting was the fact that the slope of this line was steeper than 1. This meant that for any unit increase in body size through time there was a proportionally larger increase in chela size. Thus Huxley deduced that the reason the chela was exaggerated in the fiddler crab was because it was growing at a faster rate than the rest of the body.
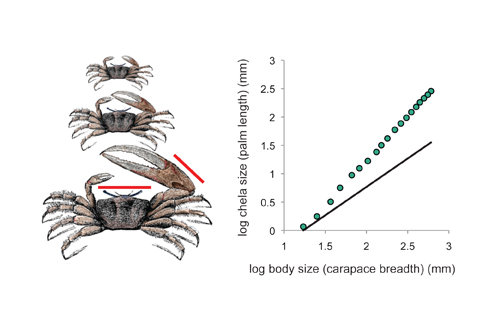
Figure 1: The allometric relationship between chela (claw) size and body size in growing male fiddler crab (Uca pugnax)
The red lines show the measurements made on the crab. When the data are displayed on a scatter plot, the relationship between chela and body size is curve-linear (A), which becomes linear when plotted on a log-log scale (B) and can therefore be described using a simple linear equation. The equation for the linear relationship indicates that its slope (which is the allometric coefficient α) is 1.57. Thus the relationship between chela and body size is hyperallometric. The blue line illustrates the allometric relationship if it were isometric and had a slope of 1. (Data from Miller 1973; illustration adapted from Cooper 1890)

Figure 2: The brain and heart grow at different rates relative to the body.
Growth of the heart is more or less isometric to body size, with an allometric coefficient (α) of 0.98. In contrast growth of the brain is initially hypoallometric to body size, with an allometric coefficient (α) of 0.73, before growth stops once the body reaches a certain size, at about age 6. Consequently, head size becomes proportionally smaller as individuals grow to their final body size. Illustrations show body proportions at birth, 2, 5 and 20 years of age. (Adapted from Moore 1983; Data from Thompson 1917)
log y = α log x + log b
where x is body size, y is organ size, log b is the intercept of the line on the y-axis and α is the slope of the line, also known as the allometric coefficient. When x and y are body and organ sizes at different developmental stages, the allometric coefficient captures the differential growth ratio between the organ and the body as a whole. When the organ has a higher growth rate than the body as whole, for example, the chela of male fiddler crab, α > 1, which is called positive allometry or hyperallometry. When the organ has a lower growth rate than the body as whole, α < 1, which is called negative allometry or hypoallometry. Organs that have negative allometry include the human head, which grows more slowly than the rest of the body after birth and so is proportionally smaller in adults than in children (Figure 2). When an organ grows at the same rate as the rest of the body, α = 1, a condition called isometry. Such an organ maintains a constant proportionate size (but not absolute size) throughout development.
Broadening the Concept of Allometry
Allometry literally means "different measure" and refers to the fact that allometric traits grow at a different rate than the body a whole. Thus, technically, an isometric relationship is not an allometry. However, the term allometry is typically used to refer to scaling relationships in general, of which a special case is isometry. Furthermore, allometries need not be linear on a log-log scale, or linear on any scale. They may be sigmoidal or discontinuous, in which case they are referred to as nonlinear allometries.
Huxley and Tessier were primarily interested in the relationship between organ and body size as both varied through development. However other researchers recognized that many physiological traits (e.g., metabolic rate) and ecological traits (e.g. running speed) also scale with body size. Further, this scaling was observed even when variation in trait and body size was not a consequence of developmental progression. Because of this the term allometry has been appended to describe different types of biological variation (Cheverud 1982). When x and y are traits measured in the same individual through developmental time, the relationship is called an ontogenetic allometry (Figure 3). When they are measured in different individuals at the same developmental stage within a population or species it is called a static allometry (Figure 3). When they are measured in different species the relationship is called an evolutionary allometry (Figure 3). For ontogenetic allometry, the slope of the allometry reflects the difference in growth rate between an organ and body size. For static and evolutionary allometries it reflects how variation in trait size is accompanied by variation in body size within a species (static allometry) or between species (evolutionary allometry). Consequently, although these different types of allometry may be functionally related, it is not necessarily true that a trait that is hyperallometric to body size for one form of allometry will be hyperallometric to body size for another form of allometry.
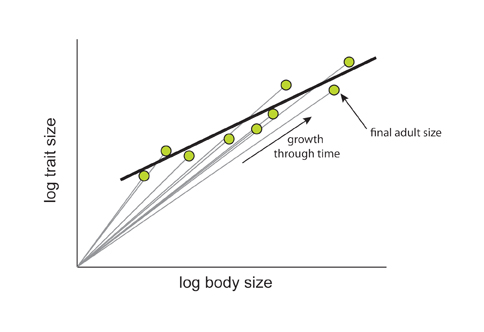
Figure 3: The relationship between ontogenetic, static and evolutionary allometry
(A) The relationship between ontogenetic and static allometry. The gray lines illustrate the ontogenetic allometry for brain size against body size in different individuals of the insectivore Suncus murinus, that is the relationship between brain size and body size as both grow during development. Each green point indicates the final brain and body size for different S. murinas individuals. The black line through the points shows the static allometry for brain size against body size in S. murinus. Since the slope of the line (α) is < 1, the relationship is hypoallometric. (B) The relationship between static and evolutionary allometry. Here the colored circles show the static allometries for individual insectivore species, with the colored squares show the mean brain and body size for each species. The blue line through the squares shows the evolutionary allometry for brain size against body size among insectivores. The slope of the line (α) is again < 1 indicating that the relationship is hypoallometric. However, note that the allometric coefficient for the intraspecific static allometry (α = 0.23) is not the same as the allometric coefficient for the interspecific evolutionary allometry (α = 0.69). (Figure 3B adapted from Gould 1971)
Biological Significance of Allometry
Both the slope (α) and the intercept (b) of allometries have biological meaning, although this meaning will depend on the scaling relationship in question. Consider, for example, the static allometry between wing size and body size in various hypothetical species of butterflies. Differences in the intercept of the allometry between species indicate differences in the proportionate size of the wing, irrespective of body size (Figure 4A–B). In contrast, differences in the slope of the allometry between species indicate differences in how the relative size of the wing changes with body size within a species (Figure 4 C–E). Thus the slope and the intercept for morphological static allometries captures the relationship between size and form within and between species. For physiological allometries, the slope and intercept are also important. For example, the slope of the evolutionary allometry between metabolic rate (in calories/day) and body size is the same in both marsupials (mammals that carry their young in a pouch) and eutherian mammals (mammals that have a placenta). The allometric coefficient α is approximately 0.75 for both (Figure 5). However, the intercept is lower in marsupials (b = 1.68) than for eutherian mammals (b = 1.85). Consequently, while the same biological principles likely determine how metabolism scales with body mass in the two groups, marsupials have lower metabolic rates for a given body size (Schmidt-Nielsen 1984).
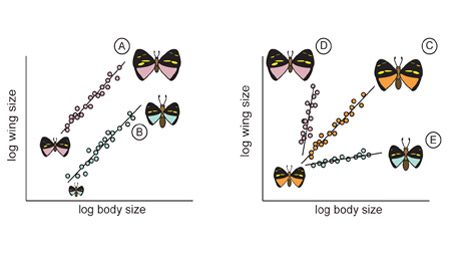
Figure 4: The morphological effects of changing the intercept and slope of a static allometry
Butterflies A through E are hypothetical butterfly species that vary in their wing-body static allometries. Species A and B differ in the intercept but not the slope of the wing-body static allometry. Consequently, species A has proportionally larger wings than species B, across all body sizes. Species C, D, and E differ in the slope of their wing-body static allometries. The static allometry is isometric, hyperallometric and hypoallometric for species C, D, and E respectively. Consequently, in species C the wing becomes proportionally larger in larger individuals, while in species D the wing becomes proportionally smaller in larger individuals. Illustrations show example butterflies for each allometric relationship. The color of each butterfly matches the color of its static allometry.
Morphological Allometry and the Evolution of Body Form
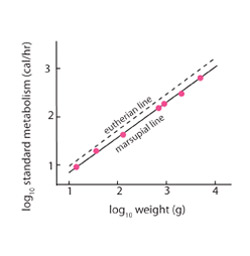
Figure 5: The evolutionary allometry between metabolism and body size in marsupials and eutherian mammals
The allometry has the same slope but a different intercept for marsupial compared to eutherian mammals, indicating a generally lower metabolism in the former. Points in blue are different marsupial species, blue line shows allometry for marsupials, red line shows allometry for eutherians.
Summary
Scientists have made great progress over the last 100 years recognizing and describing biological scaling relationships among myriad traits. These scaling relationships have made clear that many traits are genetically, developmentally, physiologically, and functionally integrated, so that changes in the scale of one trait (e.g., body size) changes the scale of another (e.g., metabolism). Nevertheless, the mechanisms that underlie this integration are far from obvious. What physiological mechanisms account for the scaling relationship between body size and metabolism? What developmental mechanisms ensure that some morphological traits (e.g., heart size in mammals) scale more or less isometrically to body size, while others (e.g., brain size) scale hypoallometrically? The next challenge in the study of allometry is to move from describing the patterns of scaling relationships to understanding the underlying processes that create those patterns.
References and Recommended Reading
Bonner, J. T. Why Size Matters: From Bacteria to Blue Whales, Princeton, NJ: Princeton University Press, 2006.
Calder, W. A. Size, Function and Life History. Cambridge, MA: Harvard University Press, 1984.
Cheverud, J. M. Relationships among ontogenetic, static, and evolutionary allometry. American Journal of Physiological Anthropology 59, 139-149 (1970).
Cooper, S. Animal Life in the Sea and on the Land: A Zoology for Young People. New York, NY: Harper & Brother, 1890.
Gayon, J. History of the concept of allometry. American Zoologist 40, 748-758 (2000).
Gould, S. J. Allometry and Size in Ontogeny and Phylogeny. Biological Review of the Cambridge Philosophical Society 41, 587 (1966).
Gould, S. J. Geometric Similarity in Allometric Growth: Contribution to Problem of Scaling in Evolution of Size. American Naturalist 105, 113-136 (1971).
Huxley, J. S. Constant differential growth-ratios and their significance. Nature 114, 895-896 (1924).
Huxley, J. S. & Tessier, G. Terminology of relative growth. Nature 137, 780-781 (1936).
Kleiber, M. Body size and metabolism. Hilgardia 6, 315-353 (1932).
Kolokotrones, T., Van, S. et al. Curvature in metabolic scaling. Nature 464, 753-756 (2010).
Miller, D. Growth in Uca, 1. Ontogeny of asymmetry in Uca pugilator (Bosc)(Decapoda, Ocypodidae). Crustaceana, 119-131 (1973).
Moore, K. L. The Developing Human. Philadelphia, PA: W. B. Saunders, 1983.
Samaras, T. T. Human Body Size and the Laws of Scaling. Hauppauge, NY: Nova Science Publishers, 2007.
Schmidt-Nielsen, K. Scaling: Why is Animal Size so Important? Cambridge, UK: Cambridge University Press, 1984.
Thompson, D. W. On Growth and Form. Cambridge, UK: Cambridge University Press, 1917.
West, G. B., Brown, J. H. et al. A general model for the origin of allometric scaling laws in biology. Science 276, 122-126 (1997).