


« Prev Next »
Introduction
Accurate determination of recharge in arid and semi-arid environments is required to be able to make reasonably informed decisions in the management of water resources. Recharge is a complex function of multiple environmental factors including precipitation duration and intensity, temperature, radiation, wind, slope, soil type, geology, antecedent moisture conditions, and vegetation. Because of the importance of knowing recharge rates, significant effort has been devoted to measurement or estimation of recharge. Of particular interest is improving the understanding of recharge in regions of limited precipitation due to their susceptibility to periods of drought. Recent studies have explored how recharge varies with precipitation in semi-arid environments, where a semi-arid climate is defined as having average annual precipitation less than 50 cm/yr (Scanlon, 2004; Scanlon et al., 2006). This understanding is of significant importance given that most of the western half of the continental United States can be classified as semi-arid or drier (Figure 1).
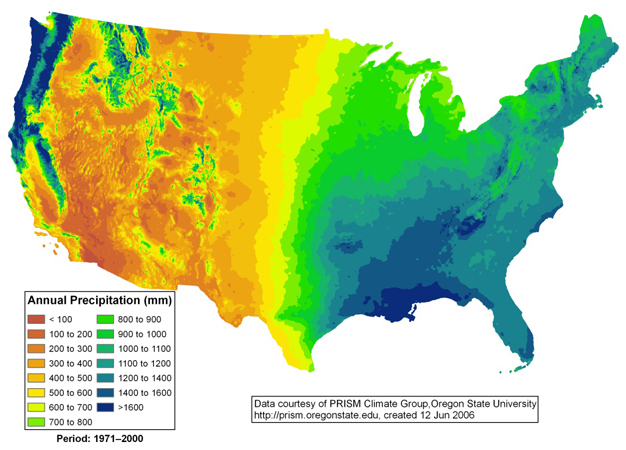
Figure 1
Annual average precipitation of the contiguous United States (PRISM Climate Group, Oregon State University. / 129.162.1.31).
© 2012 Nature Education Reprinted with permission: PRISM Climate Group, Oregon State University. All rights reserved. 
Recharge estimation methods can be categorized as direct, water balance, flux, and tracer (Kinzelbach et al., 2002). The choice of method selected to determine recharge is typically driven by which environmental variables have the greatest effect on recharge and what data are available. Most computational methods to calculate recharge are based on water- or energy-balance concepts. Water-balance models (Thornthwaite, 1948; Thornthwaite and Mather, 1955) estimate the balance between the inflow and outflow of water using the relationship
|
R = P - E + ΔS - Ro Eq (1) |
where, R = recharge; P = precipitation; E = evapotranspiration; ΔS = change in soil water storage; and Ro = run-off. In the absence of comprehensive environmental data, the water balance in the semi-arid areas can be approximated using river-discharge measurements. River discharge can be characterized using two flow components: baseflow and storm surge. Baseflow can be considered the groundwater contribution to stream flow and is interpreted to equal recharge (Arnold et al., 1995; White and White, 2001; Szilagyi et al., 2003; White, 2006; Ford and Williams, 1996).
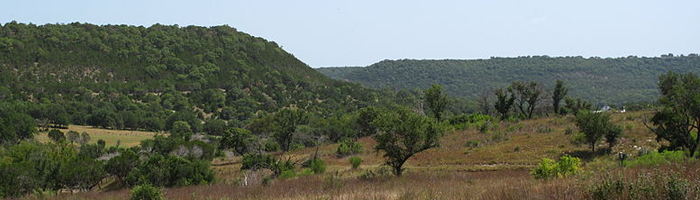
The focus of this study is to estimate recharge in a semi-arid environment using river-discharge measurements in regions where data needed for conventional recharge calculations are lacking. The Edwards Plateau in west-central Texas is used as a test case (Figure 2). The study area is characterized as rural, generally uncultivated, and with native vegetation. The near-surface geology is predominantly Cretaceous-age limestone with a thin (less than 0.5 m) veneer of soil. These units comprise the Edwards-Trinity Aquifer. The water table is relatively deep (> 15-45 m) so that riparian phyreatophytes are not a factor.
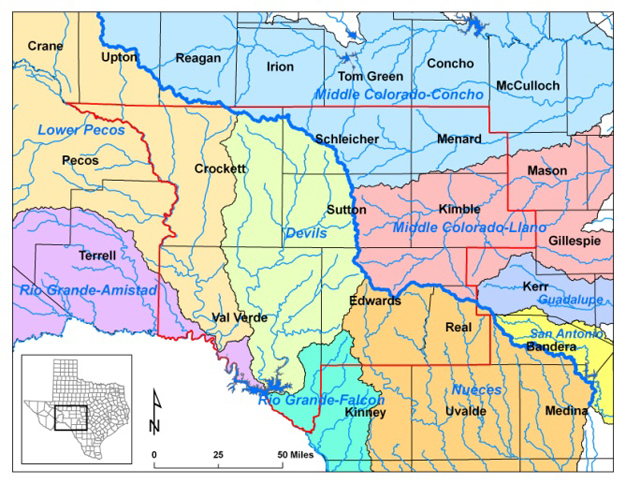
Figure 2
Map of the counties (black labels) and nine watershed basins (blue labels) of the major rivers of the study area (outlined in red). The blue line denotes the watershed divide between the Rio Grande on the southwest and the Colorado River on the northeast.
© 2012 Nature Education All rights reserved.
Fortunately, relatively long-term, river-discharge data have been recorded by the U.S. Geological Survey near the headwaters of surface watersheds in the study area (Figure 3). Because river discharge has been recorded over an area that varies from humid subtropical in the east, with an annual precipitation of approximately 50 to 80 cm/yr, to semi-arid in the west, with an annual precipitation of approximately 30 to 40 cm/yr, precipitation and recharge rates can be correlated. In addition, the relatively long-term, river-discharge data set allows for the exploration of the effect of changes in recharge due to variability in the annual rate of precipitation. The conceptualization that river baseflow discharge equates to recharge is only valid if rivers are gaining. This assumption is met in the study area with the exception of limited reaches of the Pecos River in the west and the San Saba River in Menard County. Inherent in this calculation is that pumping volumes are negligible, an assumption assumed valid because most wells in the Edwards-Trinity Aquifer are limited to domestic and stock demands.
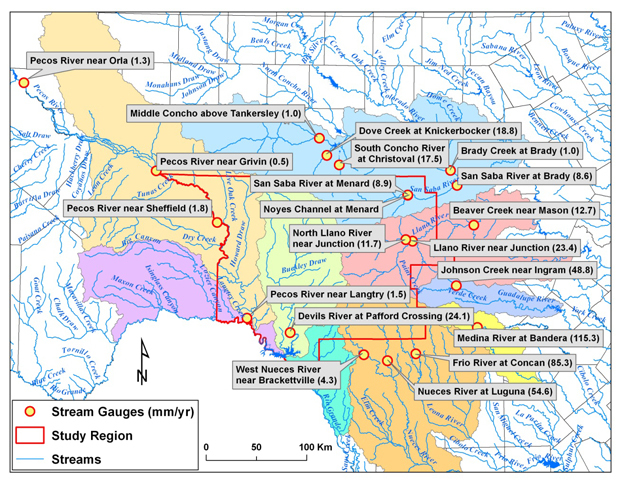
Figure 3
Locations of the U.S. Geological Survey gauging stations in and near the study area. Numbers in parentheses denote recharge rates in inches/year calculated using river discharge rates and corrected for base flow.
© 2012 Nature Education All rights reserved.
Calculation of Recharge
The fraction of river discharge attributed to baseflow was calculated for 19 river gauging stations in the study area (Figure 3). An automated baseflow separation and recession analysis tool, BASEFLOW, was used to estimate the amount of stream flow attributed to baseflow (Arnold et al., 1995; Arnold and Allen, 1999). The automated procedure predicted baseflow recession from the point on the hydrograph where it is assumed that all surface flow has ceased. Recharge rates for each watershed were then calculated by averaging baseflow discharge over the area of the watershed upstream from the gauging station. Calculated baseflow fractions of river discharge for the 19 gauging stations in the study area and average recharge rates for the respective upstream watersheds are summarized in Table 1.
|
Station Number
|
River |
Drainage Area (hectare)
|
Baseflow Fraction
|
Gross Discharge (cm/yr)
|
Adjusted Discharge (cm/yr)
|
|
08190000 |
Nuesces River at Laguna |
190,880 |
1.80 |
7.70 |
5.46 |
| 08190500 |
West Nueces River near Brackettville |
179,740 |
0.64 |
1.70 |
0.43 |
| 08195000 |
Frio River at Concan |
115,320 |
1.91 |
11.30 |
8.53 |
| 08178880 |
Medina River at Bandera |
84,950 |
1.73 |
17.20 |
11.53 |
| 08166000 | Johnson Creek at Brady |
29,520 |
1.51 |
7.87 |
4.88 |
| 08145000 | Brady Creek at Brady |
152,290 |
0.74 |
0.38 |
0.10 |
| 08144600 | San Saba River near Brady |
422,940 |
1.47 |
1.50 |
0.86 |
| 08144500 |
San Saba River at Menard |
292,150 |
1.22 |
1.83 |
0.89 |
| 08150800 |
Beaver Creek near Mason |
55,680 |
1.07 |
3.05 |
1.27 |
| 08148500 |
North Llano River at Junction |
236,720 |
1.17 |
2.54 |
1.17 |
| 08150000 |
Llano River at Junction |
478,880 |
1.63 |
3.68 |
2.34 |
| 08128000 | South Concho River at Christoval |
91,680 |
1.52 |
2.92 |
1.75 |
| 08130500 | Dove Creek at Knickerbocker |
56,460 |
1.93 |
2.49 |
1.88 |
| 08128400 | Middle Concho River at Tankersley |
289,040 |
0.53 |
0.43 |
0.10 |
| 08449400 | Devils River at Pafford Crossing |
1,025,210 |
1.93 |
3.18 |
2.41 |
| 08412500 |
Pecos River near Orla |
5,498,210 | 1.68 |
0.20 |
0.13 |
| 08446500 |
Pecos River near Girvin |
7,655,900 |
1.96 |
0.08 |
0.05 |
| 08447000 | Pecos River near Sheffield |
8,249,000 |
2.01 |
0.23 |
0.18 |
| 08447410 |
Pecos River near Langtry |
11,473,500 |
1.88 |
0.20 |
0.15 |
| Table 1: Baseflow fraction of river discharge. Discharge hydrograph recession separation was calculated using BASEFLOW. | |||||
Recharge can be assumed to be uniform over regions which exhibit similar geology, precipitation duration and intensity, temperature, radiation, wind, slope, soil type, antecedent moisture conditions, and vegetation. The contours of constant precipitation (i.e., isohyets) in the study area are north-trending, and the remaining factors that influence recharge are essentially uniform. Thus the reduction in calculated recharge from south to north indicates an additional hydrogeological mechanism is at play. This mechanism is interpreted to be groundwater piracy, the condition where groundwater and surface water divides are not concurrent and groundwater flows out of one surface-water basin to another (White, 2006).
Actual recharge was determined by averaging the calculated values for recharge along isohyets to estimate uniform rates of recharge for areas of uniform precipitation. Because the isohyets are essentially north trending in study area, uniform recharge rates should also be north trending. Following this reasoning, recharge was averaged between the gauging stations on the Frio River at Concan and on the South Llano River at Junction and between the gauging stations on the Nueces River at Laguna and on the North Llano River at Junction (Figure 3). The resulting average recharge rates were weighted relative to area to conserve mass. In this manner, an average recharge rate of 3.5 cm/yr was assigned to the combined watersheds of the upper Frio River and the South Llano River. In other words, groundwater lost from watersheds north of the surface water divide is appropriated to groundwater basins to the south of the surface water divide. The combined basins have a total area of 595,000 hectares and total recharge of 210.3 Mm3/yr. In this calculation, it is assumed that the area of the combined groundwater basins is the same area as the area of the combined surface watershed. Similarly, an average recharge rate of 3.07 cm/yr was assigned to the combined watersheds of the upper Nueces River and the North Llano River. These combined basins have a total area of 427,750 hectares and total recharge of 132 Mm3/yr.
Final recharge rates were calculated for the eight counties in the study area by taking an areal average of all recharge rates calculated within that county (Figure 4). The recharge rates are relatively uniform within areas of uniform precipitation, with the exception of Menard County. The reason for this discrepancy is that the San Saba River, which runs through the middle of Menard County, is a losing river. As mentioned previously, this violates a basic assumption for the river discharge computation method used elsewhere in the study area. Instead of a recharge rate of 1.3 cm/yr as indicated in Figure 4, the actual recharge rate should be closer to 3.3 cm/yr if the assumption of uniform recharge over areas of uniform precipitation is valid.
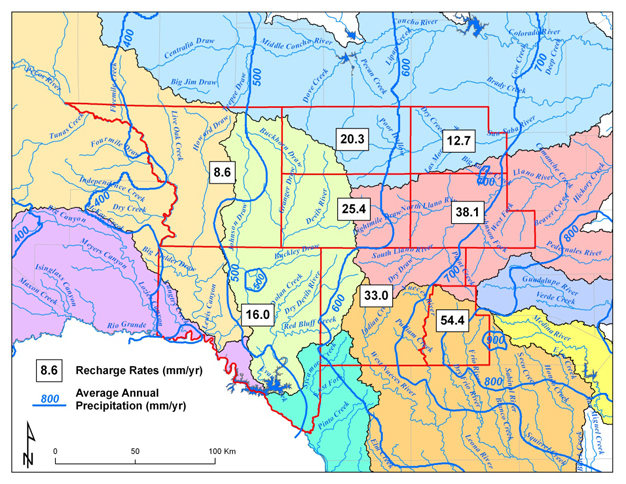
Figure 4
Recharge rates (cm/yr) by county calculated for river watershed basins. Thick blue lines denote contours for average annual precipitation (cm/yr).
© 2012 Nature Education All rights reserved.
Less information is available to estimate recharge at the western portion of the study area. River discharge measured on the Pecos River does not provide a valid estimate for recharge solely in Crockett County or western Val Verde County because the extent of the surface watershed is not well defined. Pumping from numerous irrigation wells near Fort Stockton in Pecos County has resulted in a large zone of depression in the Edwards-Trinity Aquifer that effectively truncates the watershed that discharges to the Pecos River. It is clear that recharge for Val Verde County is interpreted to decrease significantly from the east side of the county where precipitation averages 58 cm/yr to the west where average precipitation is as low as 38 cm/yr. Based on this interpretation, recharge for the Val Verde County is estimated at 1.6 cm/yr. Similarly, recharge for western Crockett County is estimated to be 0.43 to 0.86 cm/yr.
Recharge-Precipitation Relationship
Calculated recharge rates and precipitation can be used to establish a relationship between recharge and precipitation for the study area (Figure 5). As illustrated, there is an approximately linear relationship between recharge and precipitation with the exception that calculated for Menard County. The relationship suggests that recharge decreases linearly as precipitation decreases from 80 cm/yr in the southeast to a low of about 43 cm/yr in the northwest. Recharge approaches zero when precipitation decreases below about 43 cm/yr. This observation is consistent with findings by Scanlon (2005) and Scanlon et al. (2006) which suggested that recharge was minimal or negligible in semi-arid environments at precipitation rates below 50 cm/yr. A mathematical relation describing the correlation of recharge to precipitation in the study area can be written as
| R = 0.15(P - 42) for P > 42, R = 0 for P ≤ 42 Eq (2) |
where and P is precipitation (cm/yr). This expression provides a basis to predict recharge based on anticipated precipitation for the study area. Recharge as a percentage of precipitation varies from a high of 7% in Real County to a low of 2 % in Crockett County.
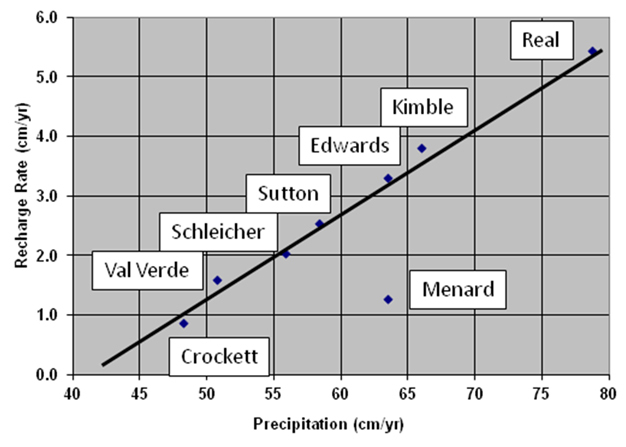
Figure 5
Graph of calculated recharge versus annual average precipitation for the eight counties in the study area. The black line is a linear approximation of the relationship between precipitation and recharge, excluding the outlier data point for Menard County.
© 2012 Nature Education All rights reserved.
Effect of Drought on Recharge
Annual precipitation varies considerably across the Edwards Plateau. The correlation between precipitation and recharge is assumed valid over both time and space. If this assumption is valid then the correlation can be used to predict how recharge rates will be affected during drought. Precipitation data collected for the period 1920–2000 at the Del Rio National Weather Service station in Val Verde County illustrate how precipitation varied with time in the study area (Figure 6). Average annual precipitation is 47 cm. Precipitation levels reduced by 10, 20, and 30 percent of average annual precipitation, which equate to 42, 37, and 33 cm/yr, are illustrated in Figure 6. From this graph it can be seen that these reductions in average annual precipitation occurred approximately 40, 30, and 20 percent of the time during 1920–2000.
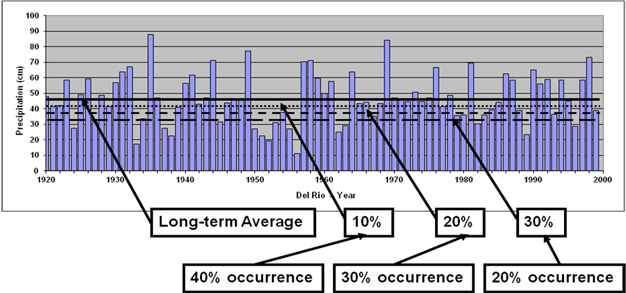
Figure 6
Annual precipitation measured at Del Rio by the National Weather Service. The top heavy line denotes the average annual precipitation of 18.43 inches. The dotted, short-dashed, and long-dashed lines below the solid line denote 90, 80, and 70 percent of average annual precipitation which equate with 16.59, 14.74, and 12.90 inches, respectively.
© 2012 Nature Education All rights reserved.
Predicted recharge based on Eq (2) for each county with precipitation reduced by 10, 20, and 30 percent is shown in Table 2. The percentage of precipitation that becomes recharge decreases from 7% when precipitation is approximately 80 cm/yr to approximately 2% when precipitation approaches 50 cm/yr and becomes negligible when precipitation approaches 40 to 43 cm/yr. Given this relationship, recharge becomes negligible in Crockett and Val Verde counties when annual precipitation is reduced by 20 percent, however annual precipitation has to be reduced by half in Real counties before recharge becomes negligible.
|
Crockett
|
Edwards
|
Kimble
|
Menard
|
Real
|
Schleicher |
Sutton
|
Val Verde
| |
| Area | 727,000 | 549,070 | 324,003 | 233,355 | 181,297 |
339,543 |
376,320 |
837,072 |
| Calculated Recharge Rate | 0.86 |
3.30 |
3.81 |
1.27 |
5.44 |
2.03 |
2.54 |
1.60 |
| Calculated Recharge | 62.8 |
181.3 |
123.4 |
29.6 |
98.5 |
69.0 |
95.6 |
133.9 |
| Predicted Recharge Rate | 0.95 |
3.24 |
3.62 |
3.24 |
5.52 |
2.10 |
2.48 |
1.33 |
| Predicted Recharge | 69.2 |
177.8 |
117.3 |
75.6 |
100.2 |
71.2 |
93.2 |
111.6 |
| Recharge rate at 10% reduction in precipitation | 0.23 |
2.29 |
2.63 |
2.29 |
4.34 |
1.26 |
1.60 |
0.57 |
| Recharge at 10% reduction in precipitation | 16.6 | 125.5 |
85.2 |
53.3 |
78.7 |
42.7 |
60.2 |
47.8 |
| Recharge rate at 20% reduction in precipitation | 0.00 |
1.33 |
1.64 |
1.33 |
3.16 |
0.42 |
0.72 |
0.00 |
| Recharge at 20% reduction in precipitation | 0.0 |
73.2 |
53.1 |
31.1 |
57.3 |
14.2 |
27.2 |
0.0 |
| Recharge rate at 10% reduction in precipitation | 0.00 |
0.38 |
0.65 |
0.38 |
1.98 |
0.00 |
0.00 |
0.00 |
| Recharge at 30% reduction in precipitation | 0.0 |
2.3 |
2.6 |
0.4 |
6.4 |
0.0 |
0.0 |
0.0 |
| Table 2: Prediction of recharge for each county based on the precipitation and recharge correlation calculated for the study area. Recharge rate is expressed in cm/yr and recharge is expressed in Mm3/yr. | ||||||||
Summary
Average annual recharge was calculated using river-discharge measurements to provide a basis to determine the relationship between precipitation and recharge in a sub-tropical humid to semi-arid environment. A linear relationship between precipitation and recharge was calculated for annual precipitation rates above approximately 40 to 43 cm/yr. At precipitation rates below 40 to 43 cm/yr, calculated recharge was negligible. Long-term precipitation rates are quite variable with 10-, 20-, and 30-percent decreases in precipitation occurring 40, 30, and 20 percent of the time, respectively. The result is that areas that experience reasonable recharge during years of average or above-average precipitation (i.e., areas with average precipitation above 40 to 43 cm/yr) can have negligible recharge during periods of decreased precipitation (i.e., drought).
References and Recommended Reading
Arnold, J.G. et al. Automated base flow separation and recession analysis techniques. Ground Water 33, 1010–1018 (1995).
Arnold, J.G. & Allen, P.M. Automated methods for estimating baseflow and ground water recharge from streamflow records. Journal of the American Water Resources Association 35, 411–424 (1999).
Ford, D. & P. Williams, P. Karst Geomorphology and Hydrology. London, England: Chapman and Hall. 1996.
Green, R.T. & Bertetti, F.P. "Investigating the Water Resources of the Western Edwards-Trinity Aquifer." Contract Report Prepared by Southwest Research Institute for the Sutton County Groundwater Conservation District. (2010).
Kinzelbach W. et al. "A Survey of Methods for Groundwater Recharge in Arid and Semi-arid regions." Early Warning and Assessment Report Series, UNEP/DEWA/RS.02-2. United Nations Environment Programme, Nairobi, Kenya. 2002.
Scanlon. B.R. et al. Global synthesis of groundwater recharge in semiarid and arid regions. Hydrol. Process. 20, 3335–3370 (2006). doi: 10.1002/hyp.6335
Scanlon, B. R. Evaluation of methods of estimating recharge in semiarid and arid regions in the southwestern U.S., in Hogan, J. F., Phillips, F. M., & Scanlon, B. R., eds., Groundwater recharge in a desert environment: the southwestern United States: Washington, D.C., American Geophysical Union, Water Science and Applications Series, 9, 235–254 (2004).
Szilagy, J. et al. Regional estimation of base recharge to groundwater using water balance and a base-flow index. Ground Water. 41, 504–514 (2003).
Thornthwaite, C. W. An approach towards a rational classification of climate. Geography Review. 38, 55–94 (1948).
Thornthwaite, C. W. and Mather, J. W. The water balance. Publications in Climatology, Drexel Institute of Technology, Laboratory of Climatology, New Jersey, USA. 8(1), 1-104 (1955).
White, W.B. Fifty years of karst hydrology and hydrogeology: 1953-2003. In: Harmon R.S., Wicks C. (eds) Perspectives on karst geomorphology, hydrology, and geochemistry: a tribute volume to Derek C. Ford and William B. White. Geological Society of America Special Paper 404, 139–152 (2006).
White, W.B. & White, E.L. Conduit fragmentation, cave patterns, and localization of karst ground water basins: The Appalachians as a test case: Theoretical and Applied Karstology, 13-14, 9–23 (2001).