
Abstract
Amidst the global upsurge in industrial robot deployment, there remains a notable gap in our understanding of their environmental impact. This paper explores how the introduction of industrial robots has changed air quality at both the local and neighborhood levels in China. Using the Spatial Durbin Model, we investigate the regional spillovers of PM 2.5 concentration and the diffusion of this innovative technology. Our findings reveal that the rise of robots significantly reduces air pollution in the local area, while exacerbating it in neighboring regions. This contrast is mainly because pollution-intensive industries are more inclined to relocate to neighboring regions than their cleaner counterparts, after the local use of robots increases. Throughout the process, internal costs rather than external costs dominate firms’ relocation decisions. This study provides novel insights into the complex environmental externalities associated with the spread of industrial robots and highlights the critical issue of growing environmental inequality in the era of emerging technologies.
Introduction
Among all the emerging technologies, the development of industrial robots stands out significantly. Since the 1990s, robotics technology has made significant advancements. In recent years, a number of developing nations have capitalized on the wave of the ongoing Industrial 4.0 revolution (Kozul-Wright, 2016). This trend has facilitated a rapid dissemination of robotic utilization across developing countries, exhibiting a nearly tenfold increase from 2000 to 2015. This increase is significantly faster than the growth seen in developed countries (World Bank, 2021). As shown in Fig. 1, by the end of 2019, the global inventory of industrial robots amounted to 2.7 million units, with applications spanning various sectors such as electronics, logistics, chemicals, and processing and manufacturing. Notably, China has emerged as the leading purchaser of industrial robots starting from 2013, reflecting its remarkable economic growth over the past four decades.

Note: calculated and made by the author.
The widespread adoption of industrial robots is expected to alter economic structure (Aghion et al. 2019) and enhance productivity (Acemoglu and Restrepo, 2020; Dauth et al. 2021; Gihleb et al. 2022). However, the potential for harmonizing economic growth and environmental improvement remains uncertain. While numerous studies have explored the influence of technological progress on environmental quality, findings have been inconsistent. Specifically, research on the environmental effects of industrial robots is limited, often focusing on the average effects rather than specific impacts (Luan et al. 2022). Given the potential disparities in global technological progress, the environmental externalities of uneven diffusion of new technologies should be well studied.
This paper attempts to fill this gap by investigating whether the use of industrial robots generates environmental externalities from a spatial perspective. We argue that the introduction of robots could reshape the uneven distribution of production efficiency across different regions (Luan et al. 2022). Greater robot penetration may improve local air quality by directly improving industrial structures, increasing energy efficiency, and reducing local pollution abatement costs, which is identified as the first environmental externality (Wang et al. 2022; Li et al. 2023; Wu, 2023). Furthermore, a regional increase in robot usage can also make former high-polluting industries uncompetitive locally, prompting physical or operational relocation to other regions with less emerging technology coverage (Acemoglu and Restrepo, 2020). This scenario represents the second environmental externality.
It is particularly important for China to discuss these environmental externalities in depth. China has experienced significant regional imbalances alongside notable economic growth. In the case of industrial robots, China’s industrial robots are mainly concentrated in the economically developed coastal regions. At the same time, air quality varies widely from region to region. As society develops, people’s demand for health and environmental comfort increases, while air pollution remains the most important environmental risk factor contributing to the burden of disease, disproportionately impacting vulnerable groups in China. It is therefore important to understand whether and to what extent this emerging technology contributes to uneven pollution distribution in China.
We use the Spatial Durbin Model (SDM) to test the whether the rising industrial robots in one area would reduce local air pollution while exacerbate it in neighboring areas. We transformed industry-level robot exposure data from the International Federation of Robotics (IFR) into a measure of robot penetration rate in Chinese cities. The spatial distance between cities, and the PM2.5 concentration of the cities were also mapped out. The results suggest a negative and significant relationship between robot exposure and local PM2.5 concentration, indicating that the adoption of industrial robots was accompanied by a decrease in PM2.5 concentration by about 6.89 μg/m3 during 2006 to 2019. However, considering the possibility of the pollution nearby transfer, the net effect of industrial robots on overall air quality may not be as straightforward. There is a positive spillover effect of robot use on PM2.5 concentrations in neighboring areas, suggesting that the increasing exposure to robots in the local area actually “pollutes” their neighborhood. Through rigorous analysis, alternative explanations were discounted. By revealing the complexity of environmental consequences associated with increased robot exposure, our study provides insights into equitable and sustainable policies in an era of emerging technologies.
This study fills in a significant gap in existing literature by offering a novel and comprehensive understanding of the complex environmental ramifications of emerging technologies. Previous research has focused on robots’ effects on carbon emissions, but the nuanced spillover effects on air pollution and their micro-mechanisms have been largely underexplored. Our paper introduces the concept of two-sided externalities from a micro perspective by examining the influence of technological advancements on corporate investment and location decisions using Chinese data samples. In addition, we delve into the theoretical underpinnings of industrial robots’ impact on environmental pollution and empirically validate two primary mechanisms: the industrial structure effect and the internal cost effect. Furthermore, our findings suggest that emerging technologies may intensify environmental inequality, supporting observations that developing countries bear a disproportionate burden of environmental pollution.
In addition to the above-mentioned, this study also contributes to numerous empirical literatures on assessing the environmental impact of industrial robots (Liu et al. 2022; Ding et al. 2023), the drivers of environmental inequality (Bell and Ebisu, 2012; Zheng et al. 2022), the analysis of externalities using spatial econometrics (Anselin, 2003; Autant‐Bernard and LeSage, 2011; Wu et al. 2023; Chiu et al. 2024), and the study of pollution industry transfer dynamics (Ben Kheder and Zugravu, 2012; Dou and Han, 2019).
The rest of the paper is organized as follows. Section “Literature review and research hypothesis” presents a theoretical model, formulates the hypotheses, and summarizes the two-sided externalities of industrial robots on air pollution. The data descriptions, variable definitions, and spatial econometric specifications are described in Section “Materials and methods”. Section “Empirics results” presents the empirical results with robustness checks. Further discussion on the space-time characteristics of industrial robot induced pollution near transfer (IR-PNT), with the embodied mechanism, is presented in Section “Further discussion on IR-PNT”. The last section concludes the paper.
Literature review and research hypothesis
This study focuses on the environmental externalities of industrial robots in China from a spatial perspective, including both local and neighboring impacts. Recognizing the multifaceted ways in which emerging technologies influence air quality, we analyze these impacts as two-sided externalities. First, industrial robots directly affect local air quality by improving the overall industrial structure of the local area, increasing energy efficiency, and reducing the cost of pollution control. Second, the diffusion of this technology may indirectly worsen the ambient quality of the neighborhood by facilitating the relocation of pollution-intensive business (Chun et al. 2015). The specific mechanism is discussed below.
First externality: cleaning the air
It is supposed that the industrial robots have a direct impact on local air quality by improving the local industrial structures, boosting energy efficiency, and reducing pollution control expenses.
First, the introduction of industrial robots can lead to an advanced industrial structure, which is widely acknowledged for promoting cleaner production and reducing pollutant emissions (Gao and Yuan, 2021). The incorporation of industrial robots facilitates knowledge and technological spillovers, accelerating the development of new technologies and products across diverse sectors, thereby reshaping the industrial landscape. As supported by a growing body of research, the introduction of robots plays a pivotal role in industrial upgrading, fostering industrialization and modernization (Hägele et al. 2016; Jung and Lim, 2020). On a detailed technological level, the application of industrial robots exhibits a dual impact on labor demand, characterized by substitution and heterogeneity. Automation primarily targets the replacement of repetitive tasks and positions typically held by low-skilled workers, consequently shifting the industrial structure towards a more capital-intensive configuration (Graetz and Michaels, 2018). Aghion et al. (2017) demonstrated how the integration of artificial intelligence and traditional production methods in different industrial sectors influences the evolution of industrial structure. This effect is dominant in the manufacturing sector, as the application of industrial robots promotes the expansion of this very manufacturing sector, where the use of industrial robots also stimulates growth in related service industries through the manufacturing scale effect (Acemoglu and Restrepo, 2020).
Second, the integration of robots in the initial stages of the production process can enhance the energy transition and boost energy efficiency, thereby reducing enterprises’ pollution emissions. China faces significant environmental pollution problems resulting from inefficient energy consumption (Zhang et al. 2013). Energy inefficiencies are prevalent across various stages, including development, processing, conversion, transmission, distribution, and end-use. Emerging technologies offer a pathway to the energy transition by bolstering the efficacy of energy systems and reducing transition costs (Bocca et al. 2021). They can also accelerate the adoption and application of renewable energy sources and equipment. For example, the application of robots in enterprises can optimize technological processes of coal combustion or encourage the adoption of cleaner energy alternatives, subsequently enhancing energy efficiency and reducing pollution emissions (Sheng and Bu, 2022). Overall, by facilitating the energy transition at the production level, industrial robots reduce pollution emissions.
In addition, the clean effect of robotics can be further explained from a microscopic perspective through the variation of abatement costs. For example, industrial robots can reduce material losses in manufacturing and supply chain operations. They also facilitate the implementation of digital environmental monitoring and accounting systems, enabling efficient measurement, reporting, and verification of environmental impacts. Concepts like smart recycling systems, which repurpose waste into high-quality reusable materials, further illustrate this point (Dusík et al. 2018; Wilts et al. 2021). Consequently, the adoption of industrial robots is associated with reduced abatement costs (Wang and Feng, 2022). However, abatement costs are not constant across firms. In regions where the majority of firms do not utilize industrial robots, abatement costs will be relatively higher due to less efficient in terms of profitability and resource efficiency. Faced with this disparity, companies will generally consider whether to leave or stay according to the level of abatement costs (Shen et al. 2017). They may either invest in eco-friendly technologies to manage their emissions or relocate robots to areas with lower relative emission costs to gain operational and abatement advantages. This decision-making process is further detailed in the following subsection (see the next subsection for details).
Moreover, these effects demonstrate variability linked to local developmental stages and industrial configurations. In some contexts, the rebound effect of robot usage on environment have been found in nations of different development stages and industrial structures (see, e.g., Li et al. 2022; Luan et al. 2022; Zhu et al. 2023). For instance, sectors such as manufacturing, agriculture, and utilities, including electricity, gas, and water supply, the deployment of industrial robots markedly enhances the efficiency of energy equipment. This leads to a notable reduction in emissions, especially in high-pollution enterprises and those in regions with more relaxed environmental regulations, as identified by Zhu et al. (2023). Therefore, Proposition 1 can be summarized as follows.
Proposition 1: The diffusion of industrial robots could generally improve local air quality, but the impact may vary due to heterogeneity in regional development stages and industrial structures.
Second externality: industrial robot induced pollution nearby transfer (IR- PNT)
From a micro perspective, technological progress not only drives local enterprises to further innovate and reduce pollution emissions, but also affects the location decisions of enterprises. According to the new economic geography theory, technological progress is a critical determinant of the location of firms (Fujita and Krugman, 2004), while migration (in a broad sense, including the relocation in the physical sense and transfer of heavy pollution production business) is one of the main strategies with which firms respond to the penetration of new technologies (Pellenbarg et al. 2002; Aduba and Asgari, 2020). Then, intuitively, this technological advancement intuitively reshapes the uneven distribution of production efficiency across regions (Florida et al. 2008). A higher local adoption rate of emerging technologies corresponds to an increased likelihood of the relocation of highly polluting firms, which tend to have lower production capacities, to neighboring areas (Milani, 2017). Subsequently, the movement of these polluting entities on a micro level result in a substantial reduction of local air pollution. However, this also gives rise to a contrasting trend in neighboring regions, where the risk of environmental degradation emerges (Bommer, 1999). Realistic examples confirm the possibility of the existence of this effect: in Langfang and Zunhua, Hebei, which are adjacent to Beijing, the share of value added in the secondary sector is still rising from 2014 to 2017.
In other words, the introduction of industrial robots will also lead to the so-called “Baumol’s disease”, where the application of new technologies changes the local industrial layout and factor endowment, leading to huge variations in the competitive advantages of different regions (Bartelsman and Doms, 2000; Juhász et al. 2020; Benhabib et al. 2021). Even if only a limited number of firms adopt industrial robots in their operations in a given area, the rest of the firms can more easily learn from the “forerunners” and thus benefit much more from the positive externality of knowledge diffusion through the industrial chain and business ecosystem (Aghion et al. 2017). In this way, the adoption of industrial robots in a certain region can affect the costs and returns of firms, which can further encourage firms to innovate or relocate.
Next, a theoretical illustration of this view is provided. The model proposed by Levinson and Taylor (2008) and Shen et al. (2017) is extended to a multi-regional model, where the penetration of industrial robots is considered as the dominant factor influencing the variation in production costs, as it determines whether it is feasible and realistic for a firm to implement automation in its production, as well as the significant savings in labor costs that can be achieved by replacing humans with robots (Soergel, 2015; Graetz and Michaels, 2018).
Three regions, numbered “I”, “II”, “III” are considered. The model is partial equilibrium, and the price of production factors and is exogenous. Without loss of generality, we have made the following three assumptions: From a regional perspective, the production cost is greatly reduced due to the improvement in productivity; 2) For a representative company without industrial robots, the relative cost of emitting pollutants is χI > χII > χIII. The introduction of robots by other firms can increase the relative cost of pollution for firms without robots; 3) The demand of investment in abatement technologies is generally higher for pollution-intensive enterprises. The intuition is that the average productivity of enterprises will increase after the popularization of industrial robots. But for representative enterprises without robots, it is equivalent to losing their relative productivity and facing a higher cost of emitting pollutants. In the initial state, the continuum of industries of region I is indexed by \(\nu \in [0,1]\) while there are no industries in regions II and III; The pollution intensity of industry \(\nu\) is \(\sigma (\nu )\) and \({\sigma }^{{\prime} }(\nu ) > 0,0 < \sigma (\nu ) < 1\). The production cost per unit product in regions are \({c}_{I},{c}_{{II}},{c}_{{III}}\), and \({c}_{I} < {c}_{{II}} < {c}_{{III}}\). Labor and capital flow freely between regions, and the relocation costs of fixed assets should be taken into consideration when industry \(\nu\) in region I moves to regions II and III; The distance between region I and region III is greater than that between region II and region III, so the production cost per unit product of industry \(\nu\) in region II is higher.
θ is the share of enterprises’ inputs used in environmental-friendly technologies. The production function \(F\left(K\left(\nu \right),L\left(\nu \right)\right)\) satisfies the constant returns to scale (CRTS). The output \(Q(\nu )\) and the pollution discharge \(E(\nu )\) are as follows:
The representative enterprise in region I aims at the maximum profit by choosing θ:
The first order derivative w.r.t θ is:
This is consistent with our intuition above that the greater the penetration of local industrial robots, the greater the pollution abatement efforts of enterprises in the area, thus improving air quality.
Based on Eq. (1), the production function with pollution emission and finished products as input factors can be written as:
As \({{\rm{\chi }}}_{I}\) and \({c}_{I}\) are the shadow prices of pollution emissions and production, respectively. The first order derivative w.r.t \(\nu\) is:
For the same reason, the unit costs of enterprise in regions II and III are:
The condition for an enterprise to relocate from region I to region II is:
Suppose an interior threshold industry level \(\widetilde{v}\) meets \({C}_{{II}}(\widetilde{v})={C}_{I}(\widetilde{v})\):
As \({\sigma }^{{\prime} }(v) > 0,0 < \sigma (v) < 1\), the EQ. (7) holds under \(v > \widetilde{v}\), suggesting that the rational decision for enterprise in region I is to relocate to region II.
And Eq. (9) show the negative association between \(\widetilde{v}\) and \({{\rm{\chi }}}_{I}\):
Hence the following Propositions 2a and 2b is straightforward:
Proposition 2a: Considering the penetration of industrial robots, the pollution-intensive enterprises would choose either to innovate locally or to relocate to the neighborhood; moreover, the greater the comparative disadvantage of the pollution-intensive enterprises, the more likely they are to choose to relocate to the neighborhood.
Proposition 2b: As the penetration of industrial robots increases, the likelihood that highly polluting enterprises will relocate nearby will increase, resulting in worse air quality in the neighborhood (IR-PNT effect).
Extend the conclusion to three areas. Consider the interior threshold industries \(\overline{\overline{v}}\) meets \({C}_{I}(v) < {C}_{II}(\overline{\overline{v}})={C}_{III}(\overline{\overline{v}})\):
As \({{\rm{\chi }}}_{{II}}\) > \({{\rm{\chi }}}_{{III}}\), \({\sigma }^{{\prime} }\left(v\right) > 0,\,0 < \sigma (v) < 1\), the enterprise would like to move again from region II to region III.
In practice, a company’s decision to relocate relies heavily on an overall cost-benefit analysis. The costs of relocation can generally be divided into external and internal costs. For example, the external cost of firm relocation usually includes transportation links and information infrastructure, which are crucial for maintaining connectivity and operational efficiency post-relocation (Audirac, 2005); Internal costs, on the other hand, encompass aspects like the reallocation of current assets and employee wages, which significantly influence a firm’s financial capabilities and willingness to relocate (Pennings and Sleuwaegen, 2000). Additionally, the distance for relocation emerges as a pivotal factor, influencing both the feasibility and cost-effectiveness of the move. This aspect forms the basis for the spatial econometric models used in our analysis (Ben Kheder and Zugravu, 2012). Based on the conclusion of this part of the analysis, Propositions 3a and 3b can be proposed as follows:
Proposition 3a: The IR-PNT effect is influenced by geographical distance. Firms tend to relocate to closer areas due to lower overall migration costs, resulting in a more pronounced concentration of industrial activities in nearby regions, and thereby intensifying the IR-PNT effect.
Proposition 3b: The heterogeneity of the IR-PNT effect is significantly shaped by the varying levels of external and internal migration costs faced by local firms. These costs influence firm decisions on relocation, affecting the distribution and intensity of the IR-PNT effect across different regions.
Materials and methods
Data sources
The raw data is obtained from the IFR, which contains the number of robots by industry, country and year, based on the annual surveys of robot suppliers. The data of China used in this paper is extracted from 2006 to 2019, because the robot industry in China was undeveloped in the 90s and its boom started in 2006, the industry-specific data was only provided in 2006. Therefore, the consistent data of robots in 7 broad industries (roughly at the two-digit level), i.e., agriculture, forestry, and fishing; mining; manufacturing; utilities; construction; education, research, and development; and non-specific industries, are adopted. In manufacturing, consistent data on the use of robots are collected for 11 industries for more detail (roughly at the 3-digit level): food and beverage, plastics and chemical products, rubber and plastic products (non-automotive), fabricated metal products (non-automotive), electrical machinery, electronic components/devices, semiconductors, liquid crystal display (LCD), light-emitting diode (LED), automotive, motor vehicles, engines and bodies, unspecified auto parts, and other vehicles.
In terms of outcome variables, surface PM2.5 data from van Donkelaar et al. (2021), who lead an annual global satellite-based estimate combining the instruments of NASA MODIS, MISR, and SeaWIFS and calibrated using a geographically weighted regression, are used to construct measures of annual PM2.5 concentration for each prefecture-level city (For details, see: https://sites.wustl.edu/acag/datasets/surface-pm2-5/).
To control for the potentially confounding factors that are not of interest here, information from the China Statistical Yearbook, the China Energy Statistics Yearbook, the China Environmental Statistics Yearbook, and the China Energy Statistics Yearbook is collected, and a set of economic and environmental indicators are obtained to primarily mitigate the bias from omitted variables (Wu et al. 2023; Jiang et al. 2024). See Table 1 for the detailed definition of the covariates.
Indicators of exposure to robots
We focus on the industrial robot use at the city level and mainly use the IFR dataset. As the most detailed data source available on industrial robots, IFR data have been popular in many studies such as those by Giuntella and Wang (2019), Anelli et al. (2019), and Acemoglu and Restrepo (2020). However, there are still some challenges in calculating the number of industrial robots per worker using IFR data. First, the different industrial classification methods make it difficult to map the raw data one-to-one to the Chinese Industry Classification System (CICS). Second, data on the distribution of labor in some industries are not available in China. In view of this, the IFR data are mapped to CICS, and the focus is only on the robotic installations with available labor data, which account for 29.2% of the total raw data.
In light of these challenges, our methodology aligns with established practices in the existing literature (Acemoglu and Restrepo, 2020), where the robot usage at the city level is calculated to represent the technological impact of robots. The first step is to calculate the exposure to robots at the industry level:
where \({\rm{MR}}_{{it}}\) donates the stock of industrial robots of industry i in year t, and \({L}_{i,t=2005}\) is the number of labors of i industry based on 2005.
Second is to construct the city-level industry robot usage index:
where I represents the collection of various industries. \({L}_{i,j,t=2005}\) is the number of labors of industry i in city j in 2005. \({\rm{Mean}}\,{L}_{i,t=2005}\) is the mean of labors of industry i in 2005. It is notable that \({L}_{i,j,t=2005}/{\rm{Mean}}\,{L}_{i,t=2005}\) is the proportion of number of labors in industry \(i\) and region j to the average number of labors of the industry, representing the relative labor force proportion.
Since the industry classification standard in China’s statistical system is not exactly the same as the IFR, we apply the employment data at the city and industry level from the China Labor Statistics Yearbook and merge it with the major industries provided by the IFR, so as to obtain the relative share of labor in industry i at the city level in year t. Then, we calculate and obtain the target variable \({\rm{Robot}}_{{jt}}\).
Finally, since the distribution of cities’ exposure to robots is substantially right-skewed, we adopt its logarithmic version, which is essentially the normal distribution in the empirics.
Spatial econometric model
We selected the SDM for its effectiveness in addressing the issue of spatial dependence in the study of the environmental impacts of emerging technologies. The SDM’s spatial weight matrix captures the geographical distribution and interactions of economic activities, which is essential for understanding the diffusion of pollutants and the influence of environmental policies across regions. Furthermore, its flexibility allows it to be adapted to specific research contexts, making it suitable for exploring the micro-mechanisms of spillover effects. In addition, our dataset fits well with the data requirements of the SDM, promising insightful results. The accuracy and theoretical relevance of this model outperform other models considered, making it the optimal choice for our study.
Spatial correlation test
Spatial correlation test reflects whether there is a correlation between any two geographical entities. The global Moran’s I value (GMI) is used to test the existence of spatial correlations, defined as:
where N is the number of observations, i and j are the two dimensions of coordinates. xi i are the observations of cell i with the mean \(\bar{x}\). And there is a theoretical possibility that the global spatial correlation test may ignore the features of atypical local area, Anselin (1995) therefore proposed a local version Moran’s I value (LMI) formulated as follows:
where wij is the spatial weight of two adjacent regions based on the specific spatial relationships and \(W\) is the double summation of wij on i and j that \(W=\mathop{\sum }\nolimits_{i=1}^{n}\mathop{\sum }\nolimits_{j=1}^{n}{w}_{{ij}}\). Take the geographical adjacency weight matrix \({w}_{{ij}}^{a}\) for instance, it follows the rule that it is equal to 1 if regions i and j are spatially adjacent, and 0 otherwise. An alternative method used in this paper is to assign weights using the decay functions, such as the geographical distance weight matrix \({w}_{{ij}}^{d}\):
where \({\phi }_{i}\) and \({\phi }_{j}\) donate the spherical coordinates of the centroids of regions i and j respectively, \(\Delta \tau\) is the difference of coordinates between regions i and j. \(R\) is the earth radius, approximately 3958.761 miles. The geographical distance weight matrix is standardized by rows and its diagonal elements are set to 0.
Spatial econometric model
Spatial autoregressive model (SAM) and spatial error model (SEM) are two typical categories for spatial econometric setting (LeSage and Pace, 2009). And LeSage et al. (2015) construct a spatial panel data model called SDM, in consideration of the spatial correlation of the dependent variables as well as the independent variable by adding the spatial lag terms of endogenous and exogenous factors. Since the spatial effect of industrial robot exposure and environmental pollution in a certain region may both be correlated with environmental pollution in nearby regions, we apply the SDM, and the model of this paper is expressed as follows:
where \({\mathrm{ln}{PM}}_{{it}}\) denotes the particulate matter concentrations in the logs of each city I in year t; \({{IR}\exp }_{{jt}}\) denotes the industrial robots’ exposure in the logs of each city j in year t; X consists of a vector of control variables, and as noted above. \({w}_{{ij}}\) represents the elements of the n×n order spatial weight matrix and the geographical adjacency weight matrices and geographical distance weight matrix is used in this paper. λ includes the prefecture-level city and year fixed effects. Besides, the \(\rho\) and \(\theta\) in Eq. (17) represent the spatial regression coefficient of the explanatory variable and the explained variable, respectively. Specifically, \(\rho\) reflects the spatial dependence of environmental pollution in neighboring regions, and \(\theta\) reflects the degree of influence of industrial robot exposure in neighboring regions on environmental pollution in the local area.
After analyzing the impact of industrial robots on environmental pollution using the spatial econometric model in Section “Empirics results”, the IR-PNT effects are further discussed in Section “Further discussion on IR-PNT”. By using SDM, it is also shown that by changing the factors of comparative resource abundance of a region, the installation of robots will inevitably affect the relocation decision of enterprises and factories, and then the air quality of neighboring areas.
Empirics results
Spatial correlation tests
The results of the GMI (see Table 2) show that all Moran’s I indices of PM 2.5 from 2006 to 2019 are significantly greater than zero, indicating that the air pollution levels of cities in China are basically spatially autocorrelated. Moreover, the GMI of PM 2.5 is relatively stable during the study period, indicating the consistency of the level of spatial agglomeration. Therefore, the spatial econometric model is necessary to explore the relationship between air pollutants and other factors.
The above results are consistent with the previous literature, generally Chen et al. (2017) and Feng et al. (2019). Urban air quality in China is spatially autocorrelated with a stable trend. It is widely recognized that due to geographical relationships, the mutual transmission of pollutants exacerbates regional pollution. In fact, the formation of PM 2.5 is not only related to physical and chemical factors (such as atmospheric conditions, temperature and humidity, etc.), but also related to anthropogenic economic activities, such as the distribution of heavily polluting and energy-consuming enterprises. In this case, since neighboring cities tend to have similar socio-economic characteristics, and the PM 2.5 of these cities are also quite similar.
To investigate the local characteristics of PM 2.5, the local Moran’s I scatterplots of PM 2.5 at the beginning and end of the study period are also presented (see Fig. 2). The scatterplots can be divided into four quadrants, which indicate the local spatial correlations between regions (Feng et al. 2019). The first and third quadrants represent positive spatial correlations, while the second and fourth quadrants represent negative spatial correlations. From Fig. 2, it is clear that PM 2.5 is positively correlated in most cities, with a shorter spatial distance between different regions indicating a similar concentration of PM 2.5. Overall, highly polluted cities in China tend to cluster together, as do clean cities throughout the study period.

A Local Moran’s I in 2006 B Local Moran’s I in 2019. Note: Due to the length of the paper, only part of the results are shown, but we accept any request for results.
Baseline regressions
In order to clarify the relationship between industrial robots and local air pollution, we first estimate how the presence of industrial robots affects the average level of air pollution, and present the results in Table 3. Columns (1) and (3) show the case without control variables, while columns (2) and (4) include them sequentially. To test the robustness of the results, the first two columns use the (0–1) adjacency matrix, while the last two columns use the geographical distance matrix.
Unlike traditional non-spatial models, the spatial econometric model incorporates circular feedbacks between independent and dependent variables in local and nearby areas. Therefore, the estimated coefficients in the first two rows of Table 3 cannot reflect the marginal effects of the independent variables on the dependent variable. As outlined by Elhorst (2014), the marginal effects should be explained by the direct and indirect effects in the SDM, respectively, and we estimate these effects accordingly.
For the direct effect, the coefficients of IRexp indicate a negative and significant correlation between industrial robot exposure and PM2.5 after controlling for socio-economic variables and city-level fixed effects, which verifies the proposition of the first environmental externality (local cleaning effect), i.e., Proposition 1. Taking column (4) as an example, cities with the highest exposure to industrial robots experience a 61% (0.0184 × (2.22 - 0.065) / 0.065) reduction in PM2.5 concentrations compared to that of cities with average exposure to industrial robots, simply due to the increasing exposure to industrial robots in the local area (with the highest and average values of exposure to industrial robots being 2.22 and 0.065, respectively). Moreover, the resulting value suggests that during the period 2006 - 2019, the introduction of industrial robots will reduce the average PM2.5 concentration by approximately 6.89 μg/m3 (50.6*0.0184 × ((0.126 - 0.015) / 0.015), where 50.6 μg/m3 is the actual PM2.5 concentration in 2006. Based on the empirical dose-response relationship estimated by Burnett et al. (1999) and Pope et al. (2008), this reduction of 6.89 μg/m3 from 2006 to 2019 averted the risk of hospitalization for cardiopulmonary disease and heart failure by 2.27% (6.89 × (0.33%) and 9.03% (6.89 × (1.31%), respectively, nationally.
However, considering the possibility of IR-PNT, the overall cleaning effect of industrial robots may be limited. For the indirect effect, the coefficients of W_IRexp indicate that the industrial robot exerts a positive spillover effect on PM2.5 in neighboring regions, which means that the higher the exposure to industrial robots in the local area, the higher the PM2.5 in the neighboring areas will be. It can be understood as the fact that the higher exposure to industrial robots will “pollute” its neighborhood. This result confirms the proposition of the second environmental externality (IR-PNT) proposed hereby, i.e., Propositions 2a and 2b. Specifically, column 4 shows that the 1% increase in exposure to industrial robots in neighboring regions increases the PM 2.5 in the local area by 0.11% on average, although this effect is insignificant. It will be further specified in the next section.
Additionally, the coefficients of S_rho show that air pollution has a significant positive spillover effect: The 1% increase in PM 2.5 in neighboring regions leads to at least 0.23% higher PM 2.5 in the local area, which is consistent with the spatial correlation test mentioned above in Table 2.
Overall, industrial robots have a spillover effect on air quality, leading to increased pollution. This finding is consistent with Nguyen et al. (2020) and Liu et al. (2022), which indicate that the development of new and emerging technologies is not always good for the environment. Our finding is also similar to Chen et al. (2022), which found that emission reduction efforts in clean energy development are offset by CO2 transfer effect.
Heterogeneity analysis
In this section, the heterogeneous effects of industrial robots on air pollution are analyzed. Column (2) in Table 4 performs the spatial regression according to the location of the cities, while column (3) in Table 4 performs the spatial regression according to the size of the cities. For the direct effect, the coefficients of East_ IRexp and Metro_ IRexp are negative, unlike W_ IRexp in the baseline, indicating that as the number of industrial robots increases in the east and in the metropolis, the local cleaning effect is even greater. For the indirect effect, combining the coefficients of IRexp, East_ IRexp and Metro_ IRexp, there will be a “cleaning” effect in the metropolis and a small one in the eastern areas, although not significant. This result differs from the baseline. This may be because there is a stronger climate in the east that encourages firms to invest in green and innovative technologies rather than relocating to pollute neighboring areas (Zhang et al. 2024).
Our findings are not consistent with Ding et al. (2023), whose heterogeneity analysis suggests that AI reduces carbon emissions through spatial spillovers, with the effect being stronger in the Midwest. In contrast, our analysis indicates a stronger effect in the Eastern regions. This discrepancy may be attributed to differences in the data scales used: Ding et al. (2023) employed provincial panel data, our study is based on city-level data. At the same time, the firms that emit large amounts of carbon and cause air pollution do not exactly overlap. This variation in the distribution of high-emission firms may significantly influence the regional impact of AI on environmental outcomes.
From Table 5, we can see that the regression results of PM2.5 at different quartiles show significant variations, and the local cleaning effect of industrial robots is stronger in areas with higher PM2.5. From the perspective of effect decomposition, the indirect effect dominates the total effect of the pollution reduction effect of industrial robots in the cities with PM2.5 at different quantiles. Surprisingly, the increase in robots in clean areas increases the pollution of neighboring regions considerably, and this effect gradually declines as PM2.5 is mitigated into a cleaning effect in neighboring regions. This suggests that the IR-PNT effect that we find in the baseline regression is mainly caused by the introduction of industrial robots in the cleaning area. This may be because polluters in cleaner areas already face high marginal abatement costs, exacerbating their relative local disadvantage. As a result, they are more likely to relocate to nearby areas to avoid competition.
Robustness checks
To assess the robustness of the effect of industrial robots on air pollution, the sample window from 2009 to 2017 in column (1) is narrowed to eliminate the boundary effect of the data, as shown in Table 6. In addition, a region-based placebo test is adopted in column (2) by randomly assigning the exposure to industrial robots of each region in a normal distribution manner. Column (3) includes the first and second lags of the dependent variables to overcome the serial correlation. Lastly, in column (4), a difference-in-difference model is set up to test the effect of industrial robots on air pollution, taking the document of Guiding Opinions of the Ministry of Industry and Information Technology on Promoting the Development of Industrial Robot Industry as a shock that occurred in 2013 and taking the proportion of employees in tertiary industries as the policy treatment effect, a difference-in-difference model is established to check the effects of industrial robots on air pollution.
In summary, the result drawn here has passed all the robustness checks, and the pseudo-shock cannot reject the null hypothesis even at the 10% significance level. It is clear that the effect of industrial robots on PM2.5 is still significant and negative, which is consistent with the previous result and the main conclusion here.
Alternative interpretations
This section discusses several latent competing stories that may also create a spurious link between industrial robots and pollution. Possible confounding factors fall into three categories: differentiated environmental regulation (including formal or informal), contemporaneous historical events (e.g., the Air Pollution Prevention and Control Action Plan, carbon emission trading system, low-carbon city pilots), and other emerging technologies (the development of information and communication technology).
Environmental regulations
Increasing environmental awareness and the quest for better living conditions is an inevitable trend that accompanies socio-economic development. To meet the demand for a better environment, the Chinese government has implemented a series of policies to control pollution and improve environmental quality. This process is synchronized with socio-economic development, and may be a latent factor in comprehensively reducing environmental pollution. If the increase in environmental awareness and regulation overlaps with the penetration of industrial robots, the resulting air pollution control effect of robots is likely to be overestimated.
To assess the potential problem, the effect of the level of local environmental regulation (broadly defined) on PM2.5 is examined. Environmental regulation includes not only the mandatory environmental policies set by the government (formal regulation), but also the participation of environmentalists and the general public, who assume environmental rights and responsibilities, and will negotiate and consult with polluters (informal regulation). Theoretically, the level of environmental regulation can exert pressure on the behavior of heavy polluters and residents. The frequency of environmental-related terms, such as “green,” “low-carbon,” “ecology,” “pollution discharge,” “emission reduction,” “environmental protection,”, etc., is collected from the Government Work Reports of each city as a proxy for formal environmental regulation. In addition, following the work of Pargal and Wheeler (1996), indicators such as income level, education level, population density, and age structure are selected to comprehensively measure the intensity of informal regulation in each city. The results of columns (1) and (2) in Table 6 show that the estimated cleaning effect of industrial robots on PM 2.5 remains highly significant, suggesting that it is unlikely that the present results can be explained by the effect of environmental regulations.
Contemporaneous historical events
Some might argue that it is not industrial robots that have improved local air quality, but rather the impact of concurrent events, such as the introduction of more direct air pollution policies during the study period. In China, the Air Pollution Prevention and Control Action Plan (Action Plan) from 2013 to 2017 sets clear and quantifiable targets for the reduction of atmospheric particulate matter, and is considered a milestone for the improvement of China’s ecological environment (Geng et al. 2021), while the introduction of the carbon emission trading scheme (ETS) market is considered an effective way to reduce carbon emissions (Cui et al. 2021). In turn, carbon dioxide has a similar source with PM2.5, and promoting carbon markets may have synergistic effects in reducing PM2.5. Similarly, the two waves of low-carbon city pilot projects launched in 2010 and 2012 are also considered to be the driving force for improving air quality (Yu and Zhang, 2021).
In order to assess the potential influence of the above contemporaneous events, the data in the year after 2013 are excluded in the baseline specification when the Action Plan was implemented. A number of carbon ETS market and low-carbon city pilots are also excluded by assigning a value of 0 to cities with a carbon ETS market or low-carbon cities and a value of 1 to cities without a carbon ETS market or non-low-carbon cities, in order to control for the effect. The results in columns (3), (4), and (5) of Table 6 indicate that the estimated cleaning effect of industrial robots remains significant. Although the magnitudes become somewhat smaller when excluding the carbon ETS market and low-carbon cities, this does not indicate that the impact of industrial robots can be ignored.
Other emerging technologies
A potential concern is that the increase in industrial robots may be accompanied by other emerging technologies that have actually been the main contributors to pollution reduction. For example, the development of information and communication technology (ICT) is considered to be a feasible possibility to reduce PM2.5 concentrations, as it increases production efficiency and technological innovation, and promotes the evolution of the regional industrial structure in a progressive way (Gouvea et al. 2018). Moreover, ICT is almost synchronized with the development of industrial robots. To exclude the potential inference of ICT in the present baseline model, the level of ICT development in cities is calculated by extracting the first principal component of total telecommunication services, the number of local telephone users, and the number of internet users. Cities with an above-average level of digital economy are then assigned a value of 1 and otherwise 0 to eliminate the confounding effect of ICT development. The results in column (6) of Table 7 show that the estimated cleaning effect of industrial robots on PM2.5 remains highly significant, although its magnitudes become smaller. Overall, there is convincing evidence that the main results are unlikely to be overturned by the alternative interpretations mentioned above.
Further discussion on IR-PNT
In order to unravel the more specific characteristics of IR-PNT, this section discusses its spatial and temporal variations, as well as the main driving factors behind, including the changing industrial layout (from a macro perspective) and the relocation of firms (from a micro perspective).
Spatial variation of IR-PNT
Based on the spatial weight matrix of reciprocal geographical distance, we set different thresholds d* to study the pollution nearby transfer effects. Specifically, starting from 25 km, we withhold the spatial weight of neighboring cities with distance dij smaller than the threshold d*, and set the weight of more distant cities to 0. This geographical distance threshold model is expressed as follows:
where \({{PR}}_{{it}}\) denotes the PM2.5 concentrations in logs of each city i in year t, Wij is the spatial weight as defined above, \({{AI}\exp }_{{jt}}\) denotes the industrial robots’s exposure in logs of each city j in year t, \({\boldsymbol{X}}\) consists of a vector of control variables, \({\boldsymbol{\lambda }}\) i ncludes the city and year fixed effects at the prefecture level. Other variables are defined as in Eq. (17). In this part, we focus on the coefficient of \({\beta }_{d}^{\dagger }\) in this specification.
Figure 3 shows the estimated coefficient results of the PNT effect of industrial robots. It can be seen that the effect of IR-PNT shows an inverted U-shaped curve, which first increases and then decreases with the increase of geographical distance, and the peak point is around 90 km. This result confirms the Proposition 3a. The reasons for this curve may be that: (1) due to technology spillovers, firms in local and very nearby areas tend to experience similar impacts of industrial robots, as well as similar environmental regulations, so there is less motivation for polluting enterprises to relocate their business within a certain distance (Porter, 2000); (2) when the distance exceeds 150 km, the IR-PNT effect gradually decreases, probably due to the fact that as the distance increases, the costs of supporting facilities and relocation increase, so heavy polluters are reluctant to relocate. Examples of this can be seen in reality. The IR-PNT effect is more pronounced in neighboring regions, such as Langfang near Beijing and Kaifeng near Zhengzhou, when industrial robots penetrate.
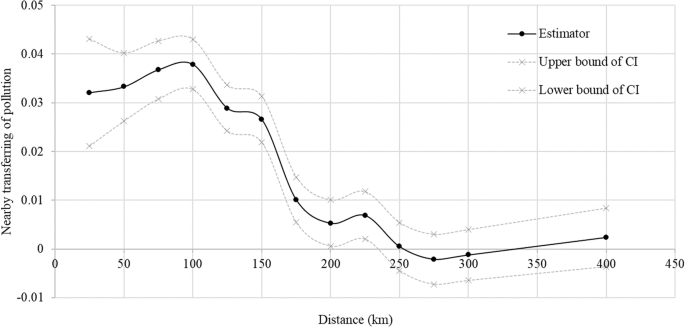
Note: The black solid line is the estimated coefficient of IR-PNT, and the gray dashed lines are the lower and upper bounds of its confidence interval (CI) at the 95% level of statistical significance.
Temporal Variation of IR-PNT
In this part, the cross-terms between the spatial lag terms of industrial robots and the year dummy variables are introduced into the regression to study the temporal variation of the IR-PNT effect. The model is expressed as follows:
where the variables are all defined as in Eq. (17). We focus on the coefficient of βk in this specification.
The results are shown in Fig. 4. According to the estimated results of the full sample, the overall magnitudes of IR-PNT vary in the same pattern, and there is an inverted U-shaped curve of IR-PNT with the increase of the geographical distance as shown in Fig. 3. However, over time, the effect increases after an initial decrease, with the extreme value in 2014. Specifically, the IR-PNT effect is similar to that of the overall estimate, showing a downward trend from 2006 to 2013, which becomes an upward trend from 2014 to 2019. The possible explanations are that the Chinese government started to attach importance to environmental protection and introduced a package of laws and regulations during this period, including the inclusion of air quality in the evaluation of local officials’ promotion, which led to an increase in PNT penalties (Zhang et al. 2013). However, the IR-PNT effect has rebounded since 2015, showing that more attention needs to be paid to these years and justifying the practical significance of the present research.
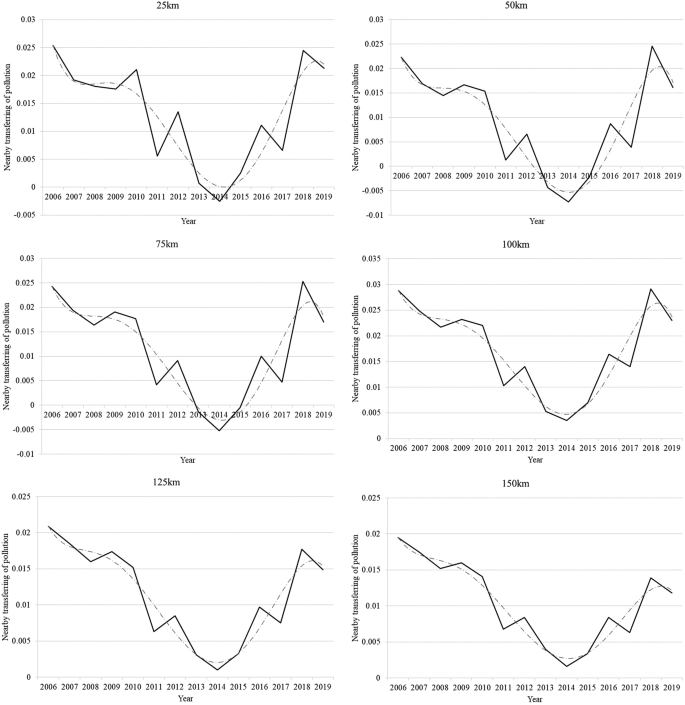
Note: The black solid line is the estimated coefficient of IR-PNT, and the gray dashed line is the fit line smoothed with a sixth-order polynomial function.
Scale-structure trade-offs and mechanism embodied in IR-PNT
The PNT can be attributed to the economic scale and industrial structure change (Antweiler et al. 2001). Therefore, we try to explore the scale-structure trade-offs embodied in the IR-PNT mechanism: As industrial robots become more widespread, does the city, to which companies are relocated, changes in the absolute number of pollution-intensive industries (scale effect) or rather in the relative amount (structural effect)? A priori, if the relative share of pollution-intensive industries in neighboring cities is not significantly affected, but the absolute number is, the scale effect dominates; otherwise, the structural effect dominates.
Therefore, two indicators, i.e., P_ratio and P_scale, are constructed with the proportion and amount of the output value of pollution-intensive industries, respectively. The selection of pollution-intensive industries includes 11 industries from the First National Pollution Source Census released by the China’s State Council in 2006. The data are from China Bureau of Statistics.
Table 8 shows the results of the scale structure trade-offs embodied in the IR-PNT mechanism. Columns (1) and (2) show that in the local area, the installation of industrial robots can promote the transformation of the local industrial structure and make it cleaner, while it can significantly worsen the pollution intensities of the local industrial structure in neighboring regions. There is significant impact of the penetration of industrial robots on the proportion of the output value of polluting industries, but no significant impact on the absolute amount of the output value of polluting industries, suggesting that the effects of IR-PNT are led by the structural effect.
Further examination is conducted over whether the structure and scale of the pollution-intensive industries have a significant impact on the PM2.5 concentrations. As shown in Columns (3) and (5), the increase in the proportion of the output value of pollution-intensive industries will significantly increase the local PM2.5 concentrations at a 1% statistical level, and the rise in the amount of the output value of pollution-intensive industries in adjacent areas can also benefit the local ambient air quality at a 10% statistical level. In any case, considering the changes of the absolute and relative quantity of the output value of pollution-intensive industries, it is found that the increase in the PM2.5 concentration in the adjacent areas is dominated by the fact that the industrial structure changes toward a more pollution-intensive state.
At the firm level, as the penetration of industrial robots increases, the pollution-intensive firms will choose either to innovate locally or to relocate to the neighborhood. There are two factors that can affect their relocation decision, thus forming the mechanism of IR-PNT, namely external and internal costs. For the external cost of relocation, two principal components are used as proxies. The first principal component is extracted from the volume of freight among road, air, water and rail to proxy the degree of transport connectivity. In addition, the second principal component is extracted from the gross telecommunications business, telephone and internet users to proxy the level of information infrastructure. We assume that the more transport links and information infrastructures there are, the lower the barriers to relocation. For the internal costs of relocation, we focus on the inertia of production factor inputs. The share of current assets and employee wages are constructed to measure the internal costs of relocation.
Table 9 shows the results for external costs in the IR-PNT mechanism. According to columns (1) and (3), the estimated coefficients of W_IRexp×W_Trans and W_IRexp×W_ICT are negative, although the coefficients of W_IRexp×W_Trans are not significant, indicating that on average the higher the external costs of relocation, the more reluctant the pollution-intensive firms would be to relocate, thus there will be no strong effect of IN-PNT.
Table 10 shows the results for internal costs in the IR-PNT mechanism. The estimated coefficients of W_IRexp×W_Quick are positive at the 5% statistical level, while those of W_IRexp×W_Wages are negative at the 1% statistical level. The results in columns (1) and (2) indicate that the higher the current asset ratio of pollution-intensive industries, the higher the probability of relocation. However, the conclusion from column (3) that rising wages can prevent the relocation of pollution-intensive industries is relatively unexpected. One explanation is that higher wages imply a higher level of human capital, which makes firms reluctant to relocate to neighboring regions to avoid the sunk costs of employee training (Weiss, 1995; Philippon and Reshef, 2012). Overall, compared to the coefficients of external costs, the internal nature is more dominant in the willingness to relocate. This result confirms the Proposition 3b.
These findings complement the literature on the relationship between firm location behavior and pollution (see, e.g., Dou and Han, 2019). We verify that, in addition to environmental regulations, firms make location decisions that take into account their relative competitiveness in emerging technologies and adapt by relocating their operations or flexing their industrial layout, which affects local and neighboring air quality.
Conclusions and policy implications
Environmental problems are frequently the result of externalities. With the rapid development of industrial robots in China, this emerging technology is anticipated to profoundly transform economic structure and productivity. However, whether it can harmonize the goals of economic growth and environmental improvement remains a question. Grounded in the new economic geography theory, this study focuses on the two-sided environmental externalities caused by industrial robots and investigates how the greater penetration of robots in the economy affects local and neighboring air quality using the spatial econometric model.
Our theoretical model suggests that the level of penetration of industrial robots in different regions will shape the locational choices of diverse firm types by changing their relative competitive advantages. The empirical results proved that the presence of robots significantly mitigates air pollution in the local area, yet paradoxically intensify it in neighboring areas. This phenomenon, termed IR-PNT, underscores the presence of pollution transfer at a regional level. To investigate the cause of the IR-PNT, a mechanism analysis is further conducted. Consistent with our theoretical model, it is found that the structural effect mainly contributes to the increase of PM2.5, which shows that as the penetration of industrial robots increases, pollution-intensive business is more likely than others to relocate to neighboring cities, often replacing cleaning firms in their neighboring cities. It is shown that developed cities with advanced technologies tend to relocate highly polluting business to neighboring cities, imposing an unfair burden on their “neighbors”.
Furthermore, we identified both heterogeneous and rebound effects of robots on air quality. Firstly, an increase in industrial robots in the east and in the metropolis has larger local cleaning and IR-PNT effect. Conversely, cities with initially cleaner air tend to experience a rebound effect post robot integration, linked to their distinct industrial structures and advanced robotic technologies. Notably, operational robots can produce waste, like discarded batteries, and their deployment necessitates considerable material use. If these materials are sourced or processed in a way that harms the environment, it can counteract the initial environmental gains. In China, the penetration rate of robots in cleaner areas is relatively lower and more likely to be in the stage of triggering rebound effects.
Due to limitations in data availability, the analyses in this study do not cover all industries in China, nor do they address the spatial spillovers of robotics across sectors. In addition, although not a central aspect of this study, the identification of causality remains potentially underdeveloped. This study has improved causal validity to some extent through robustness tests and the exclusion of competing hypotheses. Future research should aim to more definitively establish and confirm the relationship between industrial robotics and environmental quality using more robust causal inference methods. In addition, it should be emphasized that our conclusions regarding the local cleaning effect and the IR-PNT effect are derived from a specific Chinese sample. In order to formulate more generalizable findings, further verification through cross-national studies is essential.
In general, considering the IR-PNT effect, policy makers may need to consider how to minimize, reduce and offset the externalities caused by the unequal distribution of industrial robots. First, researchers are expected to assess the pollution nearby transfer effect of emerging technologies in different policy scenarios (Moni et al. 2020). For example, the tradable permit policy, such as cap-and-trade, can improve the optimal allocation of resources in technological change through the improvement of pollutant property rights, making it easier to achieve the balanced goals of pollution control and economic development (Liu et al. 2020; Wu and Wang, 2022).
Second, we find that the IR-PNT effect is mainly caused by the relocation of polluting firms from clean areas to neighboring regions. This suggests that regional cooperation in pollution reduction is crucial. Particular attention must be paid to the air quality around the clean area., to avoid cleaning at the expense of polluting someone else’s backyard. To achieve this, a synergistic approach is essential, integrating technological, financial and administrative strategies in regional cooperation.
Lastly, the study shows that IR-PNT effects are lower in metropolitan areas and urban agglomerations, and there is even a cleaning effect. In this case, the expansion of urban agglomerations tends to reduce the environmental inequality caused by technological progress. On the one hand, the externalities of pollution are resolved by internalizing them in larger urban clusters; on the other hand, the expanded urban agglomerations increase the area of cities and the distance and costs of relocating polluting firms (Tabuchi, 1998), thus reducing pollution transfer and reducing environmental inequality.
Data availability
The datasets generated during and/or analyzed during the current study are available in the Harvard Dataverse repository, https://doi.org/10.7910/DVN/9BYJYD.
References
Acemoglu D, Restrepo P (2017) Secular stagnation? The effect of aging on economic growth in the age of automation. Am Econ Rev 107:174–179. https://doi.org/10.1257/aer.p20171101
Acemoglu D, Restrepo P (2019) Automation and new tasks: how technology displaces and reinstates labor. J Econ Perspect 33:3–30. https://doi.org/10.1257/jep.33.2.3
Acemoglu D, Restrepo P (2020) Robots and jobs: evidence from US labor markets. J Polit Econ 128:2188–2244. https://doi.org/10.1086/705716
Aduba JJ, Asgari B (2020) Productivity and technological progress of the Japanese manufacturing industries, 2000–2014: estimation with data envelopment analysis and log-linear learning model. Asia-Pacific. J Reg Sci 4(2):343–387
Aghion P, Jones BF, Jones CI (2017) Artificial Intelligence and Economic Growth. Working Paper Series. https://doi.org/10.3386/w23928
Aghion P, Antonin C, Bunel S (2019) Artificial intelligence, growth and employment: the role of policy. Econ Stat 510(1):149–164
Anderson D (2001) Technical progress and pollution abatement: an economic view of selected technologies and practices. Environ Dev Econ 6:283–311. https://doi.org/10.1017/S1355770X01000171
Anelli M, Colantone I, Stanig P (2019) We were the robots: automation and voting behavior in western europe. BAFFI CAREFIN Centre Research Paper, (2019-115)
Anselin L (1995) Local indicators of spatial association—LISA. Geogr Anal 27(2):93–115
Anselin L (2003) Spatial externalities, spatial multipliers, and spatial econometrics. Int Reg Sci Rev 26(2):153–166
Antweiler W, Copeland BR, Taylor MS (2001) Is free trade good for the environment? Am Econ Rev 91:877–908. https://doi.org/10.1257/aer.91.4.877
Arbia, G, Espa, G, Giuliani, D (2021) Spatial microeconometrics. Routledge
Atanu S, Love HA, Schwart R (1994) Adoption of emerging technologies under output uncertainty. Am J Agric Econ 76(4):836–846
Audirac I (2005) Information technology and urban form: challenges to smart growth. Int Reg Sci Rev 28(2):119–145
Autant-Bernard C, LeSage JP (2011) Quantifying knowledge spillovers using spatial econometric models. J Reg Sci 51(3):471–496
Autor, D, Chin, C, Salomons, AM, Seegmiller, B, 2022. New Frontiers: The Origins and Content of New Work, 1940–2018. Working Paper Series. https://doi.org/10.3386/w30389
Bartelsman EJ, Doms M (2000) Understanding productivity: lessons from longitudinal microdata. J Econ Lit 38(3):569–594
Bell ML, Ebisu K (2012) Environmental inequality in exposures to airborne particulate matter components in the United States. Environ Health Perspect 120(12):1699–1704
Benhabib J, Perla J, Tonetti C (2021) Reconciling models of diffusion and innovation: a theory of the productivity distribution and technology frontier. Econometrica 89(5):2261–2301
Ben Kheder S, Zugravu N (2012) Environmental regulation and French firms location abroad: an economic geography model in an international comparative study. Ecol Econ 77:48–61. https://doi.org/10.1016/j.ecolecon.2011.10.005
Bommer R (1999) Environmental policy and industrial competitiveness: the pollution‐haven hypothesis reconsidered. Rev Int Econ 7(2):342–355
Bocca, R, Ashraf, M, Jamison, S (2021) Fostering Effective Energy Transition 2021 Edition. In World Economic Forum
Buera, FJ, Fattal Jaef, RN (2018) The dynamics of development: innovation and reallocation. World Bank Policy Research Working Paper (8505)
Burnett RT, Smith-doiron M, Stieb D, Cakmak S, Brook JR (1999) Effects of particulate and gaseous air pollution on cardiorespiratory hospitalizations. Arch Environ Health 54:130–139. https://doi.org/10.1080/00039899909602248
Chen SM, He LY (2014) Welfare loss of China’s air pollution: How to make personal vehicle transportation policy. China Econ Rev 31:106–118
Chen X, Shao S, Tian Z, Xie Z, Yin P (2017) Impacts of air pollution and its spatial spillover effect on public health based on China’s big data sample. J Clean Prod 142:915–925. https://doi.org/10.1016/j.jclepro.2016.02.119. Special Volume on Improving natural resource management and human health to ensure sustainable societal development based upon insights gained from working within ‘Big Data Environments’
Chen Y, Shao S, Fan M, Tian Z, Yang L (2022) One man’s loss is another’s gain: does clean energy development reduce CO2 emissions in China? Evidence based on the spatial Durbin model. Energy Econ 107:105852
Cheng H, Jia R, Li D, Li H (2019) The rise of robots in China. J Econ Perspect 33(2):71–88
Chiu S-H, Lin T-Y, Wang W-C (2024) Investigating the spatial effect of operational performance in China’s regional tourism system. Human Soc Sci Commun 11(1):14. https://doi.org/10.1057/s41599-024-02741-y
Chun H, Kim JW, Lee J (2015) How does information technology improve aggregate productivity? A new channel of productivity dispersion and reallocation. Res Policy 44(5):999–1016
Cui J, Wang C, Zhang J, Zheng Y (2021) The effectiveness of China’s regional carbon market pilots in reducing firm emissions. Proc Natl Acad Sci USA 118(52):e2109912118
Dauth W, Findeisen S, Suedekum J, Woessner N (2021) The adjustment of labor markets to robots. J Eur Econ Assoc 19:3104–3153. https://doi.org/10.1093/jeea/jvab012
Dusík, J, Fischer, T, Sadler, B, Therivel, R, Saric, I, (2018) Strategic Environmental and Social Assessment of Automation: Scoping Working Paper
Ding T, Li J, Shi X, Li X, Chen Y (2023) Is artificial intelligence associated with carbon emissions reduction? Case of China. Resour Policy 85:103892. https://doi.org/10.1016/j.resourpol.2023.103892
Dou J, Han X (2019) How does the industry mobility affect pollution industry transfer in China: empirical test on Pollution Haven Hypothesis and Porter Hypothesis. J Clean Prod 217:105–115. https://doi.org/10.1016/j.jclepro.2019.01.147
Elhorst JP (2014) Spatial Econometrics: From Cross-Sectional Data to Spatial Panels. Springer, Berlin, Heidelberg, 10.1007/978-3-642-40340-8
Ehrlich PR, Holdren JP (1971) Impact of population growth. Science 171:1212–1217. cq9zm8
Feng Y, Cheng J, Shen J, Sun H (2019) Spatial effects of air pollution on public health in China. Environ Resour Econ 73:229–250. https://doi.org/10.1007/s10640-018-0258-4
Florida R, Mellander C, Stolarick K (2008) Inside the black box of regional development—human capital, the creative class and tolerance. J Econ Geogr 8(5):615–649
Fujita M, Krugman P (2004) The new economic geography: past, present and the future. In Fifty years of regional science (pp. 139-164). Springer, Berlin, Heidelberg
Gao K, Yuan Y (2021) The effect of innovation-driven development on pollution reduction: empirical evidence from a quasi-natural experiment in China. Technol Forecast Soc Change 172:121047
Geng G, Zheng Y, Zhang Q, Xue T, Zhao H, Tong D, Davis SJ (2021) Drivers of PM2. 5 air pollution deaths in China 2002–2017. Nat Geosci 14(9):645–650
Gihleb R, Giuntella O, Stella L, Wang T (2022) Industrial robots, Workers’ safety, and health. Labour Econ 78:102205. https://doi.org/10.1016/j.labeco.2022.102205
Giuntella O, Wang T (2019) Is an Army of Robots Marching on Chinese Jobs? https://doi.org/10.2139/ssrn.3390271
Gouvea R, Kapelianis D, Kassicieh S (2018) Assessing the nexus of sustainability and information & communications technology. Technol Forecast Soc Change 130:39–44
Graetz G, Michaels G (2018) Robots at work. Rev Econ Stat 100:753–768. https://doi.org/10.1162/rest_a_00754
Grossman GM, Krueger AB (1991) Environmental Impacts of a North American Free Trade Agreement. Working Paper Series. https://doi.org/10.3386/w3914
Hägele M, Nilsson K, Pires JN, Bischoff R (2016) Industrial robotics. In Springer handbook of robotics (pp. 1385-1422). Springer, Cham
IFR (2020) World Robotics 2020. International Federation of Robotics and the United Nations
Jiang L, Yang Y, Wu Q, Yang L, Yang Z (2024) Hotter days, dirtier air: the impact of extreme heat on energy and pollution intensity in China. Energy Econ 130:107291
Juhász R, Squicciarini MP, Voigtländer N (2020) Technology adoption and productivity growth: Evidence from industrialization in France (No. w27503). National Bureau of Economic Research
Jung JH, Lim DG (2020) Industrial robots, employment growth, and labor cost: a simultaneous equation analysis. Technol Forecast Soc Change 159:120202
Kozul-Wright R (2016, October). Robots and industrialization in developing countries. In United Nations Conference on Trade and Development (No. 60)
Kromann L, Malchow-Møller N, Skaksen JR, Sørensen A (2020) Automation and productivity—a cross-country, cross-industry comparison. Ind Corp Change 29:265–287. https://doi.org/10.1093/icc/dtz039
LeSage J, Pace RK (2009) Introduction to Spatial Econometrics. Chapman and Hall/CRC, New York, p 340. 10.1201/9781420064254
LeSage J (2015) Spatial econometrics. In Handbook of research methods and applications in economic geography (pp. 23-40). Edward Elgar Publishing
Levinson A, Taylor MS (2008) Unmasking the pollution haven effect. Int Econ Rev 49(1):223–254
Li J, Ma S, Qu Y, Wang J (2023) The impact of artificial intelligence on firms’ energy and resource efficiency: empirical evidence from China. Resour Policy 82:103507. https://doi.org/10.1016/j.resourpol.2023.103507
Li Y, Zhang Y, Pan A, Han M, Veglianti E (2022) Carbon emission reduction effects of industrial robot applications: Heterogeneity characteristics and influencing mechanisms. Technol Soc 70:102034
Lin F (2017) Trade openness and air pollution: city-level empirical evidence from China. China Econ Rev 45:78–88
Liu H, Owens KA, Yang K, Zhang C (2020) Pollution abatement costs and technical changes under different environmental regulations. China Econ Rev 62:101497
Liu J, Yu Q, Chen Y, Liu J (2022) The impact of digital technology development on carbon emissions: a spatial effect analysis for China. Resour Conserv Recycl 185:106445. https://doi.org/10.1016/j.resconrec.2022.106445
Liu J, Liu L, Qian Y, Song S (2022) The effect of artificial intelligence on carbon intensity: evidence from China’s industrial sector. Socioecon Plann Sci 83:101002. https://doi.org/10.1016/j.seps.2020.101002
Liu Y, Ren T, Liu L, Ni J, Yin Y (2022) Heterogeneous industrial agglomeration, technological innovation and haze pollution. China Econ Rev https://doi.org/10.1016/j.chieco.2022.101880
Luan F, Yang X, Chen Y, Regis PJ (2022) Industrial robots and air environment: a moderated mediation model of population density and energy consumption. Sustain Prod Consum. 30:870–888
Luo Z, Wan G, Wang C, Zhang X (2018) Urban pollution and road infrastructure: a case study of China. China Econ Rev 49:171–183
Milani S (2017) The impact of environmental policy stringency on industrial R&D conditional on pollution intensity and relocation costs. Environ Resour Econ 68:595–620
Moni SM, Mahmud R, High K, Carbajales‐Dale M (2020) Life cycle assessment of emerging technologies: a review. J Ind Ecol 24(1):52–63
Nguyen TT, Pham TAT, Tram HTX (2020) Role of information and communication technologies and innovation in driving carbon emissions and economic growth in selected G-20 countries. J Environ Manag 261:110162. https://doi.org/10.1016/j.jenvman.2020.110162
Pargal S, Wheeler D (1996) Informal regulation of industrial pollution in developing countries: evidence from Indonesia. J Polit Econ 104:1314–1327. https://doi.org/10.1086/262061
Pellenbarg PH, Van Wissen LJ, Van Dijk J (2002) Firm Relocation: State of the Art and Research Prospects. University of Groningen, Groningen, p 1–42
Pennings E, Sleuwaegen L (2000) International relocation: firm and industry determinants. Economics Letters 67(2):179–186
Philippon T, Reshef A (2012) Wages and human capital in the US finance industry: 1909–2006. Q J Econ 127(4):1551–1609
Pires JN (2007) Introduction to the Industrial Robotics World. https://doi.org/10.1007/978-0-387-23326-0_1
Pope III CA, Renlund DG, Kfoury AG, May HT, Horne BD (2008) Relation of heart failure hospitalization to exposure to fine particulate air pollution. Am J Cardiol 102(9):1230–1234
Porter ME (2000) Locations, clusters, and company strategy. The Oxford Handbook of Economic Geography 253:274
Shen K, Gang J, Xian F, University N, University F (2017) Does environmental regulation cause pollution to transfer nearby? Econ Res J 52:44–59
Sheng D, Bu W (2022) The usage of robots and enterprieses’ pollution emissions in China. J Quant Technol Econ 2022(9):157–176
Shi B, Feng C, Qiu M, Ekeland A (2018) Innovation suppression and migration effect: The unintentional consequences of environmental regulation. China Econ Rev 49:1–23
Soergel A (2015) Robots could cut labor costs 16 percent by 2025 - US News & World Report. Retrieved August 7, 2022, from https://www.usnews.com/news/articles/2015/02/10/robots-could-cut-international-labor-costs-16-percent-by-2025-consulting-group-says
Tabuchi T (1998) Urban agglomeration and dispersion: a synthesis of Alonso and Krugman. J Urb Econ 44(3):333–351
Uhlmann E, Reinkober S, Hollerbach T (2016) Energy efficient usage of industrial robots for machining processes. Proc CIRP 48:206–211. https://doi.org/10.1016/j.procir.2016.03.241
Van Donkelaar A, Hammer MS, Bindle L, Brauer M, Brook JR, Garay MJ, Martin RV (2021) Monthly global estimates of fine particulate matter and their uncertainty. Environ Sci Technol 55(22):15287–15300
Wang E-Z, Lee C-C, Li Y (2022) Assessing the impact of industrial robots on manufacturing energy intensity in 38 countries. Energy Econ 105:105748. https://doi.org/10.1016/j.eneco.2021.105748
Wang Y, Feng J (2022) The Adoption Of Industrial Robots And Pollution Abatement In China
Weiss, Andrew (1995) Human Capital vs. Signalling Explanations of Wages. Journal of Economic Perspectives 9(4):133–154
Wilts H, Garcia BR, Garlito RG, Gómez LS, Prieto EG (2021) Artificial intelligence in the sorting of municipal waste as an enabler of the circular economy. Resources 10:28. https://doi.org/10.3390/resources10040028
World Health Organization. (2021) New WHO Global Air Quality Guidelines aim to save millions of lives from air pollution. Air Pollution is One of the Biggest Environmental Threats to Human Health, Alongside Climate Change
Wu Q, Wang Y (2022) How does carbon emission price stimulate enterprises’ total factor productivity? Insights from China’s emission trading scheme pilots. Energy Econ 109:105990. https://doi.org/10.1016/j.eneco.2022.105990
Wu Q (2023) Sustainable growth through industrial robot diffusion: quasi-experimental evidence from a Bartik shift-share design. Econ Transit Inst Change 31:1107–1133. https://doi.org/10.1111/ecot.12367
Wu Q, Sun Z, Jiang L, Jiang L (2023) “Bottom-up” abatement on climate from the “top-down” design: lessons learned from China’s low-carbon city pilot policy. Empir Econ 66:1223–1257
Wu Y, Al-Duais ZAM, Peng B (2023) Towards a low-carbon society: spatial distribution, characteristics and implications of digital economy and carbon emissions decoupling. Human Soc Sci Commun 10:1–13. https://doi.org/10.1057/s41599-023-02233-5
Yu Y, Zhang N (2021) Low-carbon city pilot and carbon emission efficiency: quasi-experimental evidence from China. Energy Econ 96:105125
Zhang X, Wu L, Zhang R, Deng S, Zhang Y, Wu J, Li Y, Lin L, Li L, Wang Y, Wang L (2013) Evaluating the relationships among economic growth, energy consumption, air emissions and air environmental protection investment in China. Renew Sustain Energy Rev 18:259–270. https://doi.org/10.1016/j.rser.2012.10.029
Zhang Z, Zhang W, Wu Q, Liu J, Jiang L (2024) Climate adaptation through trade: evidence and mechanism from heatwaves on firms’ imports. China Econ Rev 84:102–133
Zheng W, Chen P (2020) The political economy of air pollution: Local development, sustainability, and political incentives in China. Energy Res Soc Sci 69:101707
Zheng S, Yao R, Zou K (2022) Provincial environmental inequality in China: measurement, influence, and policy instrument choice. Ecol Econ 200:107537. https://doi.org/10.1016/j.ecolecon.2022.107537
Zhu H, Sang B, Zhang C, Guo L (2023) Have industrial robots improved pollution reduction? A theoretical approach and empirical analysis. China World Econ 31(4):153–172
Author information
Authors and Affiliations
Contributions
The authors confirm their contribution to the paper as follows: study conception and design: Q Wu; data collection: Y Wang and Q Wu; analysis and interpretation of the results: Y Wang and Q Wu; draft the paper preparation and revision: Y Wang and Q Wu. All authors reviewed the results and approved the final version of the paper.
Corresponding author
Ethics declarations
Competing interests
The authors declare no competing interests.
Ethical approval
This article does not contain any studies with human participants performed by any of the authors.
Informed consent
This article does not contain any studies with human participants performed by any of the authors.
Additional information
Publisher’s note Springer Nature remains neutral with regard to jurisdictional claims in published maps and institutional affiliations.
Rights and permissions
Open Access This article is licensed under a Creative Commons Attribution 4.0 International License, which permits use, sharing, adaptation, distribution and reproduction in any medium or format, as long as you give appropriate credit to the original author(s) and the source, provide a link to the Creative Commons licence, and indicate if changes were made. The images or other third party material in this article are included in the article’s Creative Commons licence, unless indicated otherwise in a credit line to the material. If material is not included in the article’s Creative Commons licence and your intended use is not permitted by statutory regulation or exceeds the permitted use, you will need to obtain permission directly from the copyright holder. To view a copy of this licence, visit http://creativecommons.org/licenses/by/4.0/.
About this article

Cite this article
Wang, Y., Wu, Q. Robots, firm relocation, and air pollution: unveiling the unintended spatial spillover effects of emerging technology. Humanit Soc Sci Commun 11, 577 (2024). https://doi.org/10.1057/s41599-024-03100-7
Received:
Accepted:
Published:
DOI: https://doi.org/10.1057/s41599-024-03100-7
