Figure 1: Principles of fluorescence in situ hybridization (FISH).


« Prev Next »
Cytogenetics entered the molecular era with the introduction of in situ hybridization, a procedure that allows researchers to locate the positions of specific DNA sequences on chromosomes. Since the first in situ hybridization experiments in 1969 (Gall & Pardue, 1969), many variations of the procedure have been developed, and its sensitivity has increased enormously. Today, most in situ hybridization procedures use fluorescent probes to detect DNA sequences, and the process is commonly referred to as FISH (fluorescence in situ hybridization). A variety of FISH procedures are available to cytogeneticists, who use them to diagnose many types of chromosomal abnormalities in patients. The success of FISH, and all other methods of in situ hybridization, depends on the remarkable stability of the DNA double helix.
In Situ Hybridization Is Used to Localize DNA Sequences on Chromosomes
In 1953, James Watson and Francis Crick described the extensive network of hydrogen bonds that hold together the two antiparallel strands in the DNA double helix (Watson & Crick, 1953). Today, even schoolchildren know that adenine on one DNA strand binds to thymine on the complementary DNA strand, and that cytosine likewise binds to guanine. Because of the many hydrogen bonds formed between these bases, the double helix is a remarkably stable structure. Moreover, if the hydrogen bonds that hold the helix together are broken with heat or chemicals, the helix is able to re-form when conditions become more favorable. This ability of the DNA helix to re-form, or renature, provides the basis for molecular hybridization.
In molecular hybridization, a labeled DNA or RNA sequence is used as a probe to identify or quantify the naturally occurring counterpart of the sequence in a biological sample. In the 1960s, researchers Joseph Gall and Mary Lou Pardue realized that molecular hybridization could be used to identify the position of DNA sequences in situ (i.e., in their natural positions within a chromosome). In fact, in 1969, the two scientists published a landmark paper demonstrating that radioactive copies of a ribosomal DNA sequence could be used to detect complementary DNA sequences in the nucleus of a frog egg. Since those original observations, many refinements have increased the versatility and sensitivity of the procedure to the extent that in situ hybridization is now considered an essential tool in cytogenetics.
Fluorescent Probes Are Introduced
© 2005 Nature Publishing Group Speicher, M. R. et al. The new cytogenetics: blurring the boundaries with molecular biology. Nature Reviews Genetics 6, 784 (2005). All rights reserved. 
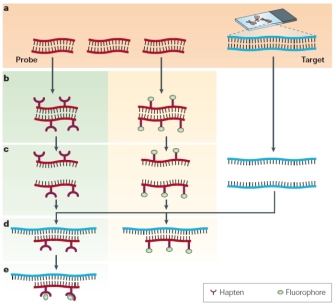
Soon after Gall and Pardue's work, fluorescent labels quickly replaced radioactive labels in hybridization probes because of their greater safety, stability, and ease of detection (Rudkin & Stollar, 1977). In fact, most current in situ hybridization is done using FISH procedures (Trask, 2002; Speicher & Carter, 2005). Detecting a DNA sequence can be compared to looking for a needle in a haystack, with the needle being the DNA sequence of interest and the haystack being a set of chromosomes. This search is made much easier if the investigator has a powerful "magnet"—in this case, a fluorescent copy of the DNA sequence of interest. Hybridization occurs when the "magnet" meets the "needle"; this requires both a probe and a target, as shown in Figure 1. In the figure, the probe sequence, often a piece of cloned DNA, is shown in red. The target DNA—chromosomes on a glass slide—is shown in blue (in the right column). Hydrogen bonds that join the two strands of the DNA helix are represented by black lines.
The first step in the process is to make either a fluorescent copy of the probe sequence (Figure 1b, middle column) or a modified copy of the probe sequence that can be rendered fluorescent later in the procedure (Figure 1b, left column). Next, before any hybridization can occur, both the target and the probe sequences must be denatured with heat or chemicals (Figure 1c). This denaturation step is necessary in order for new hydrogen bonds to form between the target and the probe during the subsequent hybridization step. The probe and target sequences are then mixed together (Figure 1d), and the probe specifically hybridizes to its complementary sequence on the chromosome. If the probe is already fluorescent (middle column), it will be possible to detect the site of hybridization directly. In other cases (left column), an additional step may be needed to visualize the hybridized probe. Hybrids formed between the probes and their chromosomal targets can be detected using a fluorescent microscope.
When investigators design a FISH experiment, they need to consider whether the sensitivity and resolution needed for the experiment lie within the technical limits of fluorescence microscopy. Sensitivity depends on the light-gathering ability of the particular microscope, which determines whether small target sequences, which are more difficult to see than large target sequences, can be detected. Resolution refers to the ability to distinguish between two points along the length of a chromosome. Ultimately, light microscopy cannot resolve objects that are separated by less than 200–250 nm, the lower limit of the visible light spectrum. With these technical limits in mind, investigators also need to consider the conformation of DNA within the chromosome. Metaphase chromosomes are thousands of times more compacted than interphase chromosomes, which in turn are at least ten times more compacted than naked DNA. (Remember that one 3.4 nm turn of the DNA helix corresponds to 10 base pairs of DNA.) When all these factors are considered together, investigators typically expect to obtain resolution in the range of megabases for positions on metaphase chromosomes and resolution in the range of tens of thousands of kilobases for interphase chromosomes.
Using FISH to Identify the Positions of Genes
© 2001 Nature Publishing Group Cheung, V. G. et al. Integration of cytogenetic landmarks into the draft sequence of the human genome. Nature 409, 954 (2001). All rights reserved.
FISH provides a powerful tool for identifying the location of a cloned DNA sequence on metaphase chromosomes. Figure 2a shows the results of a typical FISH experiment, in which a cloned DNA sequence was hybridized to normal metaphase chromosomes. Red bands are detected at hybridization sites on two homologous chromosomes, which can be identified by their characteristic banding patterns. Closer examination shows that each red band actually consists of two spots, corresponding to the two sister chromatids in a mitotic chromosome. A skilled cytogeneticist would be able to use these hybridization data together with the banding pattern to place the probe sequence within a few megabases of other known genes on the chromosome.
Historically, FISH and other in situ hybridization results played a primary role in mapping genes on human chromosomes. Results from these experiments were collected and compiled in databases, and this information proved useful during the annotation phase of the Human Genome Project (HGP). Now that the HGP is complete, investigators rarely use in situ hybridization simply to identify the chromosomal location of a human gene. (In species for which the genome has not been sequenced, however, FISH and related in situ hybridization methods continue to provide important data for mapping the positions of genes on chromosomes.) Currently, human FISH applications are principally directed toward clinical diagnoses.
Diagnosing Chromosomal Abnormalities Using Karyotypes and FISH
FISH and other in situ hybridization procedures are important in the clinical diagnosis of various chromosomal abnormalities, including deletions, duplications, and translocations. Figure 2b shows one example in which investigators used FISH together with standard karyotyping to analyze a patient translocation. The hybridization probe corresponded to a segment of chromosome 19 that was suspected to include the translocation breakpoint. Three areas of hybridization are apparent in the fluorescent image. One spot corresponds to the patient's normal copy of chromosome 19 (nl19), and the other two spots correspond to the altered, or derived (der), versions of chromosomes 11 and 19 that were produced during the translocation. Thus, investigators were able to use the data both to narrow down the breakpoint region on chromosome 19 and to identify the second chromosome involved in the translocation.
The hybridization probe used in Figure 2b was one of thousands of bacterial artificial chromosome (BAC) clones from the HGP that have been made available to the scientific community. Today, cytogeneticists are able to use extensive HGP clone resources to precisely identify the sites of chromosomal rearrangements that appear in karyotypes. In fact, a consortium of scientists has mapped over 7,000 DNA clones from the HGP to specific bands on human chromosomes (BAC Research Consortium, 2001). At least one clone is available for every megabase segment of chromosomal DNA. (The only exception is the Y chromosome, because it is relatively gene-poor.)
Using Collections of FISH Probes to “Paint” Entire Chromosomes
© 2014 Panels a) and b) modified from © 2000 Cambridge University Press. McNeil, N. & Ried, T. Novel molecular cytogenetic techniques for identifying complex chromosomal rearrangements: technology and applications in molecular medicine. Expert Reviews in Molecular Medicine (online: September 2000). All rights reserved.
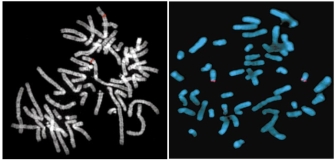
With multifluor FISH, investigators first prepare a collection of DNA sequences to be used as probes for each chromosome. In Figure 3a, the probe chromosomes have been physically separated from one another by flow cytometry. (Today, investigators would probably use commercially available DNA collections for each chromosome.) In the next step, the DNA samples are labeled with combinations of fluorochromes that produce a unique color for each chromosome. (The Cot-1 DNA step in the figure removes repetitive DNA sequences [e.g., centromeric DNA] that would bind to all chromosomes.) The fluorescent hybridization probes are then combined with and hybridized to metaphase chromosomes. Figure 3b shows images of interphase and metaphase chromosomes as they would appear through a microscope after hybridization. To human eyes, several of the metaphase chromosomes appear to have the same color, but digital processing of the image would distinguish spectral differences between the chromosomes. A normal human chromosome (Figure 3b) will have a uniform color along its length, but a rearranged chromosome will have a striped appearance.
Although chromosome paints allow rapid assessment of large chromosomal changes in metaphase spreads, the resolution of the method is limited. Thus, while chromosome painting allows investigators to quickly identify chromosomes involved in translocations and to identify large deletions and/or duplications, small deletions and duplications will not be detectable. If investigators need more detailed information about the actual sequences involved in chromosomal rearrangements, they need to follow up with site-specific probes, as previously described (Figure 2).
Using FISH to Analyze Interphase Chromosomes
© 1986 Cold Spring Harbor Laboratory Press Modified with permission from Gray, J. W., et al. Flow karyotyping and sorting of human chromosomes. Cold Spring Harbor Symposia on Quantitative Biology 51, 141–149 (1986). All rights reserved. Plot courtesy of Ger van den Engh, Institute of Systems Biology. All rights reserved.
Since the introduction of FISH, cytogeneticists have been able to analyze interphase chromosomes as well as the metaphase chromosomes used in karyotypes (Trask, 2002). This offers a real practical advantage, in that cells do not need to be cultured for several days or weeks before chromosomes can be prepared for analysis. In addition, FISH can be used to analyze chromosomes from specimens such as solid tumors, which are of great clinical interest but do not divide frequently. Another useful feature of FISH is that researchers are able to simultaneously monitor multiple sites if the hybridization probes have been labeled with different fluorophores.
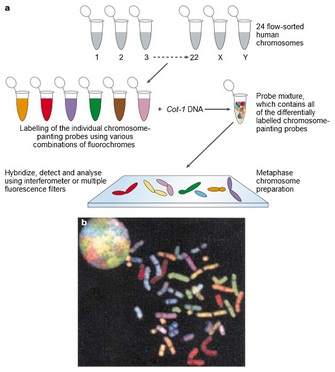
Figure 4 shows two examples of how interphase FISH can be used to diagnose chromosome abnormalities. Figure 4a shows an interphase nucleus from a patient with Charcot-Marie-Tooth disease (CMT) type 1A (Lupski et al., 1991). CMT type 1A is a relatively common neurological condition caused by a duplication in a gene on chromosome 17 that encodes one of the proteins in the myelin sheath that surrounds nerve axons. In Figure 4a, the patient's cell has been hybridized with a red-labeled probe corresponding to a sequence within the duplicated region, along with a green probe corresponding to a sequence on chromosome 17 that lies outside of the duplicated region. From the two green signals, it is possible to locate two copies of chromosome 17 within the nucleus. One chromosome has the normal configuration, while the second, der(17), contains the duplicated region, which is evident from two nearby red signals. The figure also serves to illustrate another important feature of interphase FISH. Because interphase chromatin is about 10,000 times less compacted than mitotic chromatin, it is possible to resolve the duplicated regions on der(17) as discrete points. This small duplication would have been difficult to resolve in mitotic chromosomes.
Figure 4b shows a FISH analysis that was used to detect the presence of a chromosomal translocation in a patient suffering from chronic myelogenous leukemia (Tkachuk et al., 1990). In most cases of this disease, a segment of chromosome 9 that contains the ABL proto-oncogene fuses with the breakpoint cluster region (BCR) on chromosome 22 during a reciprocal translocation. The derived chromosome 22, or der(22), also known as the Philadelphia chromosome, contains a BCR-ABL fusion gene in which the powerful BCR promoter drives synthesis of the ABL oncogene transcript, leading to cancer. Figure 4b demonstrates that BCR-ABL fusions can be readily identified by FISH when a green-labeled hybridization probe flanking BCR is applied together with a red-labeled probe flanking ABL. In this image, the normal copies of chromosomes 9 and 22 are detected as red and green spots, respectively. On the other hand, the Philadelphia chromosome is visible as a complex fused spot, which appears to have a central yellow region with red and green subregions on either side. (In fluorescence microscopy, yellow is indicative of very close proximity of red and green probes, such that they appear to overlap.) The intricate substructure of the fused spot is detectable in interphase chromosomes, but it would not be resolved in a similar FISH analysis of metaphase chromosomes. Thus, two-color interphase FISH provides a sensitive method for analyzing chromosome fusion events without the need for a prior cell culture.
Another research application of interphase FISH makes use of chromosome-specific paints to obtain information about the organization of chromosomes within the nucleus. Figure 2a (upper left) shows an interphase nucleus that has been stained with chromosome-specific paints. One can see from the figure that the chromosomes occupy distinct territories within the nucleus. By creatively combining chromosome-specific probes with gene-specific probes and antibodies, investigators can use FISH to provide exciting new insights about nuclear architecture.
Additional Applications of FISH in the Clinic and Research Laboratory
Exciting new applications of FISH that extend its range continue to be developed. For example, cytogeneticists now use comparative genomic hybridization to detect quantitative differences, like copy number variations, in the chromosomes of their patients. Recently, investigators have also been able to increase the resolution of FISH by using stretched chromatin fibers (Parra & Windle, 1993) or microarrays as the target. With tools such as these, cytogenetics has been able to move from studying whole chromosomes on the macroscopic scale, to studying the DNA of which these chromosomes consist.
References and Recommended Reading
BAC Resource Consortium. Integration of cytogenetic landmarks into the draft sequence of the human genome. Nature 409, 953–958 (2001) (link to article)
Gall, J. G., & Pardue, M. L. Formation and detection of RNA-DNA hybrid molecules in cytological preparations. Proceedings of the National Academy of Sciences 63, 378–383 (1969)
Lupski, J. R., et al. DNA duplication associated with Charcot-Marie-Tooth disease type 1A. Cell 66, 219–232 (1991) doi:10.1016/0092-8674(91)90613-4
Parra, I., & Windle, B. High resolution visual mapping of stretched DNA by fluorescent hybridization. Nature Genetics 5, 17–21 (1993) doi:10.1038/ng0993-17 (link to article)
Rudkin, G. T., & Stollar, B. D. High resolution of DNA-RNA hybrids in situ by indirect immunofluorescence. Nature 265, 472–474 (1977) doi:10.1038/265472a0 (link to article)
Schrock, E., et al. Multicolor spectral karyotyping of human chromosomes. Science 273, 494–497 (1996) doi:10.1126/science.273.5274.494
Speicher, M. R., Ballard, S. G., & Ward, D. C. Karyotyping human chromosomes by combinatorial multi-fluor FISH. Nature Genetics 12, 368–375 (1996) doi:10.1038/ng0496-368 (link to article)
Speicher, M. R., & Carter, N. P. The new cytogenetics: Blurring the boundaries with molecular biology. Nature Reviews Genetics 6, 782–792 (2005) doi:10.1038/nrg1692 (link to article)
Tkachuk, D. C., et al. Detection of BCR-ABL fusion in chronic myelogenous leukemia by in situ hybridization. Science 250, 559–562 (1990) doi:10.1126/science.2237408
Trask, B. J. Human cytogenetics: 46 chromosomes, 46 years and counting. Nature Reviews Genetics 3, 769–778 (2002) doi:10.1038/nrg905 (link to article)
Watson, J. D., & Crick, F. H. C. Molecular structure of nucleic acids: A structure for deoxyribose nucleic acid. Nature 171, 737–738 (1953) doi:10.1038/171737a0 (link to article)