
Abstract
Understanding direct deforestation drivers at a fine spatial and temporal scale is needed to design appropriate measures for forest management and monitoring. To achieve this, reference datasets with which to design Artificial Intelligence (AI) approaches to classify direct deforestation drivers within areas experiencing forest loss in a detailed, comprehensive and locally-adapted way are needed. This is the case for Cameroon, in the Congo Basin, which has known increasing deforestation rates in recent years. Here, we created an Earth Observation dataset with associated labels to classify detailed direct deforestation drivers in Cameroon, which includes satellite imagery (Landsat and PlanetScope) and auxiliary data on infrastructure and biophysical properties. The dataset provides the following fifteen labels: oil palm, timber, fruit, rubber and other-large scale plantations; grassland/shrubland; small-scale oil palm or maize plantations and other small-scale agriculture; mining; selective logging; infrastructure; wildfires; hunting; and other.
Background & Summary
Africa, which is home to the second largest rainforest in the world, the Congo Basin1, experienced the largest continental annual forest area net change for 2010–20202. Within the Congo Basin, Cameroon had the sharpest average annual rise in primary forest and tree cover loss between 2016 and 20213, highlighting the importance of understanding drivers of Cameroonian deforestation and degradation dynamics, in order to make informed decisions to limit impacts4. Direct deforestation drivers describe the activities directly resulting in the land-use change (e.g. conversion to agricultural land, development of infrastructure)1. They are, however, difficult to track on the ground, and Earth Observation (EO) offers opportunities to cover large areas which can be difficult to access.
Attempts have been made to classify direct tropical deforestation and degradation drivers, and follow up land uses, in Indonesia5, Ethiopia6, Suriname7, the Republic of Congo7, the Democratic Republic of Congo7, and Africa as a whole8,9. These highlighted the potential of EO. However, they also emphasised the need for tailored and locally trained algorithms to make sure the decisions made to define the land use classes correspond to national deforestation dynamics. Global approaches also do not account for spatio-temporal heterogeneity in land use between countries, and usually lack diversity in the representation of classes6,8. In addition, detailed information about the drivers, i.e. beyond broad classes such as ‘agriculture’, is needed to monitor and target efforts towards specific drivers, but is usually lacking6,8. A common limitation cited for the development of such approaches across countries is the lack of reference datasets10. This was a limitation we faced when trying to design a detailed and comprehensive approach to automatically classify direct deforestation drivers in Cameroon. As a result, we created a new labelled dataset for Cameroon, presented here, collated and standardised from nine existing datasets. Our efforts show that the common trope that there is ‘not enough’ labelled data for spatial Artificial Intelligence (AI) applications for sub-Saharan Africa11 can be a misconception. Instead, we found that issues arise in finding and accessing open, geolocated and spatially explicit data in a uniform format, on a single platform, which is easy to use and download.
Methods
Overview
In order to create a new labelled EO dataset for deforestation drivers in Cameroon we followed these steps:
-
1)
Identify appropriate drivers using key informant discussions and literature.
-
2)
Convert the Global Forest Change (GFC) product to a shapefile format for the area covering Cameroon.
-
3)
Identify suitable georeferenced data of land use in Cameroon.
-
4)
Overlay these with GFC data to identify areas that had been recently deforested and extract forest loss masks.
-
5)
Extract corresponding Landsat-8 single date images and NICFI PlanetScope monthly composites centred on the forest loss masks, and cross-reference these to driver data.
-
6)
Extract corresponding auxiliary data.
Resultant data are presented in formats useful for ML/AI applications - as sets of EO and auxiliary data. We present the EO and auxiliary data in three formats, according to large-scale (‘grouped’) deforestation drivers, according to fine-scale (‘detailed’) deforestation drivers, and as a time-series of data for ‘detailed’ drivers, and the labels separately for easy cross-reference. For each image, the label applies to the area delimited by the forest loss masks. The workflow is summarised on Fig. 1. Our dataset is freely available from Zenodo12.

Workflow to generate a reference labelled dataset. In pink: the operation on the GFC product. In purple: operations on the data sources. In yellow: creation of forest loss pickle files. In blue: extraction of satellite imagery. In green: extraction of auxiliary data.
Defining the classification scheme
In order to define appropriate classes of deforestation drivers for our dataset, we reviewed academic and grey literature13,14,15,16,17,18,19,20,21,22,23, and carried out key-informant discussions with different experts in NGOs, academia, research institutes, intergovernmental organisations, and partnership initiatives. We further refined our classes based on the availability of data, and the final labels we used are explained in Table 1. Our classification includes drivers of degradation alongside deforestation, since degradation is often the first step before deforestation24,25 and impacts forest structure and function26.
Classification of forest loss areas
We downloaded Global Forest Change (GFC)27 granules (https://storage.googleapis.com/earthenginepartners-hansen/GFC-2020-v1.8/download.html) for Cameroon (coordinates 0–10 N, 0–10E; 0–10 N, 10–20E; 10–20 N, 10–20E) for each year between 2015 and 2020. GFC corresponds to annual tree cover loss maps derived from Landsat data, with a 30-m resolution. We chose 2015–2020 as our period of study to make sure we use the most accurate and recent methodology28 used to derive GFC, to focus on recent deforestation patterns, and to best reflect the availability of the datasets used for labelling (more details in the section below).
We converted the GFC TIFF files to shapefiles. First, for each year, we binarised TIFF images with tree cover loss locations in the corresponding year. Then, we used the Python GDAL library to select the loss pixels and create one GFC shapefile per year. Each GFC shapefiles contains multiple shapes corresponding to tree loss areas in the given year. The tree cover loss from GFC is considered as a forest loss for this study.
Selection of data for associated direct deforestation drivers
We used data from nine sources on land cover/land use in Cameroon:
-
Shapefiles from Global Forest Watch (GFW) identifying areas of selective logging annually for 2015–201829 (https://data.globalforestwatch.org/datasets/f5f24ef23b86444699aff1e23a0eb27b_3/explore?location=3.863682%2C12.477300%2C7.54).
-
GeoJSON files from Land Matrix identifying fruit plantations present for the entire period 2018–2020, and timber plantations present for 2015–202030, converted to shapefiles using QGIS (https://landmatrix.org/map/, by selecting ‘Cameroon’ in the ‘Country’ section).
-
Shapefiles, selected individually from yearly GIS Cameroon data, from the World Resources Institute (WRI) Cameroon Forest Atlas identifying rubber plantations, oil palm plantations, fruit plantations, other large-scale plantations for 2015–2017 and 2019–2020, mining for 2019–202016, as well as specific oil palm and rubber plantations (BioPalm, SocaPalm, SudCam, Hevecam) present for the entire period 2015–202016,23 (https://data.globalforestwatch.org/search?layout=grid&q=cameroon%20GIS%20data&sort=Date%20Created%7Ccreated%7Cdesc), and hunting for 2015–202016 (https://data.globalforestwatch.org/datasets/050ee10e13ec471ba9e2305f82759541_88/explore?location=5.368277%2C14.094700%2C6.74).
-
TIF files from the European Space Agency (ESA) WorldCover map, identifying grassland/shrubland and permanent water bodies (for the ‘other’ class) for 202031, converted to shapefiles using the Python GDAL library (https://viewer.esa-worldcover.org/worldcover/?language=en&bbox=-91.91076222321404,-57.011563963962864,117.24202780840146,33.059940763899064&overlay=false&bgLayer=OSM&date=2024-05-01&layer=WORLDCOVER_2020_MAP, by selecting ‘Administrative borders’>’Countries’ and clicking on Cameroon in ‘Download’>’Extent’).
-
A CSV file from Geo-Wiki identifying the coordinates of wildfires, infrastructure and other small-scale plantations (cassava) in 202032,33 (https://pure.iiasa.ac.at/id/eprint/17539/).
-
A CSV file from Doungous et al. identifying the coordinates of other small-scale plantations (maize) in 202034 (https://view.officeapps.live.com/op/view.aspx?src=https%3A%2F%2Fars.els-cdn.com%2Fcontent%2Fimage%2F1-s2.0-S0261219422001132-mmc1.xlsx&wdOrigin=BROWSELINK).
-
A TIF file from BIOPAMA identifying small-scale oil palm plantation in 201935,36, with the relevant layer extracted and converted to a shapefile on QGIS (https://zenodo.org/records/4473715).
-
TIF files from WorldCereal identifying small-scale maize plantations and other small-scale plantations (wheat, barley, rye) in 202031, converted to shapefiles on QGIS (https://zenodo.org/records/5571936).
-
Shapefile from GlobFire identifying wildfires annually for 2015–202037,38 (https://doi.pangaea.de/10.1594/PANGAEA.895835).
We manually checked for any duplicated information between different sources to remove them. If the data sources contradicted themselves, the data was also removed.
The data sources above identify land cover/land use at the time of survey, but do not provide information about whether deforestation or any other type of land use change happened there. We therefore overlaid each land use file with GFC annual shapefiles for each year where the land use has been identified. For each shapefile from GFW, Land Matrix, and WRI we looked for a GFC forest loss polygon contained in that shape and extracted that polygon as a shapefile and a corresponding pickle file (Python-specific format to serialise an object, i.e. to convert it to a linear form). For WorldCover, WorldCereal, BIOPAMA, and GlobFire, we intersected the shapefiles with the GFC shapefiles directly on QGIS and then extracted the intersections as individual forest loss polygons shapefiles and corresponding pickle files using the Python GDAL library. For WorldCover, we limited the number of forest loss shapefiles to the first hundred per year, following the ordered indices of the shapes in the intersection shapefile obtained with QGIS. For Geo-Wiki and Doungous et al. data, we extracted the coordinates of the datapoints in the CSV files, checked that they were included in Cameroon and looked for GFC polygons containing these coordinates to then extract these GFC forest loss polygons as shapefiles and generate the corresponding pickle files with the Python GDAL library. For WorldCover, WorldCereal, and Geo-Wiki, different shapefiles were created for each type of driver.
For large-scale plantations except fruit plantations, we extracted two additional GFC forest loss polygons from each shape in WRI shapefiles. For mining and fruit plantations, we extracted three additional GFC forest loss polygons from WRI shapefiles. This step was needed to obtain enough training data for these classes.
The steps above give us forest loss pickle files, or forest loss masks, where we know the deforestation drivers thanks to the data sources used. In other words, we obtain labels for our images, which are centred on the forest loss masks. The label will apply only to the area covered by the forest loss mask. The process to download the images is described in more detail in the section below. The labels are determined using the names of the data sources overlaid with the GFC shapefiles (e.g. ‘BioPalm.shp’ for BioPalm data corresponds to ‘Oil palm plantation’). In the case of data sources with multiple types of land uses, i.e. for agro-industrial plantations in WRI data, the label is given based on a manual inspection of each shape within the shapefiles and the use of additional data from the Cameroon Forest Atlas website16, giving us information about the crop type for each individually indexed shape.
Images
We downloaded Landsat-8 and NICFI PlanetScope imagery from Google Earth Engine, using the multiprocessing package to enable parallel processing and therefore a faster download of images.
We downloaded images with the centroid of the forest loss polygons as the centre of the images. For Landsat-8 images, we selected the calibrated top-of-atmosphere (TOA) reflectance image, and pan-sharpened the 30-m resolution images to a 15 m resolution using the panchromatic band 8. For each forest loss polygon, we selected the image with the lowest cloud clover available in the five years following the forest loss event (which corresponds to the year of the GFC layer used to generate the forest loss polygon). We chose 20% cloud cover as the maximum threshold, which was derived by trial and error through visual examination of the obtained images. We downloaded the red, green, and blue bands and clipped the image to obtain a 332 × 332 pixels RGB image, which corresponds to a 5 km by 5 km area5. We selected only the RGB bands to directly compare with the NICFI PlanetScope data, which does not provide shortwave infrared or thermal infrared bands like Landsat-8. The code used to download images, based on the Google Earth Engine Python API, allows for flexibility in the selection of other bands and additional sensors or collections and could be used to download other types of images. For NICFI PlanetScope data, we selected the first high (4.77 m) resolution RGB monthly composite available starting from the year following the GFC-defined forest loss event. We downloaded a clipped image with a 332 × 332 pixels dimension, which corresponds to a 1.6 km by 1.6 km area.
In order to allow the user the flexibility to use a time series approach to classify direct deforestation drivers, we present up to five images for each location. For Landsat-8, we selected the five images with the lowest cloud cover percentages in the five years following the forest loss event, retaining a minimum two-month time difference between each image. We kept 20% as the maximum cloud cover, which meant that not all locations provided us with five images to test our approach. In total, 84% of locations provided us with five images, and 90% with at least four images. We removed all locations that only gave us one image. For NICFI PlanetScope, we selected the first five monthly composites available starting from the year following the forest loss event, and again we also made sure to have at least two months between each composite Fig. 2.

Locations of the centroids of the labelled NICFI PlanetScope images in Cameroon. The Landsat-8 dataset is similar, with around 300 fewer points, but a similar data distribution. Most data points are located in the South of the country as it is the area where most of the forest is located.
Auxiliary data
For each image, we added auxiliary biophysical and infrastructure information5, to enhance and potentially improve the performance of downstream classification tasks by the user. For all variables, we assume that the value in one pixel of the lower resolution data (i.e. auxiliary data) is the same in all the pixels of the higher resolution data (i.e. image) that cover the same area:
-
Forest gain (bitmask) from GFC27: 30-m resolution, data for the period 2000–2012, downloaded via the Google Earth Engine Python API (although here we note that these data have not been updated since 2012, and so other products such as Tropical Moist Forest (TMF)24 providing forest regrowth data for 1990–2022 could provide more recent information).
-
Near infrared, shortwave infrared 1 and 2 bands from Landsat-8 TOA: 30-m resolution, data every 16 days for 2013–2023, downloaded via the Google Earth Engine Python API and selected using the same process as for Landsat-8 RGB images.
-
From National Centers for Environmental Prediction (NCEP) Climate Forecast System Version 2 (CFSv2) 6-hourly Products39,40 (https://rda.ucar.edu/datasets/ds094.0/#): surface level albedo and volumetric soil moisture content (depths: 0.1 m, 0.4 m, 1.0 m, 2.0 m) in 0.01%; radiative fluxes (clear-sky longwave flux downward and upward, clear-sky solar flux downward and upward, direct evaporation from bare soil, longwave and shortwave radiation flux downward and upward, latent, ground and sensible heat net flux), potential evaporation rate, and sublimation in W/m²; humidity (specific, maximum specific, minimum specific) in 10-4 kg/kg; ground level precipitation in 0.1 mm; air pressure at surface level in 10 Pa; wind level (u and v component) in 0.01 m/s, water runoff at surface level in 232.01 kg/ m²; temperature in K: 22264-m resolution, available four times a day for 2011-2023, downloaded directly from the NOAA website and selected the mean of the monthly mean over five years before the forest loss event, the monthly maximum over five years before the forest loss event, and the monthly minimum over five years before the forest loss event for each parameter.
-
Closest street and closest city from OpenStreetMap41 in km: directly downloaded with the Nominatim API.
-
Altitude in m, slope and aspect in 0.01° from the Shuttle Radar Topography Mission (SRTM)42: 30-m resolution, measured for 2000, downloaded via the Google Earth Engine API.
-
Presence of peat (bitmask) from GFW43 (https://data.globalforestwatch.org/datasets/gfw::global-peatlands/about): 232-m resolution, measured for 2017, directly downloaded on the GFW website.
Data Records
The dataset described in this paper is available from Zenodo12: https://zenodo.org/records/8325259. It is divided into different folders, following the classification scheme used, and the labels for the images are in a separate folder:
-
‘my_examples_landsat_final_detailed.zip’ contains Landsat-8 images, auxiliary data and forest loss pickle files that can be used to train, validate and test a model for the detailed classification of deforestation drivers (15 classes, Table 1).
-
‘my_examples_planet_final_detailed.zip’ contains NICFI PlanetScope images, auxiliary data and forest loss pickle files that can be used to train, validate and test a model for the detailed classification of deforestation drivers (15 classes, Table 1).
-
‘my_examples_landsat_final.zip’ contains Landsat-8 images, auxiliary data and forest loss pickle files that can be used to train, validate and test a model for the classification of deforestation drivers by groups (4 classes, Table 1).
-
‘my_examples_planet_final.zip’ contains NICFI PlanetScope images, auxiliary data and forest loss pickle files that can be used to train, validate and test a model for the classification of deforestation drivers by groups (4 classes, Table 1).
-
‘my_examples_landsat_detailed_timeseries.zip’ contains Landsat-8 images, auxiliary data and forest loss pickle files that can be used to test a model for the detailed classification of deforestation drivers (15 classes, Table 1) using multiple images and a time series analysis.
-
‘my_examples_planet_detailed_timeseries.zip’ contains NICFI PlanetScope images, auxiliary data and forest loss pickle files that can be used to test a model for the detailed classification of deforestation drivers (15 classes, Table 1) using multiple images and a time series analysis.
-
‘labels.zip’ which includes, in csv files, the labels for each image in each folder described above (image identified by folder and coordinates or ‘path’) and matches the format of the csv files used as inputs to train, validate and test our classification model. The csv files are generated when populating the ‘my_examples_XX’ folders above, based on the name of the data sources overlaid with GFC shapefiles. Each ‘all.csv’ contains all images with their labels for each sensor and classification scheme.
For ‘labels.zip’, we have subfolders for Landsat and PlanetScope. Then, for each type of imagery, we have subfolders for ‘detailed’, ‘groups’ and ‘time series’ which correspond to the different ‘my_examples’ folders listed above.
For each folder, subfolders named with the coordinates of the centre of the images contain each:
-
A folder ‘images’, with a sub-folder ‘visible’ containing the PNG RGB image; and a sub-folder ‘infrared’ containing the infrared bands in a NPY file.
-
A folder ‘auxiliary’ with topographic and forest gain information in a NPY format, OpenStreetMap and peat data in a JSON format, and a sub-folder ‘ncep’ containing all data from NCEP in a NPY format.
-
The forest loss pickle file delimiting the area of forest loss Fig. 3.
Fig. 3 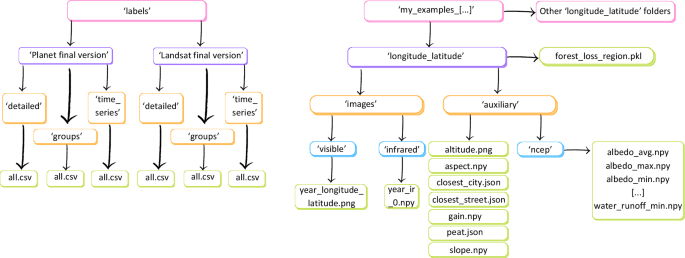
Structure of the data records for the images in our dataset. Each colour represents a folder sub-level. For instance, the final files are in green and the parent folders are in pink.

Technical Validation
We rely on the technical validation performed for each data source by the original data creators used to identify land use and forest loss patches. GFW29 data checks rely on the collaboration with the Cameroon Ministry of Forestry and Wildlife and WRI. Land Matrix30 uses an error-checking process involving cross checks with multiple data sources. WorldCover31 data has been independently validated by Wageningen University and the International Institute for Applied Systems Analysis (IIASA)44. Geo-Wiki32 data quality checks involved using control locations to produce quality scores for participants labelling drivers of forest loss and the technical validation involved a comparison with the Curtis et al.45 drivers of forest loss layer in South America. Doungous et al.34 data are individual field surveys. BIOPAMA data36 was validated with more than 10,000 randomly distributed reference points35 and existing oil palm maps46,47,48,49. WorldCereal50 relies on high quality reference datasets provided by the agricultural community and accuracy checks by users. GlobFire data37 was validated by comparison with other wildfires databases51,52,53,54,55,56,57.
We still performed additional steps to make sure of the quality of our dataset:
-
We cross-checked the data when the same information was provided through multiple data sources, and removed land-use shapefiles where the detailed land uses did not match or kept only one shapefile when there were duplicates.
-
We removed all land use shapefiles where the detailed land use was uncertain, even if auxiliary sources such as company websites suggested specific land uses in certain locations.
-
We determined the 20% threshold for cloud cover by trial and error to find a balance between having enough images and having images satisfactory enough (i.e. not too cloudy) to be able to classify drivers. The quality of the images was determined by visual examination of the results with different thresholds.
-
We cleaned up our image dataset to remove downloaded satellite images with a size below 10kB, which corresponded to blank images and not the RGB images expected.
Usage Notes
This data can be used fully or partially to train, validate and test the classification of direct deforestation drivers or follow-up land use after deforestation. The code provided can also be re-purposed for other locations, or other types of imagery.
All data that has been used, modified and re-distributed is compliant with the data sharing licenses. The NICFI PlanetScope images fall under the same license as the NICFI data program license agreement. OpenStreetMap® is open data, licensed under the Open Data Commons Open Database License (ODbL). The rest of the data is under a Creative Commons Attribution 4.0 International License.
Code availability
The code used to prepare data is available on Github, in the ‘prepare_files’ folder and the code to format the folders in ‘model’ > ’data’ > ’ForestNetDataset’: https://github.com/aedebus/Cam-ForestNet. The folders are organised to be ready-to-use with our classification model, Cam-ForestNet, by simply unzipping the relevant ‘my_examples’ folder in ‘model’ > ’data’ > ’ForestNetDataset’.
QGIS 3.24.0, Python 3.8./3.5., and the Google Earth Engine Python API were used. Ubuntu 20.04.3 LTS was used to run the code.
References
Tchatchou, B., Sonwa, D.J., Ifo, S., & Tiani, A.M. Deforestation and Forest Degradation in the Congo Basin: State of Knowledge, Current Causes and Perspectives. (Center for International Forestry Research (CIFOR), 2015).
FAO. Global Forest Resources Assessment 2020: Main Report. (FAO, 2020).
Global Forest Watch. Cameroon Deforestation Rates & Statistics. https://www.globalforestwatch.org/dashboards/country/CMR (2022).
Finer, M. et al. Combating deforestation: From satellite to intervention. Science 360, 1303–1305 (2018).
Irvin, J. et al. ForestNet: Classifying Drivers of Deforestation in Indonesia using Deep Learning on Satellite Imagery. Preprint at https://arxiv.org/pdf/2011.05479.pdf (2020).
Masolele, R. N. et al. Using high-resolution imagery and deep learning to classify land-use following deforestation: a case study in Ethiopia. GIsci. Remote Sens. 59, 1446–1472 (2022).
Slagter, B. et al. Monitoring direct drivers of small-scale tropical forest disturbance in near real-time with Sentinel-1 and -2 data. Remote Sens. Environ. 295, 113655 (2023).
Masolele, R. N. et al. Spatial and temporal deep learning methods for deriving land-use following deforestation: A pan-tropical case study using Landsat time series. Remote Sens. Environ. 264, 112600 (2021).
Masolele, R. N. et al. Mapping the diversity of land uses following deforestation across Africa. Sci. Rep. 14, 1681 (2024).
Fritz, S. et al. A global dataset of crowdsourced land cover and land use reference data. Sci. Data 4, 170075 (2017).
Gwagwa, A., Kachidza, P., Siminyu, K. & Smith, M. Responsible Artificial Intelligence in Sub-Saharan Africa: Landscape and State of Play. (Artificial Intelligence for Development Africa, 2021).
Debus, A. et al. Labelled dataset to classify direct deforestation drivers in Cameroon (1.00). Zenodo https://doi.org/10.5281/zenodo.8325259 (2024).
ATIBT. Forest resources and context of Cameroon. Timber Trade Portal https://www.timbertradeportal.com/en/cameroon/22/country-context (2022).
Branthomme, A. et al. How Much Do Large-Scale and Small-Scale Farming Contribute to Global Deforestation?: Results from a Remote Sensing Pilot Approach. (FAO, 2023).
Central African Forest Initiative (CAFI). Summary of Drivers – Crops (More Info to Follow on Other Drivers) - Summary of Possible Interventions – These Would Be Implemented across One or More Pilot Site. (2021).
Cameroon Ministry of Forestry and Wildlife. Forest Atlas of Cameroon. https://cmr.forest-atlas.org/map?l=fr (2022).
FAO. Drivers of deforestation and degradation. https://sites.google.com/view/cafifaoddd/home?authuser=0 (2022).
Gideon Neba, S., Kanninen, M., Eba’a Atyi, R. & Sonwa, D. J. Assessment and prediction of above-ground biomass in selectively logged forest concessions using field measurements and remote sensing data: Case study in South East Cameroon. FNor. Ecol. Manag. 329, 177–185 (2014).
Mahmoud, M. I., Campbell, M. J., Sloan, S., Alamgir, M. & Laurance, W. F. Land-cover change threatens tropical forests and biodiversity in the Littoral Region, Cameroon. Oryx 54, 882–891 (2020).
Montellano, A. R. & Armijo, E. Detecting forest degradation patterns in Southeast Cameroon. Simpósio Bras. Sens. Remoto 8, 1608–1611 (2011).
Ordway, E. M., Naylor, R. L., Nkongho, R. N. & Lambin, E. F. Oil palm expansion and deforestation in Southwest Cameroon associated with proliferation of informal mills. Nat. Commun. 10, 114 (2019).
Tabe-Ojong, M. P., Ordway, E., Nkongho, R. N. & Molua, E. L. Oil Palm Expansion and Smallholder Farm Households in Cameroon. https://ideas.repec.org/p/ags/iaae21/315899.html (2021).
Verhegghen, A., Beauchamp, E. & Seigneret, A. Democratizing Earth Observation to Improve Transparency in Land Use Governance. https://www.landcam.org/sites/landcam/files/resources/FLAGSHIP%20REPORT%20IIED-JRC%20Final%20November%202021%20light%20%281%29_0.pdf (2021).
Vancutsem, C. et al. Long-term (1990–2019) monitoring of forest cover changes in the humid tropics. Sci. Adv. 7, eabe1603 (2021).
Zekeng, J. C. et al. Land use and land cover changes in Doume Communal Forest in eastern Cameroon: implications for conservation and sustainable management. Model. Earth Syst. Environ. 5, 1801–1814 (2019).
Ahrends, A. et al. Detecting and predicting forest degradation: A comparison of ground surveys and remote sensing in Tanzanian forests. Plants People Planet 3, 268–281 (2021).
Hansen, M. C. et al. High-Resolution Global Maps of 21st-Century Forest Cover Change. Science 342, 850–853 (2013).
Weisse, M. & Potapov, P. How Tree Cover Loss Data Has Changed Over Time | GFW Blog. Global Forest Watch Content https://www.globalforestwatch.org/blog/data-and-research/tree-cover-loss-satellite-data-trend-analysis (2021).
Cameroon Ministry of Forestry and Wildlife & World Resources Institute. Cameroon Forest Management Units. Global Forest Watch Open Data Portal https://data.globalforestwatch.org/ (2019).
The Land Matrix. Africa: Map. https://landmatrix.org/map (2023).
Zanaga, D. et al. ESA WorldCover 10 m 2020 V100. Zenodo https://doi.org/10.5281/zenodo.5571936 (2021).
Laso Bayas, J. C. et al. A global reference database of crowdsourced cropland data collected using the Geo-Wiki platform. Sci. Data 4, 170136 (2017).
Laso Bayas, J. C. et al. Crowdsourcing deforestation in the tropics during the last decade: Data sets from the ‘Driver of Tropical Forest Loss’ Geo-Wiki campaign. IIASA PURE https://doi.org/10.22022/NODES/06-2021.122 (2021).
Doungous, O. et al. Cassava mosaic disease and its whitefly vector in Cameroon: Incidence, severity and whitefly numbers from field surveys. Crop Prot. 158, 106017 (2022).
Descals, A. et al. High-resolution global map of smallholder and industrial closed-canopy oil palm plantations. Earth Syst. Sci. Data 13, 1211–1231 (2021).
Descals, A. et al. High resolution global industrial and smallholder oil palm map for 2019. Zenodo https://doi.org/10.5281/zenodo.4473715 (2021).
Artés, T. et al. A global wildfire dataset for the analysis of fire regimes and fire behaviour. Sci. Data 6, 296 (2019).
Artés Vivancos, T. & San-Miguel-Ayanz, J. Global Wildfire Database for GWIS. PANGAEA https://doi.org/10.1594/PANGAEA.895835 (2018).
Saha, S. et al. NCEP Climate Forecast System Version 2 (CFSv2) 6-hourly Products. Research Data Archive at the National Center for Atmospheric Research, Computational and Information Systems Laboratory https://doi.org/10.5065/D61C1TXF (2011).
Saha, S. et al. The NCEP Climate Forecast System Version 2. J. Climate 27, 2185–2208 (2014).
OpenStreetMap contributors. OpenStreetMap. OpenStreetMap https://www.openstreetmap.org/ (2022).
NASA JPL. NASADEM Merged DEM Global 1 arc second V001. NASA EOSDIS Land Processes DAAC https://doi.org/10.5067/MEaSUREs/NASADEM/NASADEM_HGT.001 (2020).
Crezee, B. et al. Mapping peat thickness and carbon stocks of the central Congo Basin using field data. Nat. Geosci. 15, 639–644 (2022).
European Space Agency. WorldCover. https://esa-worldcover.org/en (2022).
Curtis, P. G., Slay, C. M., Harris, N. L., Tyukavina, A. & Hansen, M. C. Classifying drivers of global forest loss. Science 361, 1108–1111 (2018).
Descals, A. et al. Oil Palm (Elaeis guineensis) Mapping with Details: Smallholder versus Industrial Plantations and their Extent in Riau, Sumatra. Remote Sensing 11, 2590 (2019).
Xu, Y. et al. Annual oil palm plantation maps in Malaysia and Indonesia from 2001 to 2016. Earth Syst. Sci. Data 12, 847–867 (2020).
FAO. FAOSTAT. https://www.fao.org/faostat/en/#data/QCL (2023).
Gaveau, D. L. A. et al. Slowing deforestation in Indonesia follows declining oil palm expansion and lower oil prices. PLOS ONE 17, e0266178 (2022).
VITO. Home | WorldCereal. https://esa-worldcereal.org/en (2022).
Porter, T. W., Crowfoot, W. & Newsom, G. 2018 Wildfire Activity Statistics. (California Department of Forestry and Fire Protection, 2018).
Joint Research Centre (European Commission) et al. Forest Fires in Europe, Middle East and North Africa 2016. (Publications Office of the European Union, LU, 2017).
Andela, N. et al. The Global Fire Atlas of individual fire size, duration, speed and direction. Earth Syst. Sci. Data 11, 529–552 (2019).
Eidenshink, J. et al. A Project for Monitoring Trends in Burn Severity. Fire Ecol. 3, 3–21 (2007).
Anderson, L. O. et al. Disentangling the contribution of multiple land covers to fire-mediated carbon emissions in Amazonia during the 2010 drought. Global Biogeochem. Cycles 29, 1739–1753 (2015).
Anderson, L. O., de Aragão, L. E. O. E. C., de Lima, A. & Shimabukuro, Y. E. Detecção de cicatrizes de áreas queimadas baseada no modelo linear de mistura espectral e imagens índice de vegetação utilizando dados multitemporais do sensor MODIS/TERRA no estado do Mato Grosso, Amazônia brasileira. Acta Amaz. 35, 445–456 (2005).
Shimabukuro, Y. E. et al. Fraction images derived from Terra Modis data for mapping burnt areas in Brazilian Amazonia. Int. J. Remote Sens. 30, 1537–1546 (2009).
Acknowledgements
Thank you to all those who collected the data provided by GFW, Land Matrix, WRI, ESA, Geo-Wiki, Doungous et al., BIOPAMA, WorldCereal, and GlobFire. A.D. was funded by the Natural Environment Research Council (NE/S007164/1). E.R.L was funded by a UKRI Future Leaders Fellowship (MR/T019832/1). A.E. would like to thank Samuel Nguiffo, the General Secretary of CED for the framework that enabled progress on this project. For the purpose of open access, the author has applied a Creative Commons Attribution (CC BY) licence to any Author Accepted Manuscript version arising from this submission.
Author information
Authors and Affiliations
Contributions
Conceptualisation: A.D., E.B., E.R.L.; Advice on driver classification and data sources: J.A., A.E., J.K., A.V., C.Z.; Methodology, Formal analysis, Investigation, Software, Validation, Resources, Data Curation & Visualisation: A.D.; Writing - Original Draft: A.D., E.R.L.; Writing - Review & Editing: A.D., E.R.L., A.V., C.Z.
Corresponding author
Ethics declarations
Competing interests
The authors declare no competing interests.
Additional information
Publisher’s note Springer Nature remains neutral with regard to jurisdictional claims in published maps and institutional affiliations.
Rights and permissions
Open Access This article is licensed under a Creative Commons Attribution 4.0 International License, which permits use, sharing, adaptation, distribution and reproduction in any medium or format, as long as you give appropriate credit to the original author(s) and the source, provide a link to the Creative Commons licence, and indicate if changes were made. The images or other third party material in this article are included in the article’s Creative Commons licence, unless indicated otherwise in a credit line to the material. If material is not included in the article’s Creative Commons licence and your intended use is not permitted by statutory regulation or exceeds the permitted use, you will need to obtain permission directly from the copyright holder. To view a copy of this licence, visit http://creativecommons.org/licenses/by/4.0/.
About this article

Cite this article
Debus, A., Beauchamp, E., Acworth, J. et al. A labelled dataset to classify direct deforestation drivers from Earth Observation imagery in Cameroon. Sci Data 11, 564 (2024). https://doi.org/10.1038/s41597-024-03384-z
Received:
Accepted:
Published:
DOI: https://doi.org/10.1038/s41597-024-03384-z
