
Abstract
PepSeq is an in vitro platform for building and conducting highly multiplexed proteomic assays against customizable targets by using DNA-barcoded peptides. Starting with a pool of DNA oligonucleotides encoding peptides of interest, this protocol outlines a fully in vitro and massively parallel procedure for synthesizing the encoded peptides and covalently linking each to a corresponding cDNA tag. The resulting libraries of peptide/DNA conjugates can be used for highly multiplexed assays that leverage high-throughput sequencing to profile the binding or enzymatic specificities of proteins of interest. Here, we describe the implementation of PepSeq for fast and cost-effective epitope-level analysis of antibody reactivity across hundreds of thousands of peptides from <1 µl of serum or plasma input. This protocol includes the design of the DNA oligonucleotide library, synthesis of DNA-barcoded peptide constructs, binding of constructs to sample, preparation for sequencing and data analysis. Implemented in this way, PepSeq can be used for a number of applications, including fine-scale mapping of antibody epitopes and determining a subject’s pathogen exposure history. The protocol is divided into two main sections: (i) design and synthesis of DNA-barcoded peptide libraries and (ii) use of libraries for highly multiplexed serology. Once oligonucleotide templates are in hand, library synthesis takes 1–2 weeks and can provide enough material for hundreds to thousands of assays. Serological assays can be conducted in 96-well plates and generate sequencing data within a further ~4 d. A suite of software tools, including the PepSIRF package, are made available to facilitate the design of PepSeq libraries and analysis of assay data.
Introduction
Antibodies are important clinical, immunological and epidemiological biomarkers1,2. They are stable circulating molecules whose production requires multiple layers of cellular cooperation and genetic diversification with antigen-driven selection, making them highly specific reporters of both the inciting agent and the host’s immune capacity. At the same time, the enormous diversity of the antibody repertoire—and its possible antigenic targets—poses a challenge: traditional assays are able to quantify only a single antibody specificity per unit volume of material and thus are unable to provide a comprehensive view of the response from a typical sample. Instead, the next generation of immunomonitoring requires highly multiplexed but cost-effective approaches capable of resolving antibody reactivity across large numbers of targets simultaneously by using a small sample volume.
Traditional serological assays such as ELISA use immobilized antigen (e.g., peptides, proteins and whole pathogens) and enzymatic or fluorescent detection to quantify antibody reactivity against a single target at a time3. Although they can be highly quantitative, these assays are limited in their ability to provide breadth and resolution, because each additional target of interest requires the consumption of additional serum or plasma, which is often limiting, as well as other associated reagents, which can quickly inflate cost. To obtain high sensitivity, these assays also commonly use large, complex antigens with the potential for cross-reactivity among closely related targets. The use of encoded beads has expanded the multiplexity of serological assays to the range of 5–500 simultaneous antigens4,5, but this remains incommensurate with the diversity of natural antibody responses. In addition, high-density peptide array technologies have been developed that allow hundreds to hundreds of thousands of peptides to be assayed simultaneously6,7; however, these approaches have not yet achieved widespread uptake, probably in part because the need to manufacture and/or process one array for each sample can be cost prohibitive for larger-scale experiments.
In contrast, highly multiplexed serology can be achieved cost-effectively by solution-phase assays in which antibodies are probed with highly diverse libraries of DNA-associated antigens, and binding is then quantified by measuring the relative abundance of each peptide by using high-throughput sequencing. Populations of phage particles displaying defined libraries of peptides on their surface represent a successful embodiment of this approach8,9 and have been used to profile reactivity across the human proteome10 as well as the proteomes of all human-infecting viruses8,11. Here, we describe a method (PepSeq) predicated on the same general principle as phage display but involving a much simpler molecular construct—a covalent adduct of peptide and cDNA. A derivative of mRNA display, this process uses bulk enzymatic transcription and translation followed by puromycin-mediated intramolecular coupling between the peptide and its encoding nucleic acid sequence12 to build high-complexity libraries representing antigen sets of interest that can be used to deeply profile polyclonal antibody repertoires. Advantages of this approach include the reduced potential for non-specific background binding, as well as the ability to construct libraries for highly multiplexed serology assays entirely in vitro (Fig. 1).

a, Design of a peptide library begins with a set of target protein sequences. An informatic approach (such as the combined sliding-window/set-cover algorithm described in the ‘Design of peptide-encoding oligonucleotides’ section of ‘Experimental design’) is then used to design a library of peptides of a user-defined length that cover the supplied target sequences (green and blue bars). Next, amino acid sequences are informatically converted into DNA encodings, and constant regions (black segments) are added to each end. The corresponding DNA oligonucleotide library is prepared by massively parallel DNA synthesis and converted in bulk to a corresponding library of DNA-barcoded peptides (‘PepSeq probes’) by using in vitro transcription and translation and taking advantage of intramolecular coupling mediated by a tethered puromycin (P)-containing molecule. b, A library of PepSeq probes, prepared as in a, are then incubated with biological samples of interest, allowing antibodies to bind their cognate epitopes (binding indicated by the yellow halos). The antibodies are then captured onto protein-bound beads via their constant regions, unbound PepSeq probes are washed away and bound PepSeq probes are eluted. c, The DNA tags of eluted PepSeq probes are amplified by PCR, and the relative abundance of each probe is quantified by using high-throughput sequencing. Changes in relative abundance provide a semi-quantitative measure of cognate antibody abundance/affinity for each peptide in the design. Created with BioRender.com.
RNA-peptide fusions constructed by using puromycin-mediated intramolecular coupling were first described in the context of very large, randomly diversified libraries that were used for in vitro affinity selections12. PepSeq represents an improvement on this approach in which the linker between RNA and peptide is configured with a hairpin that enables facile conversion of the RNA into a more stable barcode through reverse transcription into cDNA. PepSeq has been used to produce libraries containing thousands of fully customizable peptides, enabling highly multiplexed assays for analysis by next-generation sequencing13, and has enabled the deep characterization of substrate specificities of proteases13,14,15,16,17 and kinases13. More recently, the PepSeq platform has been applied to highly multiplexed serology to study antibody responses across libraries of hundreds of thousands of peptides comprising the human virome, including to identify cross-reactivity between antibodies recognizing severe acute respiratory syndrome coronavirus 2 and endemic human coronavirus epitopes18,19.
Capabilities needed to perform the protocol
Design of PepSeq libraries requires an informatic capability to download and manipulate sequence strings at a proteome scale (i.e., work with files containing thousands to millions of sequences) and familiarity with the Unix command line. Construction of the puromycin-containing adapter molecules requires capabilities in synthetic phoshoramidite oligonucleotide chemistry. Successful execution of the PepSeq library synthesis and highly multiplexed serology protocols requires basic molecular biology capabilities, including in vitro enzymatic reactions, bead handling and preparation of DNA libraries for next-generation sequencing. Analysis of sequencing data by using PepSIRF requires access to and familiarity with the Unix command line.
Overview of the protocol
The fundamental steps involved in the generation of a PepSeq library include the in silico design of the peptide-encoding oligonucleotides (Stage I) and in vitro synthesis of the DNA-barcoded peptides (Stage II). This library of DNA-barcoded peptides can then be used to conduct highly multiplexed serological assays. The fundamental steps required to perform an assay are (i) incubation of the library with an antibody-containing sample (Stage III), (ii) capture of antibodies (Stage III), (iii) amplification of captured barcodes and preparation of DNA libraries (Stage III) and (iv) high-throughput sequencing and data analysis (Stage IV). A schematic of this workflow is depicted in Fig. 1.
Limitations
Although the applications of PepSeq for multiplexed serology are expansive, it is also crucial for users to understand the protocol’s limitations. Like all peptide-based serology assays (including chemically synthesized peptide arrays and phage display), the approach described here is insensitive to those antibodies whose binding depends on complex secondary, tertiary or quaternary structures or post-translational modifications that are not represented by unmodified linear peptides. Like other systems for polyclonal serology, this protocol is also unable to directly dissect the relative impacts of affinity and abundance on the detected antibody responses. The multiplexity of the assay is limited by the costs of DNA synthesis and sequencing. It is also theoretically possible for false positive or negative signals to arise due to probe-probe interference, for example, through the hybridization of complementary sequences in DNA barcodes from different probes. However, we have yet to observe such effects up to scales of 244,000-plex libraries, perhaps in part because the concentration of individual probes (<1 pM) probably limits the kinetics of such hybridization events.20
Experimental design
Design of peptide-encoding oligonucleotides
Synthesis of a PepSeq library begins with a pool of DNA oligonucleotides. The only requirements for these oligonucleotides are that (i) they contain a variable region consisting of codons for the peptides of interest and that (ii) this variable-encoding region is flanked on both sides by conserved 19-nt sequences, which are used as priming sites (Extended Data Fig. 1 and Supplementary Table 1). The complexity of the oligonucleotide pool will determine the complexity of the resulting PepSeq library, and similarly, the length of the variable regions contained in these oligonucleotides will determine the length of the resulting peptides. Therefore, the user can adjust these variables as desired. Primary considerations for peptide length and pool complexity are (i) experimental goals and (ii) cost, including both the initial synthesis cost and the sequencing cost per assay. To date, we have successfully synthesized and used PepSeq libraries with up to 244,000 fully defined peptides and >500 million randomized peptides. We have successfully generated peptides between 15 and 64 aa in length. Longer peptide sequences will provide more efficient coverage of possible linear epitopes and have the potential to detect epitopes with larger footprints; however, the oligonucleotide synthesis and sequencing costs will increase with peptide length, and we have seen some evidence of decreased peptide synthesis efficiency as length is increased.
The most appropriate peptide design strategy will vary depending on the experimental goals. A common design objective is to broadly cover potential epitopes contained within a collection of target proteins. We have used two distinct types of algorithms for this type of design challenge, which can be broadly characterized as (i) sliding-window and (ii) set-cover approaches18. Sliding-window approaches select a set of peptides by choosing equally spaced substrings from the full-length target proteins. For maximum efficiency, sliding-window approaches require protein alignments as input and generally outperform set-cover approaches for target protein sets that contain a relatively small number of similar (but not identical) sequences (e.g., multiple representatives of a single protein from the same species or strain) (Fig. 2). Set-cover approaches, on the other hand, consider all possible peptides of the desired length and seek to minimize the number of peptides needed to cover all potential linear epitopes. These approaches do not require protein alignments and generally outperform sliding-window approaches for target protein sets that contain a moderate or high number of similar (but not identical) sequences. Specifically, set-cover approaches provide an advantage when most potential linear epitopes (i.e., kmers) are present in multiple target sequences (Fig. 2). Here, we detail a strategy that we have found to be broadly generalizable and that uses a combination of the sliding-window and set-cover approaches (Stage I, Extended Data Fig. 2).

a, Comparison of performance between the sliding window only (SW) and sliding window + set cover (SWSC) design strategies. Performance is measured as the ratio of the number of 30mer peptides required to cover all unique 9mers present in the target set of proteins (points above the horizontal dotted line indicate superior performance of the SWSC algorithm). Orange points represent results from simulated datasets with a fixed number of target protein sequences (3, 10 and 30) and variable average percent identity between targets (13–94%). Blue points represent results from datasets with variable numbers (1–100) of particular viral protein sequences downsampled randomly from the sequences present in UniProt. Across all of the analyzed datasets, the SWSC design strategy more efficiently covered the target protein set when each 9mer occurred in an average of at least ~1.75 target protein sequences. b, Performance of the SWSC algorithm when target protein sequences were clustered by using Uclust at different identity thresholds (50–95%). Each color represents a different target protein dataset (37,022–1,213,326 sequences in each) generated by downloading all available protein sequences from Uniprot for five different viral families (three RNA virus families (purple) and two DNA virus families (green)). The peptide library size at each cluster identity threshold was normalized by dividing by the number of peptides contained in the smallest design for the same set of target proteins. A percent cluster identity of between 65 and 75 resulted in the smallest number of peptides needed to cover all 9mers in the selected datasets. avg, average; Env, large envelope protein; Gag, group-specific antigen protein; HBV, hepatitis B virus; id, identity.
Selected peptides are then encoded as nucleotide sequences and flanked by conserved adapters. These sequences provide the instructions for in vitro peptide synthesis and serve as the barcodes by which each peptide is later identified (after amplification and sequencing) (Fig. 3 and Extended Data Fig. 1). There are two primary goals for selecting the nucleotide encodings of peptides across a library: (i) to ensure efficient translation and (ii) to achieve a relatively uniform distribution of each unique peptide in the final library. To achieve these goals, we consider the following criteria when choosing encodings: (i) codon usage frequency in Escherichia coli (https://github.com/LadnerLab/Library-Design/blob/master/scripts/oligo_encoding/codon_weights.csv), (ii) GC content and (iii) the past performance of encodings with similar characteristics. Targeting a GC content of 55% has worked well for us; however, consistency within a given library is probably more important than the absolute target used. Here, we step through our approach for encoding peptides with these goals in mind (Stage I). The final DNA sequences are then provided to a commercial provider for oligonucleotide library synthesis.

Generation of DNA-barcoded peptide (‘PepSeq’) libraries consists of the following 6 steps: 1) overlap extension PCR of a single- or double-stranded DNA library encoding the target peptides to create dsDNA templates for in vitro transcription, by using primers that anneal to flanking constant regions (dsDNA preparation, DDP); 2) in vitro transcription of dsDNA constructs to create mRNA (mRNA preparation, MRP); 3) self-splinting ligation of a puromycin-containing hairpin adapter oligonucleotide to the 3′ end of mRNA molecules (puromycin adapter ligation, PAL); 4) in vitro translation of each mRNA into its encoded peptide, and covalent intramolecular coupling of the C terminus of the translated peptide to the 3′ end of the mRNA via the puromycin molecule (peptide translatio and capture, PTC); 5) reverse transcription of the mRNA into cDNA, primed from the hairpin region of the adapter, followed by RNase digestion of the RNA strand, leaving the synthesized peptide attached to the cDNA construct (RNA to DNA conversion, RDC); and 6) tobacco etch virus (TEV) protease cleavage to remove constant-region amino acids from the N-terminal end of the peptide.
Synthesis of DNA-barcoded peptide libraries
The custom, commercially synthesized oligonucleotides described above serve as the starting material for synthesis of a DNA-barcoded peptide library. This synthesis process is performed completely in vitro and can be divided into six steps (Fig. 3). First, PCR is performed to amplify the oligonucleotides and attach necessary adapter sequences (Fig. 3, Step 1). The double-stranded DNA (dsDNA) products are then used as templates for in vitro transcription (Fig. 3, Step 2). After transcription, the mRNA products are ligated to a custom hairpin oligonucleotide adapter containing a puromycin molecule tethered to a PEG linker, which will serve as a substrate for ribosome-mediated intramolecular coupling between the peptide and RNA (Fig. 3, Step 3). After ligation, the product is used as a template for in vitro translation (Fig. 3, Step 4), which results in a mixture of mRNA, mRNA ligated to the adapter and mRNA ligated to the adapter and coupled to the translated peptide. These products are isolated from the translation reaction components by using capture onto streptavidin-bearing magnetic beads coated with a biotinylated DNA oligonucleotide that is complementary to a 30-nt sequence in the mRNA constant region (Extended Data Fig. 1 and Supplementary Table 1). The mRNA then undergoes reverse transcription, primed by the adapter hairpin, to generate cDNA, followed by RNase treatment to remove mRNA (Fig. 3, Step 5) and finally protease digestion to remove most of the constant region amino acids from the N-terminal ends of the peptides, resulting in the final DNA-barcoded peptides (Fig. 3, Step 6).
Highly multiplexed serology
One common application for PepSeq libraries is highly multiplexed serology—the characterization of antibody reactivity against a large number of antigens in a single assay (Fig. 1b). Here, we present the laboratory procedures as well as the bioinformatic pipelines needed to conduct highly multiplexed serological assays using PepSeq libraries.
Selective capture of antibody-bound DNA-barcoded peptides
The first step in this procedure involves the incubation of a PepSeq library with an antibody-containing sample, which occurs in solution. This allows members of the PepSeq library to interact with sample antibodies, and we recommend an incubation of 20–24 h to ensure optimal binding. The most common sample types used in these assays are liquid blood derivatives (i.e., serum or plasma), and because of the high concentrations of antibodies in these sample types, we recommend adding ≤0.5 µl per assay. However, when working with alternative sample types, it may be beneficial to add a larger sample volume. With the protocol presented here, up to 5 µl of sample can be added per assay without requiring modifications to the overall binding reaction volume. In addition to serum and plasma, we have successfully used PepSeq to assay antibody reactivities in whole blood, cerebrospinal fluid, bronchoalveolar lavage fluid, ascitic fluid and rehydrated dried blood spots (J. A. Altin and J. T. Ladner, unpublished data). Within any PepSeq experiment, it is also critical to include buffer-only negative controls. This is because antibody binding is detected through changes in the relative abundance of assay peptides. Buffer-only negative controls, which are void of any antibodies, can be used to estimate expected relative abundances while controlling for differences in starting abundance as well as non-specific binding to assay reagents. We also advise including positive controls, which may include previously characterized samples or monoclonal antibodies, when possible.
After incubation, the antibody-bound members of the PepSeq library are selectively enriched by using magnetic beads coated with capture protein. This enrichment results in an increase in the relative abundance of the DNA-barcoded peptides bound by sample antibodies, which can be detected quantitatively via high-throughput sequencing of the DNA tags. Importantly, the capture protein can be varied depending on the antibody subset of interest. In this protocol, we focus primarily on the capture of human IgG by using protein G–coated magnetic beads21. However, we also describe a general approach for substituting any biotinylated capture protein bound to streptavidin-coated magnetic beads. After a brief incubation of the capture beads with the pre-incubated sample with library, a series of washes are performed to remove DNA-barcoded peptides that are not attached to bead-bound antibodies, and the beads are then resuspended in water and heated to elute the remaining DNA-barcoded peptides. PCR amplification is then used to amplify the remaining DNA tags and to add the necessary adapters for high-throughput sequencing.
Sequencing and analysis
High-throughput sequencing is used to quantify the relative abundance of each peptide or probe in the eluate. Although this step could theoretically be adapted to work with any high-throughput sequencing platform, the protocol we present here is designed with an Illumina sequencer in mind. Generally speaking, there are three important considerations when choosing a sequencing platform. First, the reads generated must be long enough to reliably sequence a unique portion of the DNA tag for each probe in your design. For most designs, a 150-cycle Illumina sequencing kit will be sufficient, and many libraries can be encoded to support unique identification of all peptides by using a 75-cycle kit. Second, the error rate of your sequencing instrument must be low enough to allow most reads to be unambiguously mapped to the oligonucleotide from which it was derived. Third, the cost per read must be sufficiently low to enable the cost-effective collection of enough reads per sample, with this number being dependent on the complexity of the PepSeq library. Generally, we recommend ≥10 reads per peptide per assay to maximize sensitivity (Fig. 4a). However, as few as two to three reads per peptide is typically sufficient to minimize the number of false positive calls of enrichment (Fig. 4b).

a, Comparison of the ‘true positive’ rate at different sequencing depths (reads per peptide) with three different library sizes (244,000 (blue), 15,000 (red) and 2,500 (green) peptides). Three samples from each of the three libraries with >30 reads per peptide were randomly downsampled to the indicated number of reads per peptide, and the true positive rate was calculated as the proportion of the enriched peptides (Z score ≥ 10) from the largest dataset (30 reads per peptide, the ‘truth set’) that were also found to be enriched in the downsampled dataset. At ~10 reads per peptide, the true positive rate plateaus, and >90% of all ‘true’ enriched peptides are successfully identified in all three libraries. b, Comparison of the proportion of the total enriched peptides that are ‘false positives’ at different sequencing depths (reads per peptide) and using the same datasets described in a. False positives are peptides found to be enriched in the downsampled dataset but not in the largest truth set. Even with as few as three reads per peptide, we see a low proportion of false positives, and this proportion does not change much with an increase in sequencing depth. K, thousand.
The PepSeq eluate is prepared for Illumina sequencing by using a single PCR reaction that uses conserved priming sites to amplify the DNA tags and add adapters that contain the necessary sequencing primers and sample-specific barcode sequences. Our recommended primers also include a randomer to enhance sequence diversity during the initial Illumina sequencing cycles that are critical for cluster calibrations (Extended Data Fig. 1 and Supplementary Table 1). Although Illumina generally recommends a target cluster density of ~170–220, our studies have shown that a higher cluster density of ~250–325 is optimal to obtain the maximal number of usable reads for PepSeq (Extended Data Fig. 3). This is probably because our reference set of DNA tags is fully defined, and therefore mismatches are well tolerated. In addition, most of the low-quality base calls occur within the primer regions that are conserved across all DNA tags but are not required for sample or peptide assignments.
The raw high-throughput sequencing data are then used to quantify peptide-level enrichment. This includes three main steps: (i) demultiplexing the data and assigning reads to peptides, (ii) calculating enrichment Z scores for each peptide and (iii) identifying enriched peptides for each sample on the basis of the consistency of Z scores across replicates (Extended Data Fig. 2). We have developed an open source software package called PepSIRF22 (https://github.com/LadnerLab/PepSIRF) that can be used to conduct each of these analysis steps by using a personal computer or high-performance cluster. Only step 1 (demultiplexing) is computationally intensive. PepSIRF is also available as a set of plug-ins (https://ladnerlab.github.io/pepsirf-q2-plugin-docs/) for QIIME 2 (https://qiime2.org/), which is a popular bioinformatics software platform23. These plug-ins allow users to run PepSIRF from within QIIME 2 and provide additional support for automation, visualization and provenance tracking24.
Demultiplexing and assignment of reads to peptides is completed by using the demux module of PepSIRF22. This includes searching for matches to one or more index sequences (demultiplexing) as well as a match to one of the expected DNA tags. Typically, we allow for enough mismatches to cover ~5–10% of the relevant region, for example, up to one mismatch within each of the index sequences (typically 8–12 nt in length) and up to two to three mismatches within the sequenced portion of the DNA tag (commonly ~40–90 nt in length). Before additional processing, the raw read counts from each sample are then normalized to reads per million (RPM) by using the ‘col_sum’ normalization method in the norm module of PepSIRF. This controls for differences in the depth of sequencing between samples.
To quantify peptide-level enrichment (i.e., antibody binding), we calculate Z scores by using the zscore PepSIRF module. These Z scores are calculated by using a method adapted from ref. 11 and correspond to the number of standard deviations away from the mean normalized read count, with the mean and standard deviation calculated independently for groups of peptides with similar expected relative abundances (‘bins’). Expected abundance for each peptide is estimated by using the average RPM from a set of buffer-only negative controls (at least eight independent controls are recommended), and bins are generated by using the bin PepSIRF module. It is important that the mean and standard deviation used in the Z score calculations reflect the distribution of unenriched peptides within a bin. To exclude outliers (i.e., peptides that have been enriched through interaction with antibodies), these calculations are based only on the X% highest density interval of read counts within each bin, with the value of X varying depending on the assay design and application; for assays with a high proportion of expected enriched peptides, a lower X will be needed to exclude all truly enriched peptides from the calculations of mean and standard deviation. Before Z score calculation, we also recommend a second normalization step (the ‘diff’ method in the norm module of PepSIRF), which involves subtraction of the average RPM count observed within a collection of buffer-only negative controls. This second normalization step helps control for variability in expected peptide abundance within a bin.
Finally, the enrich module of PepSIRF is used to determine which peptides have been enriched through interaction with the captured antibodies. This module identifies peptides that meet or exceed minimum thresholds in Z score and, if desired, other metrics such as RPM or fold change. This module can accommodate any number of replicates (two are recommended for most applications), as well as mixed thresholds (i.e., a higher threshold that must be met by at least one replicate along with a lower threshold that must be met by all replicates). To assist in the determination of appropriate thresholds for a particular dataset, we have created a Qiime2 plug-in to visualize the distributions of peptides considered to be enriched across a range of thresholds (Fig. 5). We also recommend assaying and analyzing at least two buffer-only negative controls that are not considered in the generation of bins or read count normalization procedures. These will allow for estimation of the false discovery rate. Appropriate thresholds are likely to vary depending on the assay, Z score calculation approach, number of peptides analyzed, tolerance for false positives or negatives and/or sequencing depth. However, in our experience, a Z score threshold of ~10 is often appropriate for minimizing false positives.

Density scatterplot comparing normalized read counts for each peptide from buffer-only negative control samples (x-axis) and a representative serum sample (y-axis) assayed with a PepSeq library containing 15,000 peptides. Colored dots indicate peptides enriched at the indicated Z score thresholds. This plot was created with Qiime2 by using the plug-in found at https://github.com/LadnerLab/q2-ps-plot.
Materials
Biological materials
-
Human serum samples
Caution
Wear one-time-use mask and surgical gloves while handling human serum samples. Dispose of protective equipment after a single use. Include appropriate personal protective equipment based on risk assessment of samples. All experiments involving human samples must conform to the relevant institutional and national regulations, and informed consent has to be obtained from the involved individuals.
Reagents
Critical
Prepare and store all reagents at −20 °C unless otherwise indicated.
dsDNA preparation (DDP) specific reagents
-
DNA amplification primer (forward): GCGAATTAATACGACTCACTATAGGGCTTAAGTATAAGGAGGAAAAAATATGGGAGAAAACCTATACTTCCAAGGCGCA (Integrated DNA Technologies, cat. no. custom)
-
DNA amplification primer (reverse): 5′mAmGCTCCTGCTGCATTTCCGTTCAGCAGACGCAGCAGCCAAGACAGAGAGTCACC (Integrated DNA Technologies, cat. no. custom)
-
Commercially synthesized, peptide-encoding oligonucleotides (e.g., Agilent, cat. no. custom)
-
Deoxynucleotide (dNTP) solution mix (New England Biolabs, cat. no. N0447L)
-
Q5 reaction buffer pack (New England Biolabs, cat. no. B9027S)
-
Q5 high-fidelity DNA polymerase (New England Biolabs, cat. no. M0491L)
mRNA preparation (MRP) specific reagents
-
Ampliscribe T7-Flash transcription kit (Lucigen, cat. no. ASF3507)
Puromycin adapter ligation (PAL) specific reagents
-
T4 RNA ligase reaction buffer (New England Biolabs, cat. no. B0216L)
-
Puromycin adapter (store at −80 °C; custom chemistry service—e.g., City of Hope Core Facility DNA Synthesis Laboratory; see Supplementary Information)
Critical
This is a custom oligonucleotide molecule whose structure and sourcing options are described in the Supplementary Information.
-
RNase inhibitor, murine (New England Biolabs, cat. no. M0314L)
-
T4 RNA ligase 2 (New England Biolabs, cat. no. M0239S)
Peptide translation and capture (PTC) specific reagents
-
PURExpress in vitro protein synthesis kit (store at −80 °C; New England Biolabs, cat. no. E6800L)
Critical
Construct sequences and peptide-encoding algorithm have been designed for performance with this translation system.
-
DYNAL MyOne Dynabeads Streptavidin T1 (store at 4 °C; Thermo Fisher Scientific, cat. no. 65604D)
-
Biotinylated oligonucleotide for bead purification: 5′Biosg TTTTTCATATTTTTTCCTCCTTATACTTAAGCCC 3′ (Integrated DNA Technologies, cat. no. custom)
RNA to DNA conversion (RDC) specific reagents
-
ProtoScript II reverse transcriptase (New England Biolabs, cat. no. M0368X)
-
RNase H (New England Biolabs, cat. no. M02971)
-
Protease inhibitor cocktail (VWR, cat. no. G6521)
-
RNase Inhibitor, Murine (New England Biolabs, cat. No M0314L)
-
10mM dNTP Mix (New England Biolabs, cat. no N0447S)
-
RNase Cocktail (ThermoFisher, cat. no AM2286)
Site-specific peptide cleavage with tobacco etch virus (TEV) protease specific reagents
-
AcTEV protease (Thermo Fisher Scientific, cat. no. 12575015)
-
TEV oligonucleotide standard: 5′ GGGCTTAAGTATAAGGAGGAAAAAATATGGGAGAAAACCTATACTTCCAAGGCGCAGGTGACTCTCTGTCTTGGCTGCTGCGTCTGCTGAACGGAAATGCAGCAGGAGCTGGGCTTAAGTATAAGGAGGAAAAAATATGGGTATGGCATACCG 3′ (IDT, cat. no. custom)
Common reagents
-
5 M ammonium acetate, RNase-free (store at room temperature (RT), 20–25 °C; Thermo Fisher, cat. no. AM9070G)
-
Ethyl alcohol (EtOH), pure (store at RT; Sigma, cat. no. E7023)
Caution
EtOH is highly flammable. Store and handle away from open flame.
-
TE buffer (store at RT; Thermo Fisher, cat. no. 12090015)
-
Potassium acetate (3 M), pH 5.5, RNase-free (store at RT; Thermo Fisher, cat. no. AM9610)
-
UltraPure 0.5 M EDTA, pH 8.0 (store at RT; Thermo Fisher, cat. no. 15575020)
Caution
EDTA is toxic if swallowed. Wear personal protective equipment when handling.
-
Dynabeads Protein G for immunoprecipitation (store at 4 °C; Thermo Fisher Scientific, cat. no. 10004D)
-
AMPure XP, 60 ml (store at 4 °C; Beckman Coulter, cat. no. A63881)
-
Rabbit anti-human IgA1/IgA2 recombinant antibody (store at 4°C; Thermo Fisher Scientific, cat. no. MA5-27919)
-
Novex TBE-urea gels, 6%, 15 wells (store at 4 °C; Thermo Fisher, cat. no. EC68655BOX)
-
Qubit dsDNA quantitation, broad range (store at 4 °C; Thermo Fisher, cat. no. Q32850)
-
Orange DNA loading dye (6×) (Thermo Fisher, cat. no. R0631)
-
Qubit RNA quantitation, broad range (store at 4 °C; Thermo Fisher, cat. no. Q10210)
-
Novex TBE-urea gels, 10%, 12 wells (store at 4 °C; Thermo Fisher, cat. no. EC68752BOX)
-
High Sensitivity D1000 ScreenTape (store at 4 °C; Agilent, cat. no. 5067-5584)
-
High Sensitivity D1000 reagents (store at 4 °C; Agilent, cat. no. 5067-5585)
-
D1000 ScreenTape (store at 4 °C; Agilent, cat. no. 5067-5582)
-
D1000 ScreenTape reagents (store at 4 °C; Agilent, cat. no. 5067-5583)
-
High Sensitivity RNA ScreenTape (store at 4 °C; Agilent, cat. no. 5067-5579)
-
High Sensitivity RNA ScreenTape sample buffer (store at 4 °C; Agilent, cat. no. 5067-5580)
-
RNA ScreenTape (store at 4 °C; Agilent, cat. no. 5067-5576)
-
RNA ScreenTape sample buffer (store at 4 °C; Agilent, cat. no. 5067-5577)
-
Saline sodium citrate buffer (SSC) (20×), RNase-free (store at RT; Thermo Fisher, cat. no. AM9770)
-
1 M Tris-HCl, pH 8.5 (store at RT; VWR, cat. no. 76236-402)
-
Tween 20 (store at 4 °C; Sigma-Aldrich, cat. no. P1379)
-
UltraPure DNase/RNase-free distilled water (store at RT; Thermo Fisher, cat. no. 10977023)
-
UltraPure TBE buffer, 10× (dilute down to 1×) (store at RT; Thermo Fisher, cat. no. 15581-044)
-
PhiX Control v3 (Illumina, cat. no. FC-110-3001)
-
NextSeq 500/500 mid output kit v2.5 (150 cycle) (Illumina, cat. no. 20024904)
-
NextSeq 500/500 high output kit v2.5 (75 cycle) (Illumina, cat. no. 20024906)
-
SYBR Gold Nucleic Acid Gel Stain (ThermoFisher, cat no S11494)
-
Pierce 20X PBS Tween-20 (ThermoFisher, cat. No 28352)
-
SuperBlock T20 (PBS) Blocking Buffer (ThermoFisher, cat. no 37516)
Equipment
-
SimpliAmp thermal cycler (Thermo Fisher, cat. no. A24811)
-
XCell SureLock mini cell (Thermo Fisher, cat. no. EI0001)
-
Qubit Flex Fluorometric (Thermo Fisher, cat. no. Q33327)
-
NanoDrop One/One Microvolume UV-Vis spectrophotometer (Thermo Fisher, cat. no. ND-ONEC-W)
-
Galaxy mini centrifuge (VWR, cat. no. 76269-064)
-
Corning LSE vortex mixers (VWR, cat. no. 89133-512)
-
DynaMag 96 side magnet (Thermo Fisher, cat. no. 12331D)
-
DynaMag-2 magnet (Thermo Fisher, cat. no. 12321D)
-
Hand-held magnetic bead extractor, MagPin M 96 (V&P Scientific, cat. no. VP 407AM-N1)
-
Digital dual heat block (VWR, cat. no. 13259-052)
-
Centrifuge 5430 R - high-speed centrifuge (Eppendorf, cat. no. 022620625)
-
Microcon-10kDa centrifugal filter unit with Ultracel-10 membrane (Millipore Sigma, cat. no. MRCPRT010)
-
Ultrafree-MC GV centrifugal filter, 0.22 µm hydrophilic PVDF (Millipore Sigma, cat. no. UFC30GV0S)
-
VWR −86 °C ultra low temperature freezer with racks (VWR, cat. no. 76318-808)
-
−20 °C freezer
-
4 °C refrigerator
-
1.5-ml LoBind DNA/RNA microcentrifuge tubes, Eppendorf (VWR, cat. no. 80077-230)
-
2.0-ml LoBind DNA/RNA microcentrifuge tubes, Eppendorf (VWR, cat. no. 80077-234)
-
1.5-ml LoBind protein microcentrifuge tubes, Eppendorf (VWR, cat. no. 80077-232)
-
2.0-ml LoBind protein microcentrifuge tubes, Eppendorf (VWR, cat. no. 80077-226
-
50-ml DNA LoBind tubes, Eppendorf (VWR, cat. no. 75874-298)
-
PCR strip tubes of eight (USA Scientific, cat. no. 10402-3700)
-
4200 Tapestation system (Agilent, cat. no. G2991BA)
Software
-
Python 3
-
Library-Design (https://github.com/LadnerLab/Library-Design)
-
PepSIRF (https://github.com/LadnerLab/PepSIRF)
-
(Optional) High-performance computing cluster with job scheduler such as SLURM
Reagent setup
2× Dynabead magnetic bead wash buffer
Combine 5 ml of 1 M Tris-HCl, 1 ml of 0.5 M EDTA, 200 ml of 5 M NaCl and 294 ml of ultrapure water. Store at RT for ≤1 month.
Tris-Tween buffer
Combine 49.48 ml of ultrapure water, 500 µl of 10 mM Tris HCl and 25 µl of 0.05% (vol/vol) Tween. Store at RT for ≤1 month.
Sybr Gold dye
Combine 4 µl of Sybr Gold and 40 ml of 1× TBE buffer. Store at 4 °C for ≤1 week.
Equipment setup
Humidity chamber
Drench four to six paper towels in deionized water and place them into a 96-well plate-sized sealable bag.
Procedure
Stage I: oligonucleotide library design
Timing ~2 h–2 d, once target proteins have been selected
Critical
The oligonucleotide design process will vary depending on experimental needs. Here, we describe a general procedure for designing peptides that efficiently cover potential linear epitopes within a set of target protein sequences. When relevant, examples of software that we have used for each step are listed within parentheses. For detailed usage information for the individual software packages, please follow the provided links.
-
1
Generate a fasta-formatted file containing your target proteins of interest. Protein sequences can be downloaded from many sources, including Uniprot and NCBI.
-
2
(Optional) Remove identical protein sequences, including those that are a subset of another target (https://github.com/LadnerLab/Library-Design/tree/master/one_hundred_reps).
-
3
Generate clusters of similar sequences (UCLUST (https://drive5.com/usearch/manual/uclust_algo.html) and CD-HIT (http://weizhong-lab.ucsd.edu/cd-hit/)). We recommend targeting a cluster similarity of 65–75% (Fig. 2b).
-
4
For each cluster, use a combined sliding-window/set-cover algorithm to design peptides. To ensure complete coverage of all epitopes in the sliding-window design, the ideal step size will be as follows: window size − number of amino acids (aa) in target epitope + 1 (SW_SC (https://github.com/LadnerLab/Library-Design/tree/master/SW_SC)). The optimal target epitope size will vary between projects, and both biological (e.g., the typical footprint of linear epitopes) and technical (e.g., larger target epitopes will require more peptides) factors should be considered.
-
5
Generate nucleotide encodings for all designed peptides (oligo_encoding (https://github.com/LadnerLab/Library-Design/tree/master/oligo_encoding)—Part 1: oligo_encoding; Part 2: oligo_encoding.py). The first part of oligo_encoding creates a user-defined number of possible encodings for each peptide, and then the top n encodings are selected depending on the user-specified target GC content. In Part 2, the top encodings are input into a deep learning model to score and select the top n encodings on the basis of 88 features and trained by using relative peptide abundances observed within PepSeq libraries (64 codons, 4 nucleotides and 20 aa).
Critical step
Ensuring that the sequenced section of the variable peptide coding region is unique for each DNA oligo is important. Depending on the sequencing kit used, you may need to manually select an alternate encoding for some peptides. For example, when using a 75-cycle sequencing kit, it is important to check whether the first 40 nt of the encodings are unique for all constructs [qcOligos].
-
6
Add 19-nt constant regions to the 3′ and 5′ ends of the encoded sequences (Fig. 3 and Extended Data Fig. 1). If using our oligo_encoding software (https://github.com/LadnerLab/Library-Design/tree/master/oligo_encoding), these sequences will automatically be added to the selected encodings.
-
7
Synthesize the DNA encodings, for example, by using a commercial provider.
Stage II: PepSeq library synthesis
DDP
Timing ~1 h
-
8
Dilute the manufactured oligonucleotide pool to a final concentration of 3.13 nM in water.
Critical step
Our standard reaction conditions, as exemplified in this protocol, typically produce enough library for ≥3000 antibody binding assays. However, the user can scale reaction volumes up or down according to the desired number of final reactions.
-
9
Prepare the PCR reaction mixture as follows:
Component
Stock concentration
Reaction volume (µl)
Ultrapure water
–
495
5× Q5 high-fidelity buffer
5×
200
10 mM dNTP mix
10 mM each
20
Forward & reverse DDP primer mix
5 µM each
75
Q5 high-fidelity DNA polymerase
2 U/µl
10
Diluted oligo pool
3.13 nM
200
Total
–
1,000
-
10
Aliquot the reaction mixture into LoBind PCR strips, 50 µl per well.
-
11
Run the reaction mixture in a thermocycler under the following conditions:
Temperature (°C)
Time
No. of cycles
98
30 s
1
98
10 s
5
55
30 s
72
30 s
98
10 s
10
72
30 s
72
5 min
1
4
∞
–
Critical step
The PCR conditions are designed for oligonucleotide libraries that encode peptides ≤30 aa in length. For oligonucleotide libraries encoding longer peptides, we recommend increasing the second stage of the PCR from 5 cycles to 10 cycles to compensate for reduced amplification efficiency.
Pause point
The resulting dsDNA library aliquots should be pooled and can be stored in a DNA LoBind tube at −20 °C for ≤1 year or until proceeding to the MRP step.
MRP
Timing ~3 h of active time and 20 h of incubation time
-
12
Turn a heat block on to 37 °C and thaw reagents on ice.
-
13
Prepare the reaction mixture in five 1.5-ml DNA LoBind tubes as follows:
Component
Stock concentration
Final concentration in reaction
Reaction volumea (total/per tube) (µl)
DDP product
>50 ng/µl
>15.75 ng/µl
945/189
AmpliScribe T7-Flash 10× reaction buffer
10×
1×
300/60
25 mM NTP mix
25 mM each (after combining 1:1:1:1)
9 mM each
1,080/216
100 mM DTT
100 mM
10 mM
300/60
RoboGuard RNase inhibitor
40 U/µl
1 U/µl
75/15
AmpliScribe T7-Flash RNA polymerase
10×
1×
300/60
Total
–
–
3,000/600
Critical step
These reagents must be added in the order they appear in the table.
Critical step
RNA pellets will fail to form if the reaction is performed in tubes larger than 1.5 ml.
-
14
Incubate the reaction mixture at 37 °C for 18–20 h. Exceeding the 20-h incubation period may result in evaporation and diminished quality of the product.
-
15
1–2 h before completion of the incubation, cool aliquots of 5 M ammonium acetate and 80% (vol/vol) EtOH on ice. Cool a centrifuge to 4 °C and heat 1× TE buffer in a 37 °C incubator.
-
16
Upon completion of the incubation, add 1/20 total reaction volume of Ampliscribe RNase-free DNase I to the transcription reaction (step 14) and incubate at 37 °C for 30 min. For the reaction volume exemplified in this protocol (step 13), 150 µl of Ampliscribe RNase-free DNase I should be divided equally into each DNA LoBind tube containing the transcription reaction (30 µl per tube).
-
17
Add an equal volume (reaction volume including DNase I) of ice-cold 5 M ammonium acetate and vortex for 15 s. Then, incubate on ice for a minimum of 15 min. For the reaction volume exemplified in this protocol, 3,150 µl of 5 M ammonium acetate should be divided equally into each LoBind tube (630 µl per tube).
-
18
Spin the reaction mixture at maximum g at 4 °C for 15 min to allow the precipitate to form.
-
19
Remove and discard the supernatant with a pipette, add an equal volume (as ammonium acetate) of ice-cold 80% (vol/vol) EtOH to the pellet and vortex for 15 s.
-
20
Spin the reaction mixture at maximum g at 4 °C for 15 min to further precipitate the product.
-
21
Remove and discard all remaining EtOH with a pipette.
Critical step
It is crucial to remove all remaining EtOH. After removing excess EtOH, we recommend quickly spinning the tube in a microcentrifuge and removing residual EtOH with a 10-µl pipette.
-
22
Dry the pellet(s) on the bench surface with the top open for 15 min at RT.
Critical step
Ensuring that the pellet is thoroughly dry before proceeding is important. If after 15 min the pellet appears glossy, it is acceptable to extend the drying time.
-
23
Using 50 µl of 37 °C TE buffer, dissolve the mRNA pellet(s). If a precipitate is still visible upon centrifugation, it is acceptable to add additional warm TE buffer as necessary. However, do not exceed the initial reaction volume (Step 13; 600 µl per tube). The pellet(s) may be gently heated at 37 °C if needed to completely solubilize the pellet(s). Combine the solubilized products from the five individual reaction tubes.
-
24
Quantify a 1:100 dilution of the MRP product by using Qubit Broad Range RNA quantification according to the manufacturer’s instructions. A yield of >300 ng/µl should be expected for the 1:100 dilution of MRP. The MRP product should also be visualized by using Broad Range RNA ScreenTape for Tapestation according to the manufacturer’s instructions, or equivalent electronic electrophoresis equipment. If electronic electrophoresis equipment is unavailable, 1 µl of diluted MRP product can be visualized by 10% TBE-urea gel electrophoresis according to the manufacturer’s instructions. The presence of a broad singular band (Fig. 6) indicates successful in vitro transcription.
Fig. 6: Gel images showing expected products from Stage II of the protocol. 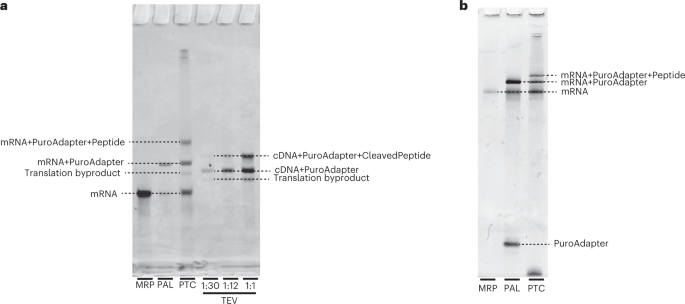
Abbreviations are as in Fig. 3. a, An example final gel image including the products of the MRP, PAL, PTC and TEV reactions from the production of a 30-aa library. The MRP product appears as a single band of mRNA. The PAL reaction material appears as two bands, an upper band for the adapter-ligated mRNA (mRNA+PuroAdapter) and a lower band of unligated mRNA (MRP product). The PTC reaction material runs as three dominant bands: the upper band is the adapter-ligated mRNA with the translated peptide attached (mRNA+PuroAdapter+Peptide), the middle band is the adapter-ligated mRNA (with no peptide) and the lower band is unligated mRNA. As a result of RNase treatment, the unligated mRNA product is not observed after the TEV reaction, but the puromycin-ligated cDNA and puromycin-ligated cDNA bound to peptide are both present. The faint band seen between the mRNA and mRNA+PuroAdapter in the PTC and below the cDNA+PuroAdapter band in the TEV lanes is a byproduct formed during in vitro translation. This is a 6% TBU gel run for 45 min in heated 1× TBE buffer. b, An example image of a quality-control gel run during the production of a 30-aa library. The single lower band in the PAL reaction material is the unligated puromycin adapter (PuroAdapter). It is also common to see a band near the bottom of the gel in the PTC lane, which is probably the capture oligo. This is a 10% TBU gel run for 75 min in unheated 1× TBE buffer.
Pause point
The MRP product can be stored at −80 °C for ≤1 year or until proceeding to PAL.

PAL
Timing ~3.5 h of active time and 20 h of incubation time
Critical
The puromycin adapter used in this protocol is not commercially available. See Supplementary Information for the synthesis protocol.
Critical
The PAL reaction volumes exemplified in this protocol may produce more product than will be needed for PTC (Steps 35–73). Any extra PAL product can be stored for future use.
-
25
Prepare the reaction mixture as follows:
Component
Stock concentration
Final concentration in reaction
Reaction volume (µl)
Ultrapure water
–
–
1,430 − Y
10× T4 RNA ligase 2 buffer
10×
1×
200
MRP product
Variable depending on MRP concentration (measured in Step 24)
50–100 µM
Y
Puromycin adapter
1,000 µM
110 µM
220
RNase inhibitor, murine
40 U/µl
1 U/µl
50
T4 RNA ligase 2
10 U/µl
0.5 U/µl
100
Total
–
–
2,000
-
26
Aliquot the reaction mixture into PCR strip tube(s), 100 µl per well.
-
27
Perform thermocycling as follows:
Temperature (°C)
Time
No. of cycles
37
15 min
1
60
10 s
4
55
10 s
50
10 s
45
10 s
40
10 s
37
15 min
37
16–20 h
1
-
28
Quantify a 1:100 dilution of the ligated product by using a broad-range RNA ScreenTape for Tapestation according to the manufacturer’s instructions, or equivalent electronic electrophoresis equipment. If electronic electrophoresis equipment is unavailable, 1 µl of diluted ligated product can be visualized by 10% TBE-urea gel electrophoresis according to the manufacturer’s instructions. The presence of two bands is expected, with the top band representing the mRNA with the ligated adapter and the bottom band representing the unligated mRNA product (Fig. 6). The user should expect a 40–70% adapter ligation efficiency. If <40% efficiency is observed, ligation is considered to have failed, and the user should repeat the reaction (Steps 25–27).
Pause point
The ligated library can be stored at −80 °C for ≤2 months or until proceeding to filter concentration and buffer exchange.
-
29
The ligated products should be filtered and buffer-exchanged by using Millipore 10-kDa-cutoff filter columns and collection tubes. We recommend one filter column per 600 ul of ligated product to reduce filter time. Add 450 µl of product to filter columns and centrifuge for 45 min at 12,000g at 4 °C.
Critical step
It is important to never centrifuge all of the ligated mRNA products through the column. After the initial 45-min filtration, each subsequent filtration should be checked at 20-min intervals to ensure that the product has not completely filtered through the column.
-
30
Remove and discard the filtrate. Add additional ligated product, as necessary, to the filter column and centrifuge for 45 min at 12,000g at 4 °C. Repeat this step until all of the remaining ligated product is loaded onto the filter column with ~100 µl of the product remaining on the surface of the filter.
-
31
Add ~300 µl of water and centrifuge for 45 min at 12,000g at 4 °C. Remove and discard the filtrate and repeat this step two additional times to ensure proper buffer exchange of the ligated product.
Critical step
It is important to never exceed the maximum volume capacity of the filters. It is acceptable to add <300 µl of water to prevent overfilling.
-
32
Remove and discard the filtrate and continue centrifuging for 20–40 min until there is <40 µl of ligated product on the surface of the filter. If multiple filter columns are being used, each ligated product should be filtered until a collective total of <40 µl of product is remaining among the filter columns. The user also has the option to pipette the products off of the surface of the filter and combine them onto one filter column and proceed with filtration.
Critical step
We have found that filtering the ligated product below 40 µl yields the necessary concentration that produces greater efficiency with peptide translation and subsequent capture.
-
33
With <40 µl remaining on the surface of the filter, flip the filter and place it into a clean filtration tube and spin at 2,000g at 4 °C for 2 min. Collect the filtrate (PAL product) into 1.5- or 2-ml DNA LoBind tube(s).
-
34
Quantify an aliquot of the PAL product by using Nanodrop RNA quantification according to the manufacturer’s instructions. Record the A260, A280 and the concentration (nanograms per microliter). Use the Beer-Lambert law to calculate the final concentration (micromolar) of the PAL product. The user should expect a yield of ≥60 µM to successfully continue with library synthesis.
Pause point
The concentrated library can be stored at −80 °C for ≤1 year or until proceeding to PTC.
PTC
Timing ~20 min of active time and 2.5 h of incubation time
-
35
Set a heat block to 37 °C and thaw reagents on ice.
-
36
Prepare the reaction mixture as follows and divide it equally among five 1.5- or 2-ml Protein LoBind tube(s):
Component
Stock concentration
Final concentration in reaction
Reaction volumea (total/per tube) (µl)
PURExpress Component A
2.5×
1×
2,800/560
PURExpress Component B
3.3×
1×
2,100/420
RNase inhibitor, murine
40 U/µl
1.6 U/µl
280/56
PAL product
Variable depending on PAL concentration (measured in Step 34)
2.0 µM
Y
Ultrapure water
–
Variable
1,820 − Y
Total
–
–
7,000/1,400
Critical step
These reagents must be added in the order they appear in the table. Mix the reaction gently by pipetting up and down.
-
37
Incubate the reaction mixture at 37 °C for 30 min.
-
38
Incubate on ice for 40 min.
-
39
Add 1/5 total reaction volume of 3 M potassium acetate to the translation reaction and incubate at RT for 60 min. For the reaction volumes exemplified in this protocol, 1,400 µl of 3 M potassium acetate should be divided equally into each Protein LoBind tube containing the reaction (280 µl per tube).
-
40
Add an equal volume (280 µl per tube) of 100 mM EDTA pH 8 and incubate at RT for 15 min.
Pause point
The translated product can be stored at −80 °C for ≤2 months or until proceeding to the capture step.
Streptavidin bead preparation
Timing ~2 h of active time and 15 min of incubation time
-
41
Resuspend Dynabead MyOne streptavidin magnetic beads by gentle vortexing for 30 s–1 min. Transfer the desired volume of beads to DNA LoBind tube(s). For the reaction volume exemplified in this protocol, 14,250 µl of unbound beads should be prepared in a 50-ml tube to produce 31,200 µl of biotinylated bound beads.
-
42
Place the tube(s) on an appropriate magnet and allow the beads to collect. Remove as much supernatant as possible without aspirating the beads.
-
43
Wash the beads three times with 1× Dynabead wash buffer. For the bead volume exemplified in this protocol, add 30 ml of 1× Dynabead wash buffer.
-
44
Immediately resuspend the beads in the original bead volume (14,250 µl) of 1× Dynabead wash buffer. Place the tube(s) on the magnet and allow the beads to collect. Remove and discard the supernatant.
-
45
Immediately resuspend the magnetic beads in two times the original bead volume (28,500 µl) with 2× Dynabead wash buffer.
Critical step
If preparing >10,000 µl of beads, split beads equally into two tubes after resuspension in 2× Dynabead wash buffer.
-
46
Prepare enough diluted biotinylated DNA mixture for the desired final bead quantity. For the reaction volume exemplified in this protocol, dilute 427.5 µl of 1 nmol/µl biotinylated oligonucleotide into 28,072 µl of ultrapure water. Add 14,250 µl of dilution mixture to each tube containing 14,250 µl of washed beads.
Critical step
We advise coating Dynabeads MyOne streptavidin T1 magnetic beads with an amount of diluted biotinylated DNA that is threefold the binding capacity of the magnetic beads. We have found that tripling the biotinylated DNA has significantly increased library capture efficiency. However, increasing the input more than three times has shown no dramatic improvements to binding performance.
-
47
Incubate for 15 min at RT by using end-over-end rotation. You may extend incubation time to a maximum of 2 h, if desired.
-
48
Upon completion of the incubation, place the oligonucleotide-bound beads on a magnet and allow the beads to collect. Remove as much supernatant as possible without aspirating the beads.
-
49
Wash the beads three times with 1× Dynabead wash buffer. For the first wash, add 20 ml of 1× wash buffer to each tube and recombine the two tubes into one. For the next two washes, use 30 ml of 1× wash buffer.
-
50
Immediately resuspend the oligonucleotide-bound magnetic beads in the required bead volume (31,200 µl) with 1× SSC.
Pause point
The final oligonucleotide-bound beads can be stored at 4 °C for ≤2 weeks or until proceeding to the capture step.
Capture of translation product
Timing ~5 h of active time
-
51
Set the incubator to 37 °C and thaw reagents on ice. Incubate one 50-ml aliquot of ultrapure water on ice and one 50-ml aliquot in the incubator.
-
52
Using a pipette, gently resuspend the oligonucleotide-bound beads from Step 50 (31,200 µl).
-
53
Place tube(s) on an appropriate magnet and allow the beads to collect. Remove as much supernatant as possible without aspirating the beads.
-
54
Wash beads three times in 30 ml of 1× SSC.
-
55
Immediately resuspend the beads in the original bead volume (31,200 µl) with 1× SSC.
Critical step
Capture must be performed in 2-ml LoBind tube(s). Larger tubes will result in decreased binding efficiency and significant product loss during the filtration step. Capture can occur over several days to reduce the number of tubes being handled during the first and second capture steps.
-
56
First capture (Steps 56–65). Distribute a 245-µl aliquot of the translated product (from Step 40) to each 2-ml Protein LoBind tube. For the reaction volume exemplified in this protocol, forty 2-ml LoBind tubes will be required.
-
57
Add 245 µl of 2× SSC to each Protein LoBind tube.
-
58
Add 780 µl of oligonucleotide-bound beads (from Step 55) to each Protein LoBind tube.
-
59
Incubate the translated product with beads on end-over-end rotation for 30 min at RT. You may extend the incubation time up to 2 h, if desired.
-
60
Place the tube(s) on an appropriate magnet and allow the beads to collect. Collect the supernatant in new Protein LoBind tube(s) and store on ice.
Critical step
Do not discard the supernatant, because it will be used for the second round of capture.
-
61
Wash the magnetic beads in each tube three times with 1,000 µl of 1× SSC.
-
62
Immediately resuspend the magnetic beads with 1,000 µl of ice-cold ultrapure water. Resuspend the beads by light vortexing for ~30 s. Place the tube(s) on the magnet and allow the beads to collect. Remove and discard the supernatant.
-
63
Resuspend the beads in 175 µl of 37 °C ultrapure water per tube. Incubate the reaction on a 37 °C heat block for 5 min.
-
64
Place the tube(s) on an appropriate magnet and allow the beads to collect. Collect the supernatant in new Protein LoBind tube(s) and store on ice.
Critical step
Do not discard the supernatant; this is your final captured product.
-
65
Repeat Steps 63 and 64 twice more for a total of three elutions. Collect all three elutions in a single Protein LoBind tube.
Critical step
Do not discard the beads, because they will be used for the second round of capture.
-
66
Second capture (Steps 66–73). Distribute an ~1,270-µl aliquot of the supernatant (collected in Step 60) to each 2-ml Protein LoBind tube containing beads (remaining from Step 65). Incubate with end-over-end rotation for 30 min at RT. You may extend the incubation time up to 2 h, if desired.
-
67
Place the tube(s) on an appropriate magnet and allow the beads to collect. Collect supernatant(s) in newProtein LoBind tube(s).
Critical step
These eluates can be stored at −80 °C for ≤1 year and can be used for repeated capture if the final product concentration from Step 73 is lower than desired.
-
68
Repeat Steps 61–65. Collected supernatants can be combined with supernatants collected during the first capture.
-
69
Distribute aliquots of the supernatants collected during the first and second captures into forty 0.22-µm Hydrophilic Ultrafree-MC GV centrifugal filters and centrifuge at 12,000g at RT for 2 min. Transfer the flow-through to a new Protein LoBind tube. Repeat this step until all of the supernatant has been filtered through.
Pause point
The filtered product can be stored at −80 °C for ≤1 year or until proceeding to product concentration (Step 70).
-
70
Cool the centrifuge to 4 °C. Distribute a 450-µl aliquot of the supernatant product (collected in Step 69) into 40 Millipore 10-kDa-cutoff filter columns with collection tubes. Centrifuge for 40 min at 12,000g at 4 °C. Remove and discard the flowthrough and add additional product (~300 µl) to the filter column and repeat this step until all of the remaining product is loaded onto the filter column.
Critical step
It is important to never centrifuge all of the product through the column. After the initial 45-min filtration, each subsequent filtration should be checked at 20-min intervals to ensure that the product has not completely filtered through the column.
-
71
Concentrate the product until a volume of ~0.96× the original PTC reaction volume (from Step 36) remains on the surface of the filter. For the reaction volume exemplified in this protocol, the final products should have a collective volume slightly less than 6,720 µl remaining among the filter columns (~168 µl per column).
-
72
Flip the filter and place it into a clean collection tube and spin at 2,000g at 4 °C for 2 min. Collect the filtrate into 1.5- or 2-ml Protein LoBind tube(s).
Critical step
If the volume of the final PTC product is less than desired (0.96× the original PTC reaction volume), the product can be adjusted with ultrapure water.
-
73
Visualize 1 µl of 1:4 diluted PTC product on a 10% TBE-urea gel according to the manufacturer’s instructions. The presence of three bands is expected (Fig. 6). The top band represents the PTC product, the middle band represents the residual PAL product and the bottom band corresponds to the residual MRP product. We recommend including the following standards for size comparison: 1:1,000 diluted puromycin adapter, 1:800 diluted MRP standard (use previously synthesized MRP product), 1:800 diluted MRP product (from Step 23) and 1:200 diluted PAL product (from Step 33). The user should expect a 20–70% translation efficiency. If <20% efficiency is observed, translation and capture are considered to have failed, and the user should repeat the translation reaction and capture (Steps 35–72).
Pause point
The PTC product can be stored at −80 °C for ≤1 year or until proceeding to RDC.
RDC
Timing ~10 min of active time and 2 h of incubation time
-
74
Set a heat block to 42 °C and thaw reagents on ice.
-
75
Prepare the reverse transcription reaction mixture as follows and divide equally among seven 2-ml Protein LoBind tube(s):
Component
Stock concentration
Final concentration in reaction
Reaction volumea (total/per tube) (µl)
PTC product
PTC product (collected in Step 72)
–
6,720/960
5× ProtoScript II reverse transcriptase reaction buffer
5×
1×
2,240/320
10 mM dNTP mix
10 mM each
500 µM each
560/80
0.1 M DTT
0.1 M
10 mM
1,120/160
RNase inhibitor, murine
40 U/µl
1 U/µl
280/40
ProtoScript II reverse transcriptase
200 U/µl
5 U/µl
280/40
Total
–
–
11,200/1,600
-
76
Incubate the reaction mixture at 42 °C for 60 min.
Pause point
The reverse transcription product can be stored at −80 °C for ≤2 weeks or until proceeding to RNase treatment.
-
77
Turn a heat block on to 37 °C and distribute aliquots of the RNase reaction mixture to the seven tubes containing RT product as follows:
Component
Stock concentration
Final concentration in reaction
Reaction volumea (total/per tube) (µl)
Reverse transcription product
Product from Step 76
–
11,200/1,600
RNase cocktail
RNase A: 0.5 U/µl
RNase T1: 20 U/µl
RNase A: 0.043 U/µl
RNase T1: 1.7 U/µl
1,120/160
RNase H
5 U/µl
0.32 U/µl
840/120
Total
–
–
13,160/1,880
-
78
Gently invert the reaction mixture several times. Incubate at 37 °C for 60 min.
Pause point
The RNase-treated product can be stored at −80 °C for ≤2 weeks or until proceeding to buffer exchange (Step 79).
-
79
The RNased products should be filtered and buffer-exchanged by using Millipore 10-kDa-cutoff filter column(s) and collection tubes. We recommend one filter column per 600 µl of product to reduce filter time. Add 450 µl of product (from Step 78) to filter column(s) and centrifuge for 45 min at 12,000g at 4 °C.
Critical step
It is important to never centrifuge all of the RNased product through the column. After the initial 45-min filtration, each subsequent filtration should be checked at 20-min intervals to ensure that the product has not completely filtered through the column.
-
80
Remove and discard the filtrate. Add additional RNased product (up to 300 µl) to the filter column(s) and centrifuge for 45 min at 12,000g at 4 °C. Repeat this step until all of the remaining product is loaded onto the filter column(s) with a collective total of ~100 µl of product remaining on the surface of the filter(s).
-
81
Add ~300 µl of water to each filter column and centrifuge for 45 min at 12,000g at 4 °C. Remove and discard the filtrate and repeat the step two additional times to ensure proper buffer exchange of the RNased product.
Critical step
It is important to never exceed the maximum volume capacity of the filters. It is acceptable to add <300 µl of water to prevent overfilling.
-
82
Remove and discard the filtrate and continue centrifuging for 20–40 min until there is less than the starting PTC reaction volume (from Step 36) remaining on the surface of the filter. If multiple filter columns are being used, each RNased product should be filtered until a collective total of less than the starting PTC reaction volume remains among the filter columns (<7,000 µl for the reaction volume exemplified in this protocol). The user also has the option to pipette the products off of the surface of the filter and combine them onto one filter column and proceed with filtration.
-
83
With less than the starting PTC reaction volume remaining on the surface of the filter(s), flip the filter(s) and place them into clean filtration tube(s) and spin at 2,000g at 4°C for 2 min. Collect the filtrate into 1.5- or 2-ml Protein LoBind tube(s).
-
84
Adjust the reverse transcribed product to 1.28× the original volume of the PTC reaction (Step 36) with ultrapure water. For the reaction volume exemplified in this protocol, the adjusted volume should be 8,960 µl.
Pause point
The RDC product can be stored at −80 °C for ≤1 year or until proceeding to site-specific peptide cleavage with TEV protease.
Site-specific peptide cleavage with TEV protease
Timing ~30 min of active time and 4 h of inactive time
-
85
Turn a heat block on to 30 °C and thaw reagents on ice.
-
86
Prepare the reaction mixture as follows and distribute aliquots to five 2-ml Protein LoBind tube(s):
Component
Reaction volumea (total/per tube) (µl)
RDC product
8,960/1,792
20× AcTEV buffer
500/100
0.1 M DTT
100/20
AcTEV
46/9.2
Ultrapure water
394/78.8
Total
10,000/2,000
-
87
Incubate the reaction mixture at 30 °C for 60 min. Upon completion of the incubation, immediately place the product on ice to stop the cleavage reaction.
Pause point
The product can be stored at −80 °C for ≤2 months or until proceeding to concentration (Step 88).
-
88
The products should be filtered and buffer-exchanged by using a Millipore 10-kDa-cutoff filter column and a collection tube. We recommend one filter column per 600 µl of product to reduce filter time. Add 450 µl of product to the filter columns and centrifuge for 45 min at 12,000g at 4 °C.
-
89
Remove and discard the filtrate. Add additional product (up to 300 µl) to the filter column and centrifuge for 45 min at 12,000g at 4 °C. Repeat this step until all of the remaining product is loaded onto the filter column with 1/10 of the starting reaction volume (from Step 87) remaining on the surface of the filter (~1,000 µl for the reaction volume exemplified in this protocol). If multiple filter columns are being used, each product should be filtered until a collective total of 1/10 of the starting reaction volume remains among the filter columns. The user also has the option to pipette the products off of the surface of the filter, combine them onto one filter column and proceed with filtration.
-
90
With ~1/10th volume remaining on the surface of the filter, flip the filter, place it into a clean filtration tube and spin at 2,000g at 4 °C for 2 min. Collect the filtrate (TEV product) into a 1.5- or 2-ml Protein LoBind tube. This filtrate represents the final PepSeq library, which can be used in antibody binding assays (Stage III).
-
91
Visualize and quantify the TEV product (undiluted and 1:2 and 1:10 dilutions) by using 6% TBE-urea gel electrophoresis. We recommend including the following standards: TEV oligonucleotide standard (Supplementary Table 1) serial dilutions of 500, 400, 300, 200, 100, 50, 25 and 12.5 nM. Calculate the concentration of the top band of TEV product by using a standard curve of the intensities of the standards.
Critical step
For running this gel, we recommend heating freshly made 1× TBE buffer for 3.5 min in the microwave. Longer run times will be needed if using RT buffer.
Pause point
The PepSeq library (i.e., TEV product) can be stored at −80 °C indefinitely or used for the antibody binding assay (Stage III).
Stage III: antibody binding assay
Prepare PepSeq library dilution and binding reaction (Day 1)
Timing ~2 h of active time and 24 h of incubation time
-
92
Thaw the samples (e.g., serum or plasma) and PepSeq library on ice. Allow Superblock T20 to come to RT.
-
93
Dilute the PepSeq library into Superblock T20 for a final concentration of 19.4 nM. The total volume of the diluted library should allow for 5 µl per reaction.
-
94
Mix the diluted pool by vortexing for 30 s. Distribute 5 µl into each well of a LoBind 96-well plate.
-
95
Distribute up to 4.5 µl of Superblock T20 to each well containing PepSeq library. If using >0.5 µl of sample, decrease the volume of Superblock T20 accordingly for a total volume of sample + Superblock T20 of 5 µl per well.
-
96
Distribute 0.5–5 µl of desired samples to individual wells. The total reaction volume is 10 µl per well. Pipette the reaction mixture up and down 10 times to mix.
Critical step
Running control samples on each assay plate is important. At a minimum, a negative control (buffer-only) sample is required to create bins for Z score calculation and peptide enrichment. Multiple negative controls are preferrable. Running a positive control sample with known reactivity to peptides in the PepSeq library is also recommended to confirm that the assay is performing as expected. Replicates of each experimental sample are also recommended to ensure reproducibility of results.
-
97
Seal the PCR plate with Bio-Rad Microseal and incubate for 20–24 h at RT in a humidity chamber (see Equipment setup). Plates must be tightly sealed to prevent evaporation.
-
98
Prepare protein-bound magnetic beads.
Critical
The appropriate magnetic beads will depend on the desired antibody target. For capturing human IgG isotype antibodies, we generally use commercial Protein G beads. An alternative method using streptavidin-coated beads for customized capture approaches is presented in option B.
-
(A)
Preferred method: commercially available protein-bound beads
Timing ~10 min of active time and 20 min of incubation time
-
(i)
For targeting human IgG isotype antibodies, prepare DynaBeads Protein G magnetic beads by gently resuspending the beads with an end-over-end rotator for 5 min. Transfer the desired volume of beads (10 µl per reaction plus one reaction extra) to Protein LoBind tubes.
-
(ii)
Place the tube on an appropriate magnet, wait for the solution to clear and discard the liquid.
-
(iii)
Add 1,000 µl of 1× Phosphate-Buffered Saline Tween-20 (PBST) to the magnetic beads and pipette up and down to resuspend.
-
(iv)
Quickly spin the tube. Place on an appropriate magnet and allow the beads to collect. Remove as much supernatant as possible without aspirating the beads.
-
(v)
Repeat Step 98A(iii and iv) three more times until the beads have been washed a total of four times in 1× PBST.
-
(vi)
Resuspend DynaBeads Protein G magnetic beads in the original bead volume (determined from Step 98A(i)) with Superblock T20.
-
(vii)
Incubate on an end-over-end rotator at RT for 15 min.
Pause point
Beads can be stored at 4 °C overnight.
-
(i)
-
(B)
Alternative method: preparation of custom protein-bound beads
Timing ~10 min of active time and 20 min of incubation time
-
(i)
Vortex streptavidin magnetic beads for 60 s to resuspend the beads into solution. Transfer the desired volume of beads (10 µl per reaction plus one reaction extra) to DNA LoBind tubes.
-
(ii)
Coat streptavidin magnetic beads with an amount of biotinylated capture protein (e.g., antibody) that meets or exceeds the binding capacity of the magnetic beads.
-
(iii)
Incubate the capture protein and bead mixture on an end-over-end rotator at RT for 15 min.
-
(iv)
Place the tube on an appropriate magnet and allow the beads to collect. Remove as much supernatant as possible without aspirating the beads.
-
(v)
Add 1,000 µl of Superblock T20 to the magnetic beads and pipette up and down to resuspend.
-
(vi)
Quickly spin the tube. Place the tube on an appropriate magnet and allow the beads to collect. Remove as much supernatant as possible without aspirating the beads.
-
(vii)
Repeat Step 98B(iv–vi) twice more until the beads have been washed a total of three times in Superblock T20.
-
(viii)
Resuspend the magnetic beads in the original bead volume (determined from Step 98B(i)) with Superblock T20.
Pause point
Beads can be stored at 4 °C overnight.
-
(i)
-
(A)
Reaction incubation with prepared magnetic beads and plate washing (Day 2)
Timing ~15 min of incubation time and ~1 h of active time
-
99
Distribute 10-µl aliquots of beads (from Step 98) into a semi-skirted LoBind 96-well plate. Upon completion of the PepSeq Library + antibody binding reaction (Step 97), spin down the plate and transfer the binding reactions to the semi-skirted plate containing the magnetic beads. Pipette up and down five times to mix.
-
100
Seal the plate(s) with Microseal B seal and incubate on an end-over-end rotator at RT for 15 min to allow for antibodies to bind to the magnetic beads coated with capture proteins. Ensure that the plate is well sealed to prevent cross-contamination.
-
101
After completion of the magnetic bead binding reaction, the plate(s) will undergo a series of 11 washes before final elution. We prefer performing the plate washes by using a hand-held magnetic bead extractor. If a hand-held magnetic bead extractor is unavailable, an alternative approach using multichannel pipettes is presented in Supplementary Information. Before completion of the 15-min incubation (Step 100), prepare 10 deep-well, round-bottom, skirted plates, designated as wash plates 1–10, by distributing a 120-µl aliqout of 1× PBST buffer into each well. Prepare one semi-skirted, 96-well, round-bottom plate, designated as elution plate, by distributing a 30-µl aliquot of ultrapure water into each well.
-
102
Transfer the binding reaction (from Step 100) into the first wash plate.
-
103
Attach a non-skirted plate to the prongs of the hand-held magnetic bead extractor.
-
104
Place the non-skirted plate attached to the hand-held magnetic bead extractor into the first wash plate. Allow the beads to collect onto the magnet and the solution to clear. Be sure to avoid the walls of the plate.
-
105
Gently transfer the magnet containing bound beads from wash plate 1 to wash plate 2. Discard wash plate 1.
Critical step
Ensure that the magnet does not touch the sides of the well when transferring it to each wash plate.
-
106
With the magnet seated in wash plate 2, detach the non-skirted plate, releasing the beads from the magnet. Allow the beads to incubate for 3 min.
-
107
Reattach the non-skirted plate to the magnet and allow the beads to collect onto the magnet for 2 min.
-
108
Repeat Steps 106 and 107 for wash plates 3 and 4. After wash plate 4, discard the non-skirted plate and attach a new plate onto the magnet. Repeat Steps 106 and 107 for wash plates 5–10.
-
109
After wash plate 10, transfer the magnet containing bound beads to the elution plate. Detach the non-skirted plate and gently place the elution plate onto a plate magnet to allow the beads to detach from the non-skirted plate.
-
110
Remove the elution plate from the magnet and use a multichannel pipette to transfer the full reaction mixture (including the beads) to a semi-skirted DNA LoBind plate. Heat the plate on a thermocycler at 95 °C for 5 min to elute the final product off the beads.
-
111
Quickly spin the plate down and place it onto a plate magnet. Allow the solution to clear and transfer the final eluted product into a new skirted DNA LoBind plate.
Pause point
The antibody-binding assay can be stored at −20 °C for ≤2 months until further processing for sequencing.
PCR index reaction for high-throughput sequencing
Timing ~10 min of active time and 1 h of incubation time
-
112
Prepare enough 1× PCR reaction mixture for 5.5 µl per antibody binding reaction, as follows:
Component
Volume for one reaction (µl)
5× Q5 high-fidelity buffer
3
10 mM dNTP mix
0.375
Q5 high-fidelity DNA polymerase
0.15
Ultrapure water
1.975
Total
5.5
-
113
Distribute 5.5 µl of PCR master mix for each reaction in a semi-skirted PCR plate.
-
114
To each 5.5 µl of PCR master mix, add 1.5 µl of combined forward and reverse indexing primers (stock with 5µM of each indexing primer) (Extended Data Fig. 1 and Supplementary Table 1). Pipette up and down to mix.
-
115
Add 8 µl of the eluted product from the antibody-binding assay (Step 111) to each well containing PCR master mix and indexing primers. Mix thoroughly.
-
116
Run PCR under the following conditions:
Temperature (°C)
Time
No. of cycles
98
30 s
1
98
10 s
10
62
30 s
72
30 s
98
10 s
10
68.5
30 s
72
30 s
72
5 min
1
Post-index bead cleanup
Timing ~25 min of active time and 20 min of incubation time
Critical
After completion of the PCR reaction, the plate will undergo a bead cleanup. We prefer performing the bead cleanup by using a hand-held magnetic bead extractor. If a hand-held magnetic bead extractor is unavailable, an alternative approach using multichannel pipettes is presented in Supplementary Information.
-
117
Resuspend and equilibrate Agencourt AMPure beads to RT. Heat Tris-Tween at 50 °C and prepare ~50 ml of fresh 80% (vol/vol) EtOH per 96-well LoBind plate of indexed product.
-
118
Add 27 µl of AMPure beads to each well of a 96-well, skirted, round-bottom plate. Add 150 µl of fresh 80% (vol/vol) EtOH to each well of two 96-well, skirted, round-bottom plates.
-
119
Add 15 µl of the indexing reaction (from Step 116) to the plate containing the AMPure beads and resuspend by gently pipetting up and down 10 times to ensure proper mixing. Let sit at RT for 5 min.
-
120
Place a non-skirted plate onto hand-held magnetic bead extractor prongs and gently place the magnet into the bead plate and let sit until clear (~1 min). Be sure to avoid the walls of the plate.
-
121
Carefully transfer the magnet into the first EtOH plate and gently agitate the beads in the EtOH for 30 s. Be sure to avoid the walls of the plate.
-
122
Transfer the magnet into the second EtOH plate and repeat Step 121.
-
123
Place the magnet with the plate and beads still attached into an empty 96-well, round-bottom plate to allow the beads to air-dry for 5 min at RT.
Critical step
It is important not to extend the drying time past 5 min. Extending the time will cause the magnetic beads to crack, which can cause significant loss of product.
-
124
While the beads are drying, add 20 µl of pre-warmed Tris-Tween to each well of a new 96-well, skirted, round-bottom plate.
-
125
Eject the plate with the beads still attached into the plate containing Tris-Tween.
-
126
Carefully place the round-bottom plate onto a plate magnet and wait for the beads to collect. Discard the ejected plate.
-
127
Resuspend the beads by pipetting 10 times in Tris-Tween and incubate for 2 min at RT to elute your final product off the beads.
-
128
Place a new, non-skirted plate onto hand-held magnetic bead extractor prongs and collect the beads until the solution is clear (~1 min). Discard the beads.
-
129
Transfer the eluate to a new DNA LoBind 96-well plate.
Pause point
The indexed plate can be stored at −20 °C indefinitely until being further processed for sequencing.
Preparation for sequencing
Timing ~1 h of active time and 1 h of inactive time
-
130
Quantify each of the amplified samples (e.g., by using a Quant-It dsDNA high-sensitivity quantification kit) and then pool the samples at equal concentrations for sequencing. We recommend a target of 4 nM of each sample for pooling.
-
131
Prepare the pool for the Illumina sequencing platform. We typically sequence indexed samples by using a 75- or 150-cycle mid- or high-output NextSeq kit.
Stage IV: data analysis
Data processing
Timing ~2–12 h
Critical
For detailed tutorials with example commands, see https://ladnerlab.github.io/PepSIRF/pepsirf-tutorials/. Steps 133 and 135–137 have also been automated within a Qiime2 plug-in (q2-autopepsirf). For detailed plug-in usage information, see https://ladnerlab.github.io/PepSIRF/autopepsirf-tutorials/.
-
132
Demultiplex the high-throughput sequencing data and assign raw read counts for each peptide. [PepSIRF demux]
-
133
Normalize read counts (RPM) in the demultiplexed data to account for variability in sequencing depth between samples. [PepSIRF norm, col_sum]
-
134
Select negative control samples and generate groups of peptides with similar abundances to be used for Z score calculations. [PepSIRF bin]
-
135
Further normalize RPM counts from Step 133 by subtracting the average RPM across negative controls. [PepSIRF norm, diff]
-
136
Calculate Z scores for each peptide by using the bins created in Step 134. [PepSIRF zscore]
-
137
Generate lists of enriched peptides for each sample on the basis of thresholds for Z score and/or other metrics of interest. [PepSIRF enrich]
Troubleshooting
Troubleshooting information can be found in Table 1.
Timing
Stage I
-
Steps 1–7, library design: ~2 h–2 d
Stage II
-
Steps 8–11, DDP: ~1 h
-
Steps 12–24, MRP: ~23 h
-
Steps 25–34, PAL: ~23 h
-
Steps 35–40, peptide translation: ~2.5 h
-
Steps 41–50, streptavidin bead preparation: ~2 h
-
Steps 51–73, capture of translation product: ~5 h
-
Steps 74–84, RDC: ~2.5 h
-
Steps 85–91, TEV cleavage: ~4.5 h
Stage III
-
Steps 92–98, Day 1 binding reaction: ~26 h
-
Step 98A(i–vii), bead preparation preferred method: ~25 min
-
Step 98B(i–viii), bead preparation alternative method: ~25 min
-
Steps 99–111, Day 2 binding reaction: ~1 h 15 min
-
Steps 112–116, PCR index for high-throughput sequencing: ~1 h
-
Steps 117–129, post-index bead cleanup: ~45 min
-
Steps 130–131, preparation for sequencing: ~2 h
Stage IV
-
Steps 132–137, data processing: ~2–12 h
Anticipated results
The PepSeq protocol described above can be used for many different applications, and the results will vary depending on the input library and samples used. In general, PepSeq will identify peptides that are bound by antibodies in your sample and provide a semi-quantitative measure of antibody abundance and affinity. By multiplexing hundreds of thousands of peptide antigens in a single assay, PepSeq allows for broad-scale analysis of the antibody repertoire. This allows for analysis of prior exposure to various pathogens in a single assay, as well as high-resolution epitope mapping.
Below are detailed descriptions of the results expected for each stage of the PepSeq protocol.
Stage I
Stage I of the protocol details the design of the peptide library. Completion of Stage I will result in the generation of plain text files containing (i) the peptide antigens of interest and (ii) optimized nucleotide encodings for these peptides. The encoded sequences can be then provided to a commercial supplier for oligonucleotide synthesis.
Stage II
Stage II of the protocol details the synthesis of the PepSeq DNA-barcoded peptide library through bulk enzymatic reactions. For the reaction volume exemplified in this protocol, users should anticipate a final library yield of ≥300 pmol, corresponding to ≥3,000 antibody-binding assays (0.1 pmol per assay).
Stage III
Stage III of the protocol details the antibody-binding assay and high-throughput sequencing. After completion of Stage III, users can expect to have generated high-throughput sequencing data that can be used to quantify peptide-level enrichment for each assayed sample.
Stage IV
Stage IV of the PepSeq protocol details the analysis of the sequencing data to quantify peptide enrichment. Completion of Stage IV will result in the generation of a tab-delimited file containing peptide-level Z scores for each sample, as well as plain text files listing the enriched peptides for each sample. These files can be used to compare the reactivity of peptides across samples or map reactive regions to full-length protein sequences18.
Data availability
Data used to generate Figs. 2 and 4 and Extended Data Fig. 3 are publicly available through Open Science Framework (https://osf.io/kwxtc/).
Code availability
All custom software described in the protocol is publicly available through GitHub: Library-Design: https://github.com/LadnerLab/Library-Design; PepSIRF: https://github.com/LadnerLab/PepSIRF; and Qiime2 plug-ins: https://github.com/LadnerLab/q2-pepsirf, https://github.com/LadnerLab/q2-ps-plot and https://github.com/LadnerLab/q2-autopepsirf.
Change history
16 May 2024
A Correction to this paper has been published: https://doi.org/10.1038/s41596-024-01010-1
References
Vengesai, A. et al. A systematic and meta-analysis review on the diagnostic accuracy of antibodies in the serological diagnosis of COVID-19. Syst. Rev. 10, 155 (2021).
Pollán, M. et al. Prevalence of SARS-CoV-2 in Spain (ENE-COVID): a nationwide, population-based seroepidemiological study. Lancet 396, 535–544 (2020).
Lequin, R. M. Enzyme immunoassay (EIA)/enzyme-linked immunosorbent assay (ELISA). Clin. Chem. 51, 2415–2418 (2005).
Taylor, C. T. et al. Detection of specific ZIKV IgM in travelers using a multiplexed flavivirus microsphere immunoassay. Viruses 10, 253 (2018).
Graham, H., Chandler, D. J. & Dunbar, S. A. The genesis and evolution of bead-based multiplexing. Methods 158, 2–11 (2019).
Tokarz, R. et al. A multiplex serologic platform for diagnosis of tick-borne diseases. Sci. Rep. 8, 3158 (2018).
Buus, S. et al. High-resolution mapping of linear antibody epitopes using ultrahigh-density peptide microarrays. Mol. Cell. Proteom. 11, 1790–1800 (2012).
Xu, G. J. et al. Viral immunology. Comprehensive serological profiling of human populations using a synthetic human virome. Science 348, aaa0698 (2015).
Mohan, D. et al. PhIP-Seq characterization of serum antibodies using oligonucleotide-encoded peptidomes. Nat. Protoc. 13, 1958–1978 (2018).
Larman, H. B. et al. Autoantigen discovery with a synthetic human peptidome. Nat. Biotechnol. 29, 535–541 (2011).
Mina, M. J. et al. Measles virus infection diminishes preexisting antibodies that offer protection from other pathogens. Science 366, 599–606 (2019).
Roberts, R. W. & Szostak, J. W. RNA-peptide fusions for the in vitro selection of peptides and proteins. Proc. Natl Acad. Sci. USA 94, 12297–12302 (1997).
Kozlov, I. A. et al. A highly scalable peptide-based assay system for proteomics. PLoS One 7, e37441 (2012).
Shiryaev, S. A. et al. High-resolution analysis and functional mapping of cleavage sites and substrate proteins of furin in the human proteome. PLoS One 8, e54290 (2013).
Shiryaev, S. A. et al. Substrate cleavage profiling suggests a distinct function of Bacteroides fragilis metalloproteinases (fragilysin and metalloproteinase II) at the microbiome-inflammation-cancer interface. J. Biol. Chem. 288, 34956–34967 (2013).
Shiryaev, S. A. et al. Structural and functional diversity of metalloproteinases encoded by the Bacteroides fragilis pathogenicity island. FEBS J. 281, 2487–2502 (2014).
Kukreja, M. et al. High-throughput multiplexed peptide-centric profiling illustrates both substrate cleavage redundancy and specificity in the MMP Family. Chem. Biol. 22, 1122–1133 (2015).
Ladner, J. T. et al. Epitope-resolved profiling of the SARS-CoV-2 antibody response identifies cross-reactivity with endemic human coronaviruses. Cell Rep. Med. 2, 100189 (2021).
Elko, E. A. et al. COVID-19 vaccination elicits an evolving, cross-reactive antibody response to epitopes conserved with endemic coronavirus spike proteins. Cell Rep. 40, 11102 (2022).
Bielec, K. et al. Kinetics and equilibrium constants of oligonucleotides at low concentrations. Hybridization and melting study. Phys. Chem. Chem. Phys. 21, 10798–10807 (2019).
Björck, L. & Kronvall, G. Purification and some properties of streptococcal protein G, a novel IgG-binding reagent. J. Immunol. 133, 969–974 (1984).
Fink, Z. W., Martinez, V., Altin, J. & Ladner, J. T. PepSIRF: a flexible and comprehensive tool for the analysis of data from highly-multiplexed DNA-barcoded peptide assays. Preprint at https://arxiv.org/abs/2007.05050 (2020).
Bolyen, E. et al. Reproducible, interactive, scalable and extensible microbiome data science using QIIME 2. Nat. Biotechnol. 37, 852–857 (2019).
Brown, A. M., Bolyen, E., Raspet, I., Altin, J. A. & Ladner, J. T. PepSIRF + QIIME 2: software tools for automated, reproducible analysis of highly-multiplexed serology data. Preprint at https://arxiv.org/abs/2207.11509 (2022).
Acknowledgements
This work was supported by the NIAID (U24AI152172, U24AI152172-01S1 and U24AI152172-IOF; Principal Investigator: J.A.A.), the National Institute on Minority Health and Health Disparities of the National Institutes of Health under Award Number U54MD012388 and the State of Arizona Technology and Research Initiative Fund (TRIF, administered by the Arizona Board of Regents, through Northern Arizona University). The content is solely the responsibility of the authors and does not necessarily represent the official views of the National Institutes of Health.
Author information
Authors and Affiliations
Contributions
Conceptualization, J.A.A. and J.T.L.; data curation, E.A.E., Z.F., E.J.K., H.L.M., J.A.A. and J.T.L.; formal analysis, E.A.E., Z.F., E.J.K., H.L.M., J.A.A. and J.T.L.; methodology, S.N.H., A.L.E., A.S.B., S.J.F., F.R., G.A.N., J.A.A. and J.T.L.; investigation, S.N.H., A.L.E, A.P., A.S.B., S.J.F., F.R. and G.A.N.; visualization, E.A.E., J.A.A. and J.T.L.; software, E.A.E., Z.F., V.M., A.B., E.J.K., I.R., J.A.A. and J.T.L.; validation, S.N.H., E.A.E., A.L.E., S.J.F., F.R., G.A.N. and H.L.M.; project administration, S.N.H., A.L.E., G.A.N. and J.A.A.; writing—original draft, S.N.H., E.A.E., P.M.S., A.L.E., G.A.N., J.A.A. and J.T.L.; writing—review and editing, S.N.H., E.A.E., A.L.E., A.P., F.R., G.A.N., H.L.M., J.A.A. and J.T.L.; funding acquisition, J.A.A. and J.T.L.; resources, P.M.S., Y.L. and E.J.K.; supervision, P.M.S., J.A.A. and J.T.L.
Corresponding authors
Ethics declarations
Competing interests
The authors declare no competing interests.
Peer review
Peer review information
Nature Protocols thanks the anonymous reviewers for their contribution to the peer review of this work.
Additional information
Publisher’s note Springer Nature remains neutral with regard to jurisdictional claims in published maps and institutional affiliations.
Related links
Key references using this protocol
Ladner, J. T. et al. Cell Rep. Med. 2, 100189 (2021): https://doi.org/10.1016/j.xcrm.2020.100189
Elko, E. A. et al. Cell Rep. 40, 111022 (2022): https://doi.org/10.1016/j.celrep.2022.111022
Schuettenberg, A. et al. Microbiol. Spect. 10, e02873-22 (2022): https://doi.org/10.1128/spectrum.02873-22
Extended data
Extended Data Fig. 1 Sequence alignment for a representative PepSeq probe with amplification and sequencing primers.
Top: For DNA amplification, the forward or reverse primers bind to the PepSeq probe via the 19-nt constant regions added to either end of the DNA tag. The forward DNA amplification primer contains a T7 promoter, NEB untranslated region, start codon and TEV cleavage site sequences. The reverse DNA amplification primer contains an S6 tag and a CP1 annealing site. Bottom: For sequencing, the forward indexing primer contains a 12-nt randomer (N) and a 10-nt barcode sequence (B). The reverse indexing primer contains a separate 8-nt barcode (B). Both indexing primers bind to the DNA tags via the 19-nt constant regions. For the reverse primers, we are showing the reverse complement sequences to clearly indicate annealing regions. See Supplementary Table 1 for oligonucleotide sequences to order.
Extended Data Fig. 2 Bioinformatic pipeline for design of the PepSeq library and analysis of sequencing results.
Graphical depiction of a typical analysis workflow through peptide design and encoding (left) and bioinformatic analysis (right). Each box represents a step in the bioinformatic pipeline and includes a basic description of the step, along with a recommended piece of software (left) or PepSIRF module (right) for accomplishing the described step (contained in square brackets). Arrows indicate a direct connection, with the output file from the upstream box being used as an input file for the downstream box. The dashed box indicates a step that needs to be performed the first time running the analysis but is not required to be run for every analysis.
Extended Data Fig. 3 Effect of Illumina sequencing cluster density on PepSeq demultiplexed read yield.
The relationship between flowcell cluster density (x-axis) and the total number of reads successfully demultiplexed to peptides and samples (y-axis) across a series of representative sequencing runs by using mid-output (blue dots) or high-output (red dots) 150-cycle Illumina NextSeq kits. We observe a cluster density between 250 and 325 (green shaded region) to yield the greatest number of usable PepSeq reads per run, which substantially exceeds the cluster density recommended by Illumina (blue shaded region). Cluster densities for high-output kits have been normalized by a factor of 3 to allow accurate comparison with mid-output kits.
Supplementary information
Supplementary Information
Supplementary Methods and Table 1
Rights and permissions
Springer Nature or its licensor (e.g. a society or other partner) holds exclusive rights to this article under a publishing agreement with the author(s) or other rightsholder(s); author self-archiving of the accepted manuscript version of this article is solely governed by the terms of such publishing agreement and applicable law.
About this article

Cite this article
Henson, S.N., Elko, E.A., Swiderski, P.M. et al. PepSeq: a fully in vitro platform for highly multiplexed serology using customizable DNA-barcoded peptide libraries. Nat Protoc 18, 396–423 (2023). https://doi.org/10.1038/s41596-022-00766-8
Received:
Accepted:
Published:
Issue Date:
DOI: https://doi.org/10.1038/s41596-022-00766-8
Comments
By submitting a comment you agree to abide by our Terms and Community Guidelines. If you find something abusive or that does not comply with our terms or guidelines please flag it as inappropriate.
