
Breast cancer intrinsic subtypes (IS) are biologically distinct entities, characterized by specific natural gene expression patterns1,2. The most widely accepted IS are the Luminal A, Luminal B, HER2-Enriched, and Basal-like3 (Fig. 1). These entities are prognostic and have potential therapeutic implications in both early-stage and advanced-stage hormone receptor-positive (HR+)/HER2-negative breast cancer4,5,6,7,8,9,10,11. However, the IS molecular classification is often misinterpreted, and immunohistochemistry (IHC)-based IS surrogates, or other molecular subtype definitions, are erroneously used interchangeably. This generates confusion for all the stakeholders involved, including scientists studying these biomarkers and physicians considering them for clinical decision-making. In this perspective, therefore, we provide readers with a historical overview of the discovery and clinical implementation of the IS, the main technical and biological differences among assays developed for their detection, and propose a specific and simple nomenclature for subtyping to avoid further confusion and disservice to patients.

Median centered unsupervised hierarchical clustering representing the breast cancer intrinsic subtypes (Luminal A, Luminal B, HER2-Enriched, Basal-like) and the Normal-like group, identified using the research-based PAM50 assay on the nCounter® platform, in a set of 527 archived breast cancer fresh-frozen paraffin-embedded (FFPE) samples from Dr. Prat’s laboratory. Each column represents a single patient’s sample. The red color represents relatively high gene expression, green represents relatively low gene expression, and black represents median gene expression. The PAM50 gene list is reported on the right side of the heatplot. The unsupervised cluster and heatmap were obtained with R version 3.6.1, Cluster 3.0, and Javatreeview 1.1.6r4 for MacOSX. LumA luminal A, LumB luminal B, Her2 HER2-Enriched, Basal Basal-like, Normal Normal-like.
Breast cancer IS were first described in 2000 by Prof. Charles M. Perou and colleagues who utilized DNA microarrays representing more than 8000 genes in 65 breast tumor surgical specimens and 17 cultured cell lines1. Since then, several so-called intrinsic gene lists, methods, and platforms (e.g., Agilent, Affymetrix, and Illumina) for IS identification have been reported in the literature2,3,12,13,14,15,16,17. The intrinsic gene lists included hundreds of genes considered to reflect individual tumors’ phenotypes. However, several challenges prevented the implementation of IS in the clinic. First, most of the technologies applied required fresh-frozen tissue; second, the microarray technology requires resources and is time-consuming; third, the original classification based on hierarchical cluster analysis could only be applied retrospectively to sufficiently sized cohorts of patients; fourth, the entire sample-to-result process needed a centralized laboratory and a controlled environment.
These reasons led Perou and colleagues to develop a clinically applicable assay, which was first described in 200918. First, they were able to shrink the number of intrinsic genes from almost 2000 to 50 (note: a lower number of genes was associated with reduced accuracy in subtype identification, especially for non-Basal-like subtypes). This gene list was called PAM50 (Fig. 1). Secondly, they used qRT-PCR to measure the expression of the 50 genes from readily available formalin-fixed paraffin-embedded tissue (FFPE), so to classify a patient’s tumor by assessing the similarities between a given case and prototypical IS centroids18. Furthermore, they derived a prognostic score known as the risk-of-relapse (ROR) score, capable of estimating a patient’s probability of breast cancer recurrence, by integrating and weighting the molecular subtype correlations, a subset of proliferation genes, and tumor size18. The standardized PAM50 qRT-PCR version was then implemented and commercialized. However, the standardization was not easy, and a central lab was needed. These issues were overcome when Nanostring Technologies® developed the nCounter® genomic platform, allowing for easy implementation of genomic assays through de-centralization, automated and fast process from RNA until the result, and, most importantly, without any enzymatic reaction. The PAM50 patent was licensed to Nanostring Technologies®, which re-developed the assay using the same genes (except the housekeeping genes used for normalization), standardized the test and created ad-hoc kits to allow for the decentralized processing of the assay with their platform19,20. The IS and ROR score from the Nanostring PAM50 decentralized assay (known as Prosigna®, which is now commercialized by Veracyte™) were CE-marked in Europe. Then, several trials prospectively confirmed the high reproducibility of the assay across labs and its impact on therapeutic decision-making in the context of early-stage HR + /HER2-negative breast cancer21,22,23. In the United States (US), the ROR score was FDA 510(k)-cleared but not IS; hence IS is not provided. Although IS are prognostic in early-stage HR+/HER2-negative disease, their independent clinical utility is not established in the presence of the ROR. The fact that IS are not reported by Prosigna® in the US highlights the differences of obtaining FDA clearance, which contrasts with IS-related information provided by other commercial assays, which do not need FDA clearance if they are centrally performed as laboratory-developed tests (LDTs).
In 2010, a research-based study using microarray data showed that different single sample predictor (SSP) assays based on specific intrinsic gene lists presented only low to moderate IS concordance, with only Basal-like cancers consistently showing an almost-perfect agreement24. This led the authors to conclude that IS are inconsistent biomarkers that could not be incorporated into clinical practice25. Although none of the training sets and gene lists analyzed were specifically designed to be concordant at the individual-sample level, as we also highlighted elsewhere24, many research studies had used them interchangeably. At the same time, as also observed with a different approach by Haibe-Kains et al., a certain discordance remains across several subtype classifiers, including PAM5026. Again, the Basal-like subtype was consistently identified independently of the classifier used, while Luminal and HER2-Enriched subtypes were more difficult to classify26. An explanation of the discordance observed with several IS predictors in discriminating between Luminal subtypes is that the major biological difference between Luminal A and B tumors resides in their differential expression of proliferation-related genes, which exhibit a continuum of expression levels26. Hence different cut-offs distinguishing between a high and low proliferation level may impact on a single sample classification when different IS predictors are used. Conversely, the distinct features of the Basal-like subtype (i.e., high expression of basal cytokeratins, lack of expression of estrogen- and HER2-related genes)27 are likely responsible for the high levels of agreement in Basal-like identification among different IS classifiers.
In 2015, two investigators reported a microarray-based method, called AIMS, to identify IS of a single sample without using controls or references, showing a concordance with the original research-based PAM50 of 76–77%28. The authors highlighted the robustness of their assay and claimed to have solved normalization-related issues28. However, this approach has never been standardized, undergone regulatory review, nor commercialized. In parallel, another subtype assay was developed, standardized, and commercialized, namely the BluePrint® test from Agendia®. Noteworthy, this subtype assay is not based on, and hence is not driven by, the natural IS gene expression patterns observed in the tumor. Instead, BluePrint® took ER, PR, and HER2 IHC status as its starting point to develop gene expression patterns specifically able to discriminate between IHC hormone receptor-positive (HR+)/HER2-negative, HER2-positive (HER2+) and triple-negative breast cancer (TNBC)29. The gene profiles capable of identifying TNBC, HER2+and HR+/HER2-negative tumors were called Basal-type, HER2-type, and Luminal-type, respectively. Of note, the Luminal-type was further stratified by using the MammaPrint® prognostic genomic assay, with the low-risk and high-risk cases being re-classified as Luminal A-type and Luminal B-type, respectively29. Hence, the BluePrint® assay is a three-subtype classifier (derived from IHC-based prototypical groups), which uses the MammaPrint® prognostic assay to further dissect HR+ tumors into a Luminal A and a Luminal B subgroup.
In the recent OPTIMA preliminary trial, where various commercial and standardized prognostic gene expression assays were compared, including PAM50/Prosigna®, the concordance of the results was low30. Importantly, the discordance rate between PAM50/Prosigna® and BluePrint® IS was 40%30. Such results are not surprising, since the two assays have different methodological approaches and gene lists (i.e., only seven genes in common among 130 genes)18,29. A similar challenge of lack of interchangeability is found even with assays based on a single antibody, such as with PD-L1 IHC clinical testing, where each assay is still unique due to differences in antibody performance characteristics or antigen scoring, and cannot be used interchangeably for indicating anti-PD1/PD-L1 therapy31.
Overall, these important differences in IS assays development, validation, and limited concordance lead us to the following considerations and recommendations:
-
1.
The concept of molecular subtype is not comparable to the concept of a specific genetic mutation. The latter is a biologic feature that can be detected by different sequencing-based assays (with various levels of sensitivity). In contrast, each IS assay identifies different biologic entities, due to diverse gene expression construct assumptions and methodologies. Therefore, IS identified using distinct assays should be considered as different biomarkers trying to interrogate related but not identical biologic entities. In other words, IS-related assays are not interchangeable, unless a formal effort is made to develop fully concordant tests and a near-perfect agreement were to be observed, which unfortunately is not the case for the currently available assays30. This is an important misconception that currently exists in the medical community that we aim to clarify with this commentary (Fig. 2).
Fig. 2: Main intrinsic/molecular subtypes classifiers and tips to avoid scientific and clinical confusion. 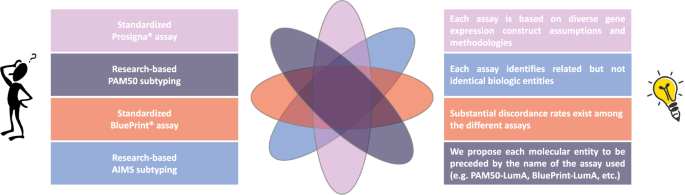
Main intrinsic/molecular subtypes classifiers are resumed in the left boxes. In the right boxes, specific recommendations and a proposal for a new nomenclature of intrinsic/molecular subtypes are included, in order to avoid scientific and clinical confusion due to the lack of interchangeability between the assays. Diverse assays identify related but not identical biologic entities, which can result in different classifications of the intrinsic subtype for the individual patient, depending on the assay that is being used.
-
2.
Standardization of gene expression data is possible and with high standards. However, we cannot assume that PAM50 research-based versions provide the same results as the standardized commercial assay (i.e., Prosigna®). In fact, researchers and physicians should understand a discordance rate of 10–20% between the formers and the latter (unpublished personal data, based on more than 10 years of experience performing the assays). This might be enough concordance to result in similar clinical utility, but without formally assessing both assays to prove this point, we cannot make such an assumption.
-
3.
The fact that distinct assays use similar nomenclature to identify similarly but at the same time technically and biologically differing clinical entities (e.g., Luminal A and B established by different assays) is confusing for clinicians, patients, and researchers alike. Our proposal from now on is to clearly distinguish the name of the assay being used to identify IS, e.g., PAM50 subtypes (for research-based PAM50 analysis), Prosigna subtypes, BluePrint subtypes, AIMS subtypes, etc., instead of calling them all intrinsic subtypes, as if they were interchangeable biomarkers. Similarly, each subtype might be preceded by the name of the assay being used, e.g., PAM50-Luminal A, Prosigna-Luminal A, BluePrint-Luminal A, AIMS-Luminal A, etc. (Fig. 2).
-
4.
Considering the absence of a perfect overlap between IHC-detected and genomic subtypes9, as well as the confusion observed in the literature regarding this aspect, we strongly encourage researchers and physicians to adopt the right terminology for IHC-based IS surrogates, which is the one proposed by the St. Gallen Breast Cancer International Consensus (i.e., Luminal A-like, Luminal B-like/HER2-positive or negative, HER2-positive, and Triple Negative)32.

Finally, an IS change from the primary to the recurrent/metastatic tumors has been detected in ~40% of the cases33,34,35. One reason might be the interference of a given treatment, resulting in reprogramming of gene expression patterns. Another cause could be a selective pressure exerted by a given therapy favoring the survival of resistant clones, likely reflecting underlying biology less sensitive to the treatment administered (e.g., Luminal A subtype shifting to HER2-Enriched subtype after prolonged endocrine therapy; HER2-Enriched subtype shifting to non-HER2-Enriched subtypes following anti-HER2-based treatments). Changes in subtype might be also due to natural tumor evolution and/or diverse organ microenvironment-specific influences on cancer gene expression33,34,35,36. Regardless, in all scenarios, the assays used for IS detection are the same. Therefore, in our view, there is no need for a further terminology change per se, as some have suggested.
Reporting summary
Further information on research design is available in the Nature Research Reporting Summary linked to this article.
References
Perou, C. M. et al. Molecular portraits of human breast tumours. Nature 406, 747–752 (2000).
Sørlie, T. et al. Gene expression patterns of breast carcinomas distinguish tumor subclasses with clinical implications. Proc. Natl Acad. Sci. USA 98, 10869–10874 (2001).
Prat, A. & Perou, C. M. Deconstructing the molecular portraits of breast cancer. Mol. Oncol. 5, 5–23 (2011).
Prat, A. et al. Correlative biomarker analysis of intrinsic subtypes and efficacy across the MONALEESA phase III studies. J. Clin. Oncol. 39, 1458–1467 (2021).
Carey, L. et al. Abstract GS2-00: correlative analysis of overall survival by intrinsic subtype across the MONALEESA-2, -3, and -7 studies of ribociclib + endocrine therapy in patients with HR+/HER2− advanced breast cancer. Cancer Res. 82, GS2-00 (2022).
Caan, B. J. et al. Intrinsic subtypes from the PAM50 gene expression assay in a population-based breast cancer survivor cohort: prognostication of short- and long-term outcomes. Cancer Epidemiol. Biomarkers Prev. 23, 725–734 (2014).
Prat, A. et al. Prediction of response to neoadjuvant chemotherapy using core needle biopsy samples with the Prosigna assay. Clin. Cancer Res. 22, 560–566 (2016).
Ohnstad, H. O. et al. Prognostic value of PAM50 and risk of recurrence score in patients with early-stage breast cancer with long-term follow-up. Breast Cancer Res. 19, 120 (2017).
Prat, A. et al. Clinical implications of the intrinsic molecular subtypes of breast cancer. Breast 24, S26–S35 (2015).
Cejalvo, J. M. et al. Clinical implications of the non-luminal intrinsic subtypes in hormone receptor-positive breast cancer. Cancer Treat. Rev. 67, 63–70 (2018).
SOLTI Breast Cancer Research Group. A phase III, multicenter, open-label study of ribociclib vs. palbociclib in patients with advanced hormone receptor-positive/HER2-negative/HER2-enriched breast cancer - HARMONIA Trial. https://clinicaltrials.gov/ct2/show/NCT05207709 (2022).
Sorlie, T. et al. Repeated observation of breast tumor subtypes in independent gene expression data sets. Proc. Natl Acad. Sci. USA 100, 8418–8423 (2003).
Sotiriou, C. et al. Breast cancer classification and prognosis based on gene expression profiles from a population-based study. Proc. Natl Acad. Sci. USA 100, 10393–10398 (2003).
Perreard, L. et al. Classification and risk stratification of invasive breast carcinomas using a real-time quantitative RT-PCR assay. Breast Cancer Res. 8, R23 (2006).
Hu, Z. et al. The molecular portraits of breast tumors are conserved across microarray platforms. BMC Genomics 7, 96 (2006).
Sørlie, T. et al. Distinct molecular mechanisms underlying clinically relevant subtypes of breast cancer: gene expression analyses across three different platforms. BMC Genomics 7, 127 (2006).
Fan, C. et al. Concordance among gene-expression-based predictors for breast cancer. N. Engl. J. Med. 355, 560–569 (2006).
Parker, J. S. et al. Supervised risk predictor of breast cancer based on intrinsic subtypes. J. Clin. Oncol. 27, 1160–1167 (2009).
Wallden, B. et al. Development and verification of the PAM50-based Prosigna breast cancer gene signature assay. BMC Med. Genomics 8, 54 (2015).
Nielsen, T. et al. Analytical validation of the PAM50-based Prosigna breast cancer prognostic gene signature sssay and nCounter analysis system using formalin-fixed paraffin-embedded breast tumor specimens. BMC Cancer 14, 177 (2014).
Martín, M. et al. Prospective study of the impact of the Prosigna assay on adjuvant clinical decision-making in unselected patients with estrogen receptor positive, human epidermal growth factor receptor negative, node negative early-stage breast cancer. Curr. Med. Res. Opin. 31, 1129–1137 (2015).
Hequet, D. et al. Prospective, multicenter French study evaluating the clinical impact of the Breast Cancer Intrinsic Subtype-Prosigna® test in the management of early-stage breast cancers. PLoS ONE 12, e0185753 (2017).
Wuerstlein, R. et al. The West German Study Group Breast Cancer Intrinsic Subtype study: a prospective multicenter decision impact study utilizing the Prosigna assay for adjuvant treatment decision-making in estrogen-receptor-positive, HER2-negative early-stage breast cancer. Curr. Med. Res. Opin. 32, 1217–1224 (2016).
Perou, C. M., Parker, J. S., Prat, A., Ellis, M. J. & Bernard, P. S. Clinical implementation of the intrinsic subtypes of breast cancer. Lancet Oncol. 11, 718–719 (2010).
Weigelt, B. et al. Breast cancer molecular profiling with single sample predictors: a retrospective analysis. Lancet Oncol. 11, 339–349 (2010).
Haibe-Kains, B. et al. A three-gene model to robustly identify breast cancer molecular subtypes. J. Natl Cancer Inst. 104, 311–325 (2012).
Prat, A. et al. Molecular characterization of basal-like and non-basal-like triple-negative breast cancer. Oncologist 18, 123–133 (2013).
Paquet, E. R. & Hallett, M. T. Absolute assignment of breast cancer intrinsic molecular subtype. J. Natl Cancer Inst. 107, 357 (2015).
Krijgsman, O. et al. A diagnostic gene profile for molecular subtyping of breast cancer associated with treatment response. Breast Cancer Res. Treat. 133, 37–47 (2012).
Bartlett, J. M. S. et al. Comparing breast cancer multiparameter tests in the OPTIMA prelim trial: no test is more equal than the others. J. Natl Cancer Inst. 108, djw050 (2016).
Torlakovic, E. et al. ‘Interchangeability’ of PD-L1 immunohistochemistry assays: a meta-analysis of diagnostic accuracy. Mod. Pathol. 33, 4–17 (2020).
Goldhirsch, A. et al. Strategies for subtypes-dealing with the diversity of breast cancer: highlights of the St. Gallen International Expert Consensus on the primary therapy of early breast cancer 2011. Ann. Oncol. 22, 1736–1747 (2011).
Cejalvo, J. M. et al. Intrinsic subtypes and gene expression profiles in primary and metastatic breast cancer. Cancer Res. 77, 2213–2221 (2017).
Jørgensen, C. L. T. et al. PAM50 intrinsic subtype profiles in primary and metastatic breast cancer show a significant shift toward more aggressive subtypes with prognostic implications. Cancers 13, 1592 (2021).
Brasó-Maristany, F. et al. Gene expression profiles of breast cancer metastasis according to organ site. Mol. Oncol. 16, 69–87 (2022).
Garcia-Recio, S. et al. FGFR4 regulates tumor subtype differentiation in luminal breast cancer and metastatic disease. J. Clin. Invest. 130, 4871–4887 (2020).
Acknowledgements
European Society for Medical Oncology (ESMO) Fellowship—Translational and BBVA Foundation/Hospital Clinic of Barcelona Joan Rodés—Jose Baselga Advanced Research Contract in Oncology (to F.S.), Breast Cancer Now—2018NOVPCC1294 (to A.P.), Breast Cancer Research Foundation-AACR Career Development Awards for Translational Breast Cancer Research 19-20-26-PRAT (to A.P.), Fundació La Marató TV3 201935-30 (to A.P.), RESCUER, funded by European Union’s Horizon 2020 Research and Innovation Program under Grant Agreement No. 847912 (to A.P.), Fundación Científica Asociación Española Contra el Cáncer—INVES21943BRAS (to F.B.-M.). The “thinking man” and the light bulb included in Fig. 2 are free clip art available in the online repository http://clipart-library.com. No specific authorization is required for their use. Terms of use are available at http://clipart-library.com/terms.html.
Author information
Authors and Affiliations
Contributions
Study concept and design, Drafting of the manuscript, Critical revision of the manuscript for important intellectual content, and Accountability for all aspects of the work: all authors. Acquisition, analysis, or interpretation of data: F.S. and A.P. (literature review). Statistical analysis, Obtained funding, Administrative, technical, or material support: N/A. Study supervision: A.P.
Corresponding author
Ethics declarations
Competing interests
F.S. and F.B.-M. have no competing financial and non-financial interests. N.M.K. reports the following competing financial interests: advisory and consulting fees from Invitae, G1 Therapeutics, Beyond Spring, Spectrum, BMS, Sandoz, Seattle Genetics, and Total Health all outside the submitted work. As a non-financial competing interest, N.M.K. reports to be among the authors of past and the latest ASCO breast cancer biomarker guidelines updates. A.P. declares no competing non-financial interests but reports advisory and consulting fees from Roche, Pfizer, Novartis, Amgen, BMS, Puma, Oncolytics Biotech, MSD, Guardant Health, Peptomyc, and Lilly, lecture fees from Roche, Pfizer, Novartis, Amgen, BMS, Nanostring Technologies and Daiichi Sankyo, institutional financial interests from Boehringer, Novartis, Roche, Nanostring, Sysmex Europa GmbH, Medica Scientia inno. Research, SL, Celgene, Astellas, and Pfizer; a leadership role in Reveal Genomics, SL; and a patent PCT/EP2016/080056.
Additional information
Publisher’s note Springer Nature remains neutral with regard to jurisdictional claims in published maps and institutional affiliations.
Supplementary information
Rights and permissions
Open Access This article is licensed under a Creative Commons Attribution 4.0 International License, which permits use, sharing, adaptation, distribution and reproduction in any medium or format, as long as you give appropriate credit to the original author(s) and the source, provide a link to the Creative Commons license, and indicate if changes were made. The images or other third party material in this article are included in the article’s Creative Commons license, unless indicated otherwise in a credit line to the material. If material is not included in the article’s Creative Commons license and your intended use is not permitted by statutory regulation or exceeds the permitted use, you will need to obtain permission directly from the copyright holder. To view a copy of this license, visit http://creativecommons.org/licenses/by/4.0/.
About this article

Cite this article
Schettini, F., Brasó-Maristany, F., Kuderer, N.M. et al. A perspective on the development and lack of interchangeability of the breast cancer intrinsic subtypes. npj Breast Cancer 8, 85 (2022). https://doi.org/10.1038/s41523-022-00451-9
Received:
Accepted:
Published:
DOI: https://doi.org/10.1038/s41523-022-00451-9
This article is cited by
-
Cell-cycle inhibition and immune microenvironment in breast cancer treated with ribociclib and letrozole or chemotherapy
npj Breast Cancer (2024)
-
Correlation between breast cancer subtypes determined by immunohistochemistry and n-COUNTER PAM50 assay: a real-world study
Breast Cancer Research and Treatment (2024)
-
Computational reactive–diffusive modeling for stratification and prognosis determination of patients with breast cancer receiving Olaparib
Scientific Reports (2023)
-
Central obesity, body mass index, metabolic syndrome and mortality in Mediterranean breast cancer patients
Scientific Reports (2023)
