
Abstract
To study the relationship between uniparental rDNA (encoding 18S, 5.8S and 26S ribosomal RNA) silencing (nucleolar dominance) and rRNA gene dosage, we studied a recently emerged (within the last 80 years) allotetraploid Tragopogon mirus (2n=24), formed from the diploid progenitors T. dubius (2n=12, D-genome donor) and T. porrifolius (2n=12, P-genome donor). Here, we used molecular, cytogenetic and genomic approaches to analyse rRNA gene activity in two sibling T. mirus plants (33A and 33B) with widely different rRNA gene dosages. Plant 33B had ~400 rRNA genes at the D-genome locus, which is typical for T. mirus, accounting for ~25% of total rDNA. We observed characteristic expression dominance of T. dubius-origin genes in all organs. Its sister plant 33A harboured a homozygous macrodeletion that reduced the number of T. dubius-origin genes to about 70 copies (~4% of total rDNA). It showed biparental rDNA expression in root, flower and callus, but not in leaf where D-genome rDNA dominance was maintained. There was upregulation of minor rDNA variants in some tissues. The RNA polymerase I promoters of reactivated T. porrifolius-origin rRNA genes showed reduced DNA methylation, mainly at symmetrical CG and CHG nucleotide motifs. We hypothesise that active, decondensed rDNA units are most likely to be deleted via recombination. The silenced homeologs could be used as a ‘first reserve’ to ameliorate mutational damage and contribute to evolutionary success of polyploids. Deletion and reactivation cycles may lead to bidirectional homogenisation of rRNA arrays in the long term.
Introduction
Allopolyploidy is a major driving force in angiosperm evolution. Once stabilized, young allopolyploids can become successful species (Abbott et al., 2013). The advantage of duplicated genes and chromosomes in the nucleus is, however, not obvious in the short term because genome duplication is frequently associated with various problems, including genomic instability, transposon activation (Parisod et al., 2010), meiotic irregularities (Grandont et al., 2013) and expression imbalance (Adams and Wendel, 2005). One of the manifestations of genomic instability is homeologue loss, which is observed in many natural and synthetic allopolyploids (Leitch and Leitch, 2008; Renny-Byfield and Wendel, 2014). The evolutionary significance, molecular mechanisms and impacts of such genomic instability on plant physiology remain unknown.
The 35S rDNA locus, encoding the 18S-5.8S-26S rRNA genes, forms a distinct chromosome structure known as the Nucleolus Organiser Region (NOR). Silencing of NORs (nucleolar dominance) was initially discovered in plant hybrids through cytological observations 80 years ago (Navashin, 1934). Later studies revealed that rDNA silencing depends on both genetic (Flavell and Odell, 1979) and epigenetic factors, including DNA and histone modifications and the small-interfering RNA pathway (reviewed in Costa-Nunes et al., 2010). However, rDNAs can also undergo concerted evolution, and in the context of allopolyploids can homogenise parental units to a single repeat type (reviewed in Volkov et al., 2007 and Nieto Feliner and Rossello, 2012). The homogenisation process is often connected with a reduction in rRNA gene copies so that many allopolyploids have copy numbers similar to their lower ploidal-level progenitor species (Kovarik et al., 2008). However, the relationship between rRNA gene dosage and nuclear dominance is unclear. In wheat, which has three or more pairs of rDNA-carrying chromosomes, the most active NORs bear only half the number of genes found in the largest, inactive loci (Flavell and Odell, 1976). Furthermore, Caperta et al. (2002) found that homeologous rDNA loci in rye have differential expression patterns that are independent of the number of rRNA gene copies at each locus. In a classical study, Drosophila flies with fewer rRNA genes than wild type show a reduced rate of rRNA synthesis and a mutated, hypomorphic, pleiotropic phenotype (Mohan and Ritossa, 1970). Interestingly, yeast mutants with only two copies of the rDNA unit can recover up to 45 copies in as many generations (Kobayashi and Ganley, 2005). However, such severe copy number mutants are unusual in eukaryotes, most of which, unlike yeast which has 150–200 rDNA copies, typically possess hundreds or thousands of copies, often across multiple loci. It is estimated that about 100–200 genes are sufficient to cover metabolic demands in animals (Grummt and Pikaard, 2003). The situation is less clear in plants, which usually possess a high number of rRNA genes (typically thousands of copies Ingle et al., 1975) and in which considerable sequence and locus number variation exists among species of the same genus.
Tragopogon mirus Ownbey (Asteraceae) (2n=4x=24) is a recent allotetraploid that has formed recurrently within the last 80 years, after the introduction of its diploid progenitors T. dubius Scop. (2n=2x=12) and T. porrifolius L. (2n=2x=12) from Europe to North America (Soltis et al., 2004). In plants from most natural populations studied in the Palouse area of the northwestern USA, there are fewer rDNA units of T. dubius origin than of T. porrifolius origin (Kovarik et al., 2005). Nevertheless, T. dubius NORs are mostly transcriptionally dominant, while NORs of T. porrifolius are frequently suppressed (Matyasek et al., 2007). Among hundreds of individuals, one plant from the Rosalia population (2603-33) produced seeds that were shown to have low rDNA content (Kovarik et al., 2005). Cytogenetic analysis of germinated seedlings (33A) revealed a substantial homozygous deletion of the dominant D-genome locus (Lim et al., 2008) that reduced the number of genes in a transcriptionally dominant locus to as few as ~70 copies (Kovarik et al., 2005). A second sibling plant (33B) had the typical T. mirus rRNA gene dosage and NOR morphology. The availability of near isogenic lines (derived from the same parent) provided us with a unique system to determine whether nucleolar dominance is stable in the face of altered gene dosage. We characterized the nature of the deletion using molecular and genomic approaches. We further determined the effect of gene copy number variation on stability of NOR expression and rDNA methylation in different organs.
Materials and methods
Plant material
Seeds of a wild collected plant T. porrifolius, T. dubius and T. mirus (Soltis & Soltis 2603, from Rosalia, WA, USA) were collected during a large-scale population study of genetic variation (Kovarik et al., 2005). The seeds (S0) were grown in the greenhouse at the Institute of Biophysics, Brno. Two plants (2603-33A and 2603-33B) were self-pollinated to produce fertile seeds (>90% germination efficiency), and two lines (33A and 33B) were established (S1-S2 generation). In a hypomethylation experiment, the seedlings were treated with 20 and 50 μM 5-azadeoxycytidine for 3 days and analysed after another 3 days of growth.
Southern blot hybridisation
Southern blot procedures followed the standard protocol described in Kovarik et al. (2005). The membranes were exposed to a Storage Phosphor Screen, scanned (Typhoon 9410, GE Healthcare, Piscataway, NJ, USA) and the signal was quantified using Image Quant (GE Healthcare). The 18S-ITS1 (internally transcribed spacer 1) probe was a 500-bp BstNI fragment of a clone carrying the T. mirus sequence of T. dubius origin (Figure 1d). The 26S probe was obtained by PCR on T. dubius genomic DNA using primers annealing to the 3′ end of the 26S gene.

Schematic representation of T. dubius and T. porrifolius rDNA units. (a, b) The structures of T. porrifolius and T. dubius IGS regions, respectively, occurring between the 18S-5.8S-26S genic regions (c) are shown. The IGS includes repetitive elements (grey boxes) and the gene (P) and spacer (S) promoters. Double head arrow in (a, b) indicates a region used for bisulfite sequencing; positions of T. dubius-specific primers used for IGS amplification are marked with arrows. (d) Scheme of the ITS1 flanked by the 18S and 5.8S genes of T. dubius and T. porrifolius. The position of the probe used to detect restriction fragment length polymorphisms with BstNI is indicated by a line, along with the lengths of the restriction fragments. The arrows indicate primer positions: 18S_for, ITS_109, 5.8S_rev, por_R776, 454 MID_18S and MID_5.8S.
RNA isolation and reverse transcription
Total RNA from fresh tissues was isolated by TRIzol Reagent (Invitrogen, Carlsbad, CA, USA) following the protocol supplied by the manufacturer. The quantity of RNA was measured using a spectrophotometer, and quality was checked by formaldehyde gel electrophoresis. DNA contaminants were removed using DNase (Turbo DNA free, Ambion, Austin, TX, USA). Reverse transcription mixtures (20 μl) typically contained 1 μg RNA, 50 pmol of random nonamer primers, 10 nmol of each dNTP and 200 U of the enzyme (Superscript II RT, Invitrogen).
Cleaved Amplified Polymorphic Sequence (CAPS) analysis
CAPS analysis of the ITS1 region followed the procedures described in Matyasek et al. (2007). For PCR amplification of the ITS1 region, we used 0.2–0.4 μl of cDNA (RT–PCR mix) or 3 ng of genomic DNA. The restricted fragments were separated on a 7% polyacrylamide gel or a 1.5% agarose gel. The gel was stained by ethidium bromide, and the resulting DNA bands in the gel were visualised using ultraviolet light translumination (Ultra-Lum, Claremont, CA, USA); images were processed by the UltraQuant molecular imaging and analysis software (Ultra-Lum). Fluorescent signals were quantified by a rectangle integration method. The fluorescence intensity of the T. porrifolius-specific band was divided by the sum of all intensities of bands and expressed as a percentage.
Quantitative PCR
We used Fast Start SYBR Green mix (Roche, Welwyn Garden City, UK) and the Applied Biosystems 7300 thermocycler (Applied Biosystems/Thermo Fisher Scientific, Waltham, MA, USA). The primary rRNA transcript was amplified using the 5.8S_rev and ITS_109 primers (Supplementary Table S1). Cycling conditions were initial denaturation (95 °C/10 min) and 40 cycles of (95 °C/15 s, 55 °C/20 s, 72 °C/30 s) followed by an analytical denaturation step. The SYBR Green fluorescence was monitored after the extension step. The amount of ITS1 transcript was normalised separately to each of three different reference genes: TDF46, GAPDH and Actin. TDF46 is a protein phosphatase 2C family protein constitutively expressed in Tragopogon (Tate et al., 2006). Primer sequences are available in Supplementary Table S1. Each sample was analysed in a triplicate. Melting temperature analysis of PCR products showed single peaks (at 78–83 °C) indicating specificity. No amplification was obtained in control samples not treated with a reverse transcriptase.
Intergenic spacer amplification, cloning and sequencing
The entire intergenic spacers (IGS) from the diploid progenitors T. dubius and T. porrifolius were amplified using the 26SF and 18SR primers and conditions used in Garcia and Kovarik (2013). The PCR product was cloned, and one clone of each species was completely sequenced using two universal vector primers alongside with three IGS species-specific primers for each clone. Selective amplification of the T. dubius IGS subregion in T. mirus was carried out using T. dubius-specific primers DF and DR (Supplementary Table S1) derived from IGS sequences (GenBank # FN645941). PCR (10 μl) amplification used 3 ng of DNA, 4 pmol of each primer, 2.4 nmol of each dNTP and 0.4 U of DyNAzyme II DNA polymerase (Finnzymes, Epsoo, Finland). Cycling conditions were initial denaturation (94 °C/3 min) and 26 cycles of 94 °C/20 s, 66 °C/30 s and 72 °C/150 s, followed by final extension at 72 °C for 10 min.
454 sequencing and cluster analysis
The composite 454 sequencing primers (MID_18S and MID_5.8S) had sequencing primer A and primer B sequences at the 5′ end, unique 6-nt sorting tags and a 3′ end-specific part annealing to the 18S or 5.8S subregions (Figure 1d; Supplementary Table S1). To eliminate production of chimeric products, templates for 454 sequencing were amplified by emulsion PCR described in Matyasek et al. (2012). The reads obtained from genomic and cDNA samples were sorted according to sequencing primers into two groups comprising 18S sequences (primers A) and ITS1 sequences (primer B). In general, more than 87% of the reads (average read length was ~530 bp) were mapped to the reference sequences (Supplementary Table S2). The reference sequences used for mapping (Supplementary Figure S1) were obtained from direct sequencing of PCR products from the diploid species. The unmapped reads were mostly short or heavily mutated sequences possibly representing technical artifacts. The non-rDNA sequences were extremely rare. The reads were then sorted into clusters containing sequences with 100% identity over the aligned regions. The mapped regions included 253 bp of ITS1 and 276 bp of the 18S gene (3′ end). All alignments were performed using the Smith-Waterman algorithm with default parameters with an identity threshold E-value of e−100 and a maximum of 10 mutations per read. Mutation analysis was carried out using the Smith-Waterman algorithm implemented within the MIRA platform. Single-nucleotide polymorphisms were detected in the 454SNP/454HCDiff.files retrieved from GsMapper. On average, about 400 clusters were obtained from each sample (Supplementary Table S3). Only high-confidence clusters were considered for analysis of variants: the singletons and low-copy clusters (<1% of all reads) were disregarded; reads with indels were grouped with similar reads without indels. This treatment reduced the number of clusters to about 20. Calculations and graph constructions were conducted with the aid of Microsoft Excel.
Bisulfite sequencing
Modification of DNA with bisulfite was carried out using an EpiTect kit (Qiagen, Hilden, Germany); 1.3 μg of genomic DNA from leaves and roots of 33A and 33B plants were used. The primers did not discriminate between the P- and D-genomes and between methylated and non-methylated templates (Figure 1). The reverse primer Trag_bis_R annealed with its 3′ C to position +5 relative to the putative transcription start site (T. porrifolius—GenBank: FN666261.1, HG915911, T. dubius—GenBank: FN645941.1). The forward primer Trag_bis_F annealed to the upstream repetitive region at positions about −113, −217 and −321. PCR (20 μl) amplification used 0.6 μl of bisulfite-converted DNA as the template, 4 nmol of each dNTP, 8 pmol of each primer and 0.8 U of DyNAzyme II DNA polymerase (Finnzymes, Espoo, Finland). Cycling conditions were as follows: initial denaturation (94 °C/3 min); 30 cycles of 94 °C/20 s; 55 °C/20 s; 72 °C/20 s and a final extension (72 °C/10 min). Resulting ~370-bp products were separated by gel electrophoresis, purified and cloned into a TA vector (pDrive, Qiagen). At least 40 clones per sample were sequenced using Sanger technology. Bisulfite conversion efficiency was >97%, as assessed by analysis of a non-methylated chloroplast rbcL gene (Fojtová et al., 2001). The number of clones analysed is listed in Supplementary Table S4. The sequences were aligned and statistically evaluated using the CyMATE software (Hetzl et al., 2007).
In situ hybridisation
FISH on metaphase root tip squashes followed standard protocols (Pires et al., 2004; Lim et al., 2008). The probe against 35S rDNA was a clone that includes part of the 18S rRNA gene, the ITS1 and a part of the 5.8S gene isolated from T. dubius (Kovarik et al., 2005), which was labelled with digoxigenin-11-dUTP. The probe against 5S rDNA was the coding region of the Nicotiana tabacum 5S gene labelled with biotin-16-dUTP. Chromosomes were counterstained with 2 μg/ml DAPI (4′,6-diamidino-2-phenylindole, Sigma-Aldrich Company, Ltd, St Louis, MO, USA) in 4 × SSC and stabilised in Vectashield medium (Vector Laboratories Ltd, Peterborough, UK) before data acquisition using a Leica DMRA2 epifluorescent microscope fitted with an Orca ER camera and Open Lab software (Improvision, Coventry, UK). At least five cells per plant were scored with each probe used.
Results
Characterisation of a copy number-deficient mutant
We used Southern blot hybridisation to study the rRNA gene copies in two sibling plants of T. mirus. Genomic DNAs were digested with BstNI that has a target site in T. dubius origin, but not in T. porrifolius origin, internal transcribed spacer 1 (ITS1) sequences of the rDNA unit (Figure 1d). In both plants (Figure 2a), the ITS probe hybridised strongly to the fragment derived from the T. porrifolius parent (P-genome units), while the band corresponding to the T. dubius origin unit (D-genome units) was weaker. Quantitative evaluation of signal intensity revealed that the D-genome signal formed 25 and 4% of total rDNA signal in plants 33B and 33A, respectively. To determine the copy number of rRNA genes, we carried out Southern blot hybridisation using serially diluted ITS1 fragments (Figure 2a, left). Given that the genome size of T. mirus is known (~21 pg/4C Pires et al., 2004), it was possible to calculate the number of rRNA gene copies from the strength of the hybridisation signals. We estimate that plant 33B had about 1700 ITS1 copies (~1300 copies in the P-genome and ~400 copies in the D-genome) per haploid chromosome set, which is typical for this population of T. mirus (Rosalia; Kovarik et al., 2005). In contrast, plant 33A had less than 1400 ITS1 copies (~1300 from the P-genome and ~70 copies from the D-genome). Similar counts were obtained when probing for 18S and 26S rDNA subunits (not shown).

Genetic characterisation of rDNA in T. mirus plants 33A and 33B. (a) Southern blot hybridisation of genomic and plasmid DNA using the ITS1 probe. Left part shows a series dilution of cloned ITS1 fragments for rDNA unit copy number estimations, and right, probe hybridisation against BstNI-restricted DNAs from T. mirus and its parents, T. porrifolius and T. dubius. Units are identified as being of T. porrifolius (P-units) or T. dubius (D-units) origin. The P/D ratio is shown. (b) Detection of long and short IGS variants in T. mirus D-genome using T. dubius-specific PCR primers. (c) Detection of long and short IGS variants in T. mirus D-genome by Southern blot analysis with the SspI and BstYI restriction enzymes. Sample ‘31’ is an individual from the Rosalia population.
To determine the meiotic stability of rDNA copy number, we analysed the number of P-genome and D-genome rDNA units (P/D rDNA ratio) across two generations of 33A and 33B lines obtained from the parental S0 plants. Ten individuals from each selfing generation (S1-S2) was randomly selected and subjected to Southern hybridisation analysis. The rDNA genotypes were stably inherited in the following two generations, at least (not shown). The number of seeds and germination efficiency were comparable between both lineages (not shown), indicating that the rDNA deletion in the 33A lineage had no effect on plant viability.
Locus-specific PCR reveals deletion of a long IGS variant in the 33A line
To study IGS variants in T. mirus lines, we designed a primer pair to specifically amplify the T. dubius-origin IGS sequences. The amplicons covered a highly repetitive region downstream from the 26S gene and the conserved rRNA gene promoter (Figure 1b). In Tragopogon, this region is composed of highly homogeneous repeats of 103 or 104 bp in size (GenBank # FN645941.1, FN666261.1 and HG915911). In plant 33B, PCR amplified two products differing by ~200 bp (Figure 2b). This pattern is consistent with the presence of two abundant IGS length variants differing by two subrepeat units. The two-family pattern is seen in most individuals of T. dubius accessions and in derived allotetraploids (Kovarik et al., 2005). In plant 33A, only a short variant (S-variant) was amplified, indicating that the rDNA deletion had primarily removed the longer variant (L-variant). However, PCR does not provide quantitative information on copy numbers because the short fragments are usually amplified at greater efficiency than the long fragments. We therefore carried out Southern blot hybridisation using BstYI/SspI digested genomic DNA and a 26S rDNA probe (Figure 2c). The upper 6.2-kb band was absent in plant 33A confirming deletion of the L-variant.
Analysis of rDNA variants by NGS
We used amplicon sequencing to analyse sequence diversity of 18S and ITS1 regions of rDNA in 33B and 33A lines of T. mirus and the parental diploids, T. porrifolius and T. dubius. The resulting reads were mapped to 18S and ITS1 reference sequences (Supplementary Table S2). The aligned sequences were then sorted into clusters (Supplementary Table S3, http://doi.org/10.5061/dryad.bb249). Each cluster contained one or more unique sequence reads. Typically, we obtained >5000 reads exceeding the total number of rRNA genes in each species by more than 2-fold. In all species, there was a single cluster of 18S sequences comprising more than 90% of the reads (Supplementary Figure S2), indicating relatively recent sequence homogenisation in Tragopogon. The ITS1 reads were more heterogeneous than the 18S region, and several high-copy ribotype variants were identified:
-
1
Ribotypes in the progenitor species (Supplementary Figure S2). In T. porrifolius, there were two highly abundant variants (P1 and P2) accounting for 88.9% of rDNA. In contrast, T. dubius had a single variant (D1) comprising at least 92.8% of its rDNA.
-
2
Ribotypes in T. mirus plant 33B (Figure 3a). This plant inherited all major variants (D1, P1 and P2) from its parents. The ratio between the P-genome and D-genome reads was nearly 3:1. In addition, there was a minor D2 variant not identified in the T. dubius 2613 accession.
Figure 3 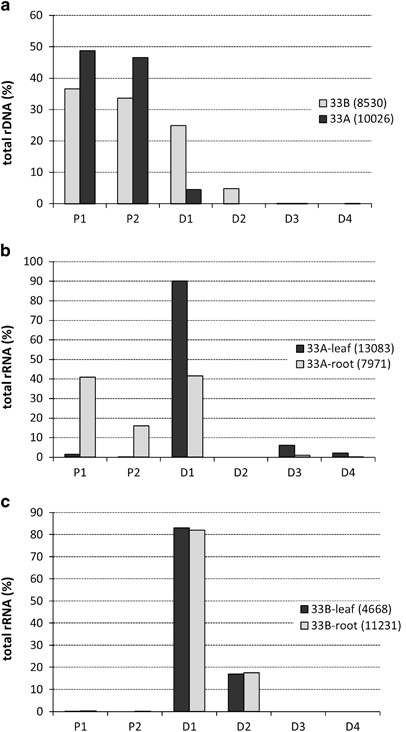
An analysis of ITS1 sequences in NGS data. ITS1 variants that are unlikely to be sequencing artifacts were clustered, and their copy numbers ascertained to estimate percentage contribution in T. mirus genomic DNA (a) and root and leaf cDNA from T. mirus plant 33A (b) and T. mirus plant 33B (c). Note in (a) the few D-genome type reads in plant 33A. In the same plant (b), there is expression of P-genome type units in roots only and the occurrence of rare ITS1 variants in leaves. This contrasts with plant 33B (c), where expression patterns are restricted to D-genome rDNA units. The number of reads is indicated in brackets.
-
3
Ribotypes in T. mirus plant 33A (carrying the rDNA macrodeletion, Figure 3a). The ratio between the P-genome and D-genome reads was nearly 20:1. These estimates were in line with those determined by Southern blot hybridisation and semi-quantitative CAPS analysis (Supplementary Table S5). Among the D-genome clusters, only the D1 variant was significantly represented. The D2 minor variant seen in plant 33B was absent even among the low-copy reads.

In both 33A and 33B plants, the P1 variant was more abundant than the P2 variant, contrasting with T. porrifolius, where the reverse is the case (chi-square test, P<0.001, Supplementary Table S3, sheet ‘statistics’, Supplementary Figure S2). These differences could be attributed to population variation in ITS ribotypes (Soltis et al., 2012; Supplementary Figure S3) and/or evolution after polyploidisation. Since quantification of variants by Next Generation Sequencing (NGS) may be influenced by PCR bias we decided to validate the results by an independent CAPS method (Supplementary Figure S3). The P-genome units were amplified from genomic DNA using a locus-specific reverse primer por_R776 annealing to a polymorphic region in ITS2 (Supplementary Table 1) and a universal 18S_for primer. The products were digested with ClaI enzyme that discriminates between the P1 and P2 variants. The ratios between the P1 and P2 variants were comparable to those calculated from NGS reads.
Expression patterns of rRNA genes analysed by cDNA-CAPS and RT-qPCR
To determine rRNA gene expression levels in different organs, we carried out cDNA-CAPS analysis. After reverse transcription and PCR, the amplification products were digested with BstNI, which cuts the T. dubius but not T. porrifolius ITS1 (Figure 1d). After digestion, the products were size separated in polyacrylamide gels (Figure 4a; Supplementary Figure S4). The results for plant 33B showed that rDNA units inherited from T. dubius had dominant expression in all tissues. The P-genome units contributed only low-level transcripts, giving rise to bands that were faint and only visible with long exposure times. In plant 33A, carrying the rDNA macrodeletion, both P- and D-genome rDNA transcripts were easily visualised in root, flower and callus. However, in leaf, only a weak band corresponding to T. porrifolius transcript was visible. The different expression patterns are shown graphically, the homeologous transcript ratios being quantified by counting the P-genome signals to total signals (Figure 4b).

Stability of nucleolar dominance in different tissues. (a) Genomic CAPS (DNA) and cDNA CAPS (cDNA) analysis in T. mirus plants 33A and 33B. (b) Band intensities from cDNA CAPS analysis were used to quantify the relative abundance of P-genome transcripts. Note how P-genome type units are transcriptionally active in some tissues of plant 33A. (c) relative rRNA expression in leaf and root. The levels of rRNA precursors were compared with the TDF46, GAPDH and actin reference genes. Expression in leaf was set to ‘1’. Averages from three biological replicates are presented.
To investigate whether the deletion affected total rRNA levels, we determined the levels of primary rRNA transcripts in leaf and root. We employed RT–qPCR using ITS_109 and 5.8S_rev primers (Supplementary Table S1) amplifying the ITS1-5.8S region. Expression levels of TDF46, GAPDH and actin were used as denominators of rRNA expression. The rRNA levels in root were expressed as a fold of the levels in leaf. Both 33A and 33B individuals showed similar expression patterns. Consistently, root had higher levels of primary rRNA transcript than leaf (Figure 4c) when compared with TDF46 and actin but not with GAPDH. Possibly, there might be differences in the expression patterns of some housekeeping genes across tissues.
Expression of rRNA gene variants determined by NGS ribotyping
We analysed expression patterns of individual rDNA variants in leaves and roots using NGS of 18S-ITS1-5.8S cDNA amplicons from plants 33A and 33B. Typically, >7000 reads were obtained from each sample. The reads were mapped to reference sequences from T. dubius and T. porrifolius ITS1 families (Supplementary Table S3; Supplementary Figure S1). As above, we clustered the reads into separate ribotypes (Figures 3b and c).
In plant 33B, only variants from the D-genome were expressed. Both D1 and D2 variants accounted for >99% of rDNA expression in both leaf and root material. The transcripts of the D1 variant were fivefold more abundant than the transcripts of the D2 variant, which is similar to their genome representation (Figure 3a). The P-genome transcripts were represented in clusters that comprised less than 0.26% of the total reads, confirming their nearly transcriptionally silent state.
In plant 33A, carrying the rDNA macrodeletion, we observed rRNA transcripts derived from both the P- and D-genomes, as well as increased heterogeneity of the variants expressed. In leaves, rRNA transcripts formed a single dominant cluster (11 786 reads) composed of the D1 variant plus two minor clusters containing D3 (802 reads) and D4 (291 reads) variants. The P-genome transcripts were represented by two minor clusters containing only 204 reads (1.3% total reads). In roots, the P-genome clusters were abundantly represented (4553 reads); both P1 and P2 variants accounted for about 57% of the total rRNA. The remaining 43% of the reads were the D1 variant transcripts. The D3 and D4 rDNA variants represented less than 1% of total reads.
RNA polymerase I promoter structure
The IGS region of T. dubius and T. porrifolius units was sequenced (GenBank # FN645941.1, FN666261.1 and HG915911). Both homeologs had the typical IGS structure of angiosperms (Figures 1a and b): there was a highly repetitive ~1.5-kb region downstream of the 26S genic subunit composed of 103 or 104 bp subrepeats, the promoter region and the ~1.2-kb externally transcribed sequence. The subrepeats in the T. dubius units were more homogeneous than those in T. porrifolius, the latter being interrupted by spacer promoters. The RNA polymerase I (Pol I) promoters were identified by homology with the Arabidopsis rDNA unit (Doelling and Pikaard, 1995). Both T. porrifolius and T. dubius IGS harboured relatively short ~130-bp promoter regions flanked by the 103-bp tandem repeats at the 5′ end. The similarity between T. dubius and T. porrifolius promoters was high in both promoter (93.3%) and flanking upstream (91.5%) regions. The transcription start site (TATATATG/AGGG, +1 is underlined) was well conserved between the species, having only a single mismatch; the putative T. porrifolius rDNA transcript starts with G, that of T. dubius starts with A.
Bisulfite methylation analysis
We analysed the distribution of cytosine methylation in the rDNA promoter region using bisulfite sequencing. Control and bisulfite-treated DNA was subjected to PCR using forward and reverse primers against the upstream repetitive region of the IGS and a unique sequence immediately downstream of the transcription start site (Figures 1a and b). The samples included DNA from roots and leaves of plants 33A and 33B. From each sample more than 40 clones were sequenced (Supplementary Table S4). The sequences were aligned and clustered according to their parental origin using several sites that enabled their discrimination. As expected, there were more (>75%) clones from the P-genome than from the D-genome, reflecting genomic representations of each type. The T. porrifolius origin Pol I promoter (−105/+5) had six symmetrical cytosine motifs (at CG and CHG nucleotides, where H is A, T or C) and 11 non-symmetrical cytosine motifs (CHH nucleotides). Their methylation status across the multiple clones is shown in Figure 5. The amount of symmetrical cytosine methylation decreased at all positions in root DNA of plant 33A compared with leaf DNA. No such tendency was observed in plant 33B. Differences in non-symmetrical CHH methylation were insignificant between root and leaf material. However, plant 33A had a significantly (P<0.01) higher level of CHH methylation than plant 33B (Supplementary Table S6). The distribution of cytosine methylation along the entire sequenced region is shown in Supplementary Figure S5.

Methylation levels of C’s in the P-genome promoter. The −105/+5 region was analysed. The horizontal axis shows the position of C’s (a) in the symmetric CG and CHG contexts and (b) the non-symmetric CHH context. Note: (a) that the level of cytosine methylation at symmetric C’s differs significantly between roots and leaves of plant 33A (Supplementary Table S6, Wilcoxon signed-rank test, P<0.05); and (b) that the level of cytosine methylation at non-symmetrical positions differs significantly between plants 33A and 33B (P<0.05).
We analysed the clones from bisulfite-treated DNA using SplitsTree to determine the phylogenetic relationships between patterns of cytosine methylation (Supplementary Figure S6). In each analysis, we incorporated virtual clones containing fully methylated and unmethylated sequences. Most clones grouped between these virtual clones, consistent with their, on average, 40% cytosine methylation. However, tree topologies differed between plants 33A and 33B: (i) Three clones from root DNA of plant 33A clustered with the unmethylated virtual clone. Further analysis revealed that these clones harboured less than 15% methylation. A further clone from root DNA of this plant clustered with the fully methylated virtual clone. (ii) Whereas most clones from plant 33B clustered to a single branch, in plant 33A, clones formed multiple independent branches. Thus, plant 33A, carrying the macrodeletion in rDNA, had higher methylation heterogeneity of rRNA genes than plant 33B.
Experimentally induced hypomethylation leads to partial re-expression of silent T. porrifolius units
To study the relationship between transcriptional silencing of rDNA and its methylation status, we treated seedlings obtained from seeds of T. mirus population 2603 with 5-azadeoxycytidine. This drug is a known inhibitor of cellular DNA methyltransferases and breaks nucleolar dominance in wheat (Neves et al., 1995) allopolyploids. The treated plants showed elevated levels of T. porrifolius-origin rRNA gene expression and reduced methylation of units (Supplementary Figure S7). However, the activation of silenced rRNA genes was not as pronounced as observed in plant 33A (root), which carries the rDNA macrodeletion.
Fluorescence in situ hybridisation analysis
To determine the condensation level of rDNA loci in plants 33A and 33B, we carried out fluorescence in situ hybridisation (FISH) and GISH (genomic in situ hybridisation) using 35S, 5S rDNA and genomic DNA probes. The diploid progenitors have been cytogenetically characterised previously (Pires et al., 2004). Briefly, T. dubius has both 35S and 5S rDNA loci located on chromosome Adu. In contrast, T. porrifolius has two NORs on chromosomes Apo and Dpo, the latter being decondensed and active (Supplementary Figure S2c; Pires et al., 2004). The 5S rDNA loci are located on chromosome Fpo (major site) and chromosome Apo (minor site). In plant 33B, the 35S rDNA probe hybridised strongly to three NORs, as expected (Figure 6b). The origin of loci was confirmed by combined FISH and GISH staining of chromosomes (Supplementary Figure S8). The locus on chromosome Adu showed a fragmented secondary constriction, consistent with local decondensation at metaphase, and a typical morphology for active NORs at the preceding interphase. Both P-genome NORs were largely condensed and inactive, forming heterochromatic knobs in interphase (Figure 6d). In plant 33A, the 35S rDNA probe hybridised to two strongly- and one weakly-labelled sites (Figure 6a; Supplementary Figure S8). The signals on chromosome Adu were minute and indistinct when decondensed. The signals on the Dpo chromosomes were largely decondensed, forming long secondary constrictions across the nucleus, indicating a morphology consistent with high levels of transcriptional activity. The Apo NOR remained condensed, as in plant 33B, in both metaphase and interphase (Figure 6c; Supplementary Figure S8). The Adu NOR harbouring a macrodeletion in the array was condensed in metaphase without significant secondary constriction.

Cytogenetic characterisation of rDNA condensation patterns in T. mirus plants 33A (a, c) and 33B (b, d). FISH with 35S rDNA (green signals) probe to root-tip metaphase (a, b) and interphase (c, d) chromosomes counterstained with DAPI (blue). The red fluorescent signals originate from 5S rDNA hybridisation (a, b). The red arrows show the 35S rDNA locus on chromosome Adu from D-genome and white arrows to loci on chromosomes Apo and Dpo from P-genome. Note in (a) the extended secondary constrictions reflecting decondensed rDNA at the Dpo chromosome locus only. Inset shows an enlarged Adu chromosome showing the small size of the 35S rDNA signal. Note in (b) that the rDNA locus on chromosome Adu is larger in plant 33B than in plant 33A and is also decondensed, probably reflecting its transcriptional activity. The position of the centromere is marked as C. Chromosome nomenclature follows Pires et al. (2004). In interphase, there were two and four heterochromatic rDNA knobs (arrowheads) in plants 33A (c) and 33B (d), respectively.
Discussion
A megabase-scaled deletion of rDNA loci in the allotetraploid T. mirus
Molecular, cytogenetic and genomic approaches revealed that T. mirus plant 33A, carrying a large rDNA locus deletion, has lost about 350 rDNA units, retaining only about 70 copies (per haploid set) in its D-genome. Assuming an average length of ~10 kb per rDNA unit, the deletion must have involved at least 3.5 Mb of rDNA, equivalent to about 0.05% of the T. mirus genome. FISH analysis reveals that D-genome rDNA copies are usually decondensed, which is a hallmark of transcription activity. Thus, the loss of these rDNA repeats in plant 33A resulted in the loss of units that were transcriptionally active.
At the rDNA unit level, the deletion occurred to a major rDNA array (D-genome) carrying units that are characterised by having long IGSs and that contain a large number of subrepeats. The deletion of D-genome rDNA repeats in T. mirus plant 33A may have arisen through an increased likelihood for illegitimate, somatic, intrachromosomal recombination between multiple subrepeats in long rDNA units. That likelihood may have been further enhanced because active, decondensed, undermethylated rDNA units may be more accessible to the recombination machinery in somatic cells (Kovarik et al., 2008) and/or targeting by transposons (Raskina et al., 2004). In support of this hypothesis, it is known that the stability of repeats, including rDNA, can depend on epigenetic factors, such as histone methylation in Drosophila (Peng and Karpen, 2007). Certainly, many allopolyploids have evolved novel repeat types that are typically less abundant than the sum of the parental genes (Kovarik et al., 2008).
Among the progeny of the wild-collected T. mirus plant 2603, including plants 33A and 33B studied extensively here, none (of 12 plants) were heterozygous for the D-genome deletion (with a d/D genotype, data not shown). There are several possible explanations: (i) plant 2603 had two germ line cell lineages leading to homozygous florets for either full-length or deleted D-genome rDNA arrays (DD or dd genotypes); (ii) heterozygous progeny (d/D) are inviable. However, this hypothesis is unsupported by the observation of normal fertility of a F1 hybrid derived from the 33A × 33B cross (not shown), or (iii) the sample size examined was too small to detect all genotypes, although we would expect half the progeny to have a d/D genotype. Interestingly, premeiotic, somatic events are reported in Drosophila that have led to rDNA locus deletion (Ritossa et al., 1966). Aberrant karyotypes can also occur at high frequencies among individuals of wild Tragopogon allotetraploids (Lim et al., 2008), reflecting meiotic instability. Potentially, karyotypic changes and deletions of rDNA units can have a profound effect on the epigenetic landscape and stability of the genome (Ge et al., 2013).
NOR deletion triggers upregulation of silent gene variants in a developmental manner
Analysis of NGS reads from rRNA samples allowed us to compare expression of individual rDNA variants in different plant organs. In plant 33B, rDNA expression was fully dominated by two rDNA variants (D1 and D2) of T. dubius origin. These variants represent >90% of the D-genome rDNA locus. The T. porrifolius-origin rDNA units were efficiently silenced in all tissues. In contrast, the expression patterns in plant 33A, which carries the D-genome rDNA deletion, differed substantially in two ways: (i) there was significant upregulation of P-genome units, generating as much as 50% of total rRNA in root and callus tissues. Of these new rRNA transcripts, the most abundant was from the P1 variant. (ii) There was transcriptional activation of minor, potentially single-copy, D-genome variants (D3 and D4) in leaf tissues. Collectively, these data suggest an expression hierarchy of rDNA variants in T. mirus leaf in the order: D1=D2>D3=D4>P1>P2. This hierarchy may be broken by developmental factors, given that de-repression of P-genome rRNA genes in root tissues was associated with the suppressed minor D3 and D4 rDNA variants, indicating epigenetic cross-talk between rDNA loci and unit variants.
The differential levels of expression of rRNA genes may be explained by a higher demand for rRNA in root and callus. In these tissues, the level of primary transcripts was several fold higher than in mature leaf tissues in both Tragopogon and Nicotiana (Koukalova et al. 2005). Certainly seventy D-genome rDNA copies may be insufficient to meet demands in rapidly dividing root and callus cells, where P-genome rDNA units are recruited. Although more thorough investigations are needed to generalise these findings, the results are consistent with reported instability of nucleolar dominance in certain plant organs (Chen and Pikaard, 1997; Komarova et al., 2004) including roots (Hasterok and Maluszynska, 2000). We hypothesise that the stability of nucleolar dominance might be influenced by the number of genes available in epigenetically ‘privileged’ locus.
Deletion of rDNA units induces epigenetic changes of the RNA polymerase I promoters
We compared methylation patterns along the Pol I promoters and adjacent upstream IGS subrepeats. In plant 33B, the P-genome loci were densely methylated at the promoters and chromatin was highly condensed, features of transcriptionally inactive rDNA locus. After the deletion of rDNA in plant 33A, several changes in methylation and chromatin condensation were identified:
-
1
There was extensive demethylation of some rRNA genes, particularly in root tissue, involving the Pol I promoter region in 3 (8%) P-genome and 1 (100%) D-genome genes. Given that transcriptionally active rDNA units are extensively demethylated in Arabidopsis (Pontvianne et al., 2013), we suggest that about 10% of P-genome rRNA genes become activated in plant 33A. Thus, there are about 130 active rDNA genes, corresponding to 70 D-genome rRNA genes and 60 P-genome rRNA genes. The 33A × 33B F1 hybrid that inherited ~470 T. dubius genes per diploid cell (400 copies from the 33B parent and 70 copies from the 33A parent) showed stable D-genome dominance in all organs (not shown). Conservatively, we propose that the upper limit of the number of rRNA genes needed to sustain growth may be around 200 genes (~400 in homozygous condition) and that ~70 copies (~140 in homozygous condition) are sufficient to cover metabolic activity in leaf but not in root cells.
-
2
Paradoxically, there was increased methylation of non-symmetrical CHH motifs in plant 33A. This type of methylation may not directly be related to gene expression in T. mirus since it occurred in otherwise extensively demethylated rDNA clones. Nevertheless, there were substantial differences in CHH methylation between plants 33A and 33B, raising a possibility that increased non-symmetrical methylation in plant 33A could be a consequence of the rDNA locus deletion. Hypothetically, reduction in rDNA repeats could have released heterochromatic factors, possibly stimulating methylation elsewhere in the genome, as recently reported in Drosophila (Paredes et al., 2011). It will be interesting to compare the epigenetic landscape in plants 33A and 33B at other loci in the genome.
-
3
There was increased chromatin decondensation at previously heterochromatic rDNA loci. Decondensation is apparent at the NOR on chromosome Dpo in all plants studied. Despite this, active NORs frequently show regions of condensed and decondensed rDNA (Figure 6b), a pattern that likely correlates with methylation heterogeneity of the rDNA units. On the basis of the methylation patterns, we estimate that less than 10% of genes may be localised in the decondensed active loci of intact, undeleted rDNA arrays, even when there is a high demand for ribosomes, as we predict to occur in the root. Surprisingly, the Adu NOR harbouring a macrodeletion did not form a macroscopic secondary constriction despite its activity. Perhaps, reduced size of the array could have stimulated chromatin condensation at metaphase or its decondensed part may not be visible in small loci.
Evolutionary scenarios following the rDNA deletion event
Plants are sessile organisms whose genetic material is frequently exposed to DNA damage (chromosome aberrations, deletions and mutations) caused by exogenous sources, such as UV radiation and chemical agents. Perhaps, plants evolved an extraordinarily high number of rRNA genes (up to tens of thousands copies) to better cope with these deleterious mutations (Kobyashi, 2011). If we assume that these mutations affect diploids and polyploids similarly, then polyploids would benefit from increased gene redundancy. In the long term, the T. mirus lineages may diverge retaining variable amounts of parental gene copies or even evolve novel variants. In support, a biparental evolution of rDNA has frequently been observed in several allopolyploid systems (Wendel et al., 1995; Mavrodiev et al., 2008; Bao et al., 2010).
Conclusion
Here, we characterised a large megabase-scaled deletion at an rDNA locus in the alloteraploid T. mirus. Deletion of the locus was correlated with tissue-specific activation of silent genes, breakdown of nucleolar dominance patterns and profound methylation changes to many of the remaining rDNA units. We found that the macrodeletion line was mitotically and meiotically stable, without negative effects on viability suggesting that deletion was fully compensated by functional partner genes. We hypothesise that compensatory mechanisms acting within homeolog networks may contribute to evolutionary success of alloplyploid species.
Data archiving
Sequence data from this article have been deposited with the EMBL/GenBank Data Libraries under accession nos: FN666261.1, FN645941.1 and HG915911. The mutation analysis of rDNA has been deposited in Dryad (http://doi.org/10.5061/dryad.bb249).
Accession codes
References
Abbott R, Albach D, Ansell S, Arntzen JW, Baird SJE, Bierne N et al. (2013). Hybridization and speciation. J Evol Biol 26: 229–246.
Adams KL, Wendel JF . (2005). Novel patterns of gene expression in polyploid plants. Trends Genet 21: 539–543.
Bao Y, Wendel JF, Ge S . (2010). Multiple patterns of rDNA evolution following polyploidy in Oryza. Mol Phylogenet Evol 55: 136–142.
Caperta AD, Neves N, Morais-Cecilio L, Malho R, Viegas W . (2002). Genome restructuring in rye affects the expression, organization and disposition of homologous rDNA loci. J Cell Sci 115: 2839–2846.
Chen ZJ, Pikaard CS . (1997). Transcriptional analysis of nucleolar dominance in polyploid plants: biased expression/silencing of progenitor rRNA genes is developmentally regulated in Brassica. Proc Natl Acad Sci USA 94: 3442–3447.
Costa-Nunes P, Pontes O, Preuss SB, Pikaard CS . (2010). Extra views on RNA-dependent DNA methylation and MBD6-dependent heterochromatin formation in nucleolar dominance. Nucleus 1: 254–259.
Doelling JH, Pikaard CS . (1995). The minimal ribosomal-RNA gene promoter of Arabidopsis-Thaliana includes a critical element at the transcription initiation site. Plant J 8: 683–692.
Flavell RB, Odell M . (1976). Ribosomal RNA genes on homoeologous chromosomes of groups 5 and 6 in hexaploid wheat. Heredity 37: 377–385.
Flavell RB, Odell M . (1979). Genetic-control of nucleolus formation in wheat. Chromosoma 71: 135–152.
Fojtová M, Kovařík A, Matyášek R . (2001). Cytosine methylation of plastid genome in higher plants. Fact of artefact? Plant Sci 160: 585–593.
Garcia S, Kovarik A . (2013). Dancing together and separate again: gymnosperms exhibit frequent changes of fundamental 5S and 35S rRNA gene (rDNA) organisation. Heredity 111: 23–33.
Ge XH, Ding L, Li ZY . (2013). Nucleolar dominance and different genome behaviors in hybrids and allopolyploids. Plant Cell Rep 32: 1661–1673.
Grandont L, Jenczewski E, Lloyd A . (2013). Meiosis and its deviations in polyploid plants. Cytogenet Genome Res 140: 171–184.
Grummt I, Pikaard CS . (2003). Epigenetic silencing of RNA polymerase I transcription. Nat Rev Mol Cell Biol 4: 641–649.
Hasterok R, Maluszynska J . (2000). Nucleolar dominance does not occur in root tip cells of allotetraploid Brassica species. Genome 43: 574–579.
Hetzl J, Foerster AM, Raidl G, Mittelsten Scheid O . (2007). CyMATE: a new tool for methylation analysis of plant genomic DNA after bisulphite sequencing. Plant J 51: 526–536.
Ingle J, Timmis JN, Sinclair J . (1975). The relationship between satellite deoxyribonucleic acid, ribosomal ribonucleic acid gene redundancy, and genome size in plants. Plant Physiol 55: 496–501.
Kobayashi T, Ganley AR . (2005). Recombination regulation by transcription-induced cohesin dissociation in rDNA repeats. Science 309: 1581–1584.
Kobyashi T . (2011). Regulation of ribosomal RNA gene copy number and its role in modulating genome integrity and evolutionary adaptiblity in yeast. Cell Mol Life Sci 68: 1395–1403.
Komarova NY, Grabe T, Huigen TJ, Hemleben V, Volkov RA . (2004). Organization, differential expression and methylation of rDNA in artificial Solanum allopolyploids. Plant Mol Biol 56: 439–463.
Koukalova B, Fojtova M, Lim KY, Fulnecek J, Leitch AR, Kovarik A . (2005). Dedifferentiation of tobacco cells is associated with ribosomal RNA gene hypomethylation, increased transcription, and chromatin alterations. Plant Physiol 139: 275–286.
Kovarik A, Dadejova M, Lim YK, Chase MW, Clarkson JJ, Knapp S, Leitch AR . (2008). Evolution of rDNA in Nicotiana allopolyploids: a potential link between rDNA homogenization and epigenetics. Ann Bot (Lond) 101: 815–823.
Kovarik A, Pires JC, Leitch AR, Lim KY, Sherwood AM, Matyasek R et al. (2005). Rapid concerted evolution of nuclear ribosomal DNA in two Tragopogon allopolyploids of recent and recurrent origin. Genetics 169: 931–944.
Leitch AR, Leitch IJ . (2008). Genomic plasticity and the diversity of polyploid plants. Science 320: 481–483.
Lim KY, Soltis DE, Soltis PS, Tate J, Matyasek R, Srubarova H et al. (2008). Rapid chromosome evolution in recently formed polyploids in Tragopogon (Asteraceae). PLoS ONE 3: e3353.
Matyasek R, Renny-Byfield S, Fulnecek J, Macas J, Grandbastien MA, Nichols R et al. (2012). Next generation sequencing analysis reveals a relationship between rDNA unit diversity and locus number in Nicotiana diploids. BMC Genomics 13: 722.
Matyasek R, Tate JA, Lim YK, Srubarova H, Koh J, Leitch AR et al. (2007). Concerted evolution of rDNA in recently formed Tragopogon allotetraploids is typically associated with an inverse correlation between gene copy number and expression. Genetics 176: 2509–2519.
Mavrodiev EV, Soltis PS, Soltis DE . (2008). Putative parentage of six Old World polyploids in Tragopogon L. (Asteraceae: Scorzonerinae) based on ITS, ETS, and plastid sequence data. Taxon 57: 1215–1232.
Mohan J, Ritossa FM . (1970). Regulation of ribosomal RNA synthesis and its bearing on the bobbed phenotype in Drosophila melanogaster. Dev Biol 22: 495–512.
Navashin M . (1934). Chromosomal alterations caused by hybridzation and their bearing upon certain general genetic problems. Cytologia 5: 169–203.
Neves N, Heslopharrison JS, Viegas W . (1995). Ribosomal RNA gene activity and control of expression mediated by methylation and imprinting during embryo development in wheat X rye hybrids. Theor Appl Genet 91: 529–533.
Nieto Feliner G, Rossello JA . (2012). Concerted evolution of multigene families and homeologous recombination. In: Wendel JF (ed) Plant Genome Diversity Vol. 1, Springer-Verlag: Wien. pp 171–194.
Paredes S, Branco AT, Hartl DL, Maggert KA, Lemos B . (2011). Ribosomal DNA deletions modulate genome-wide gene expression: ‘rDNA-sensitive’ genes and natural variation. PLoS Genet 7: e1001376.
Parisod C, Alix K, Just J, Petit M, Sarilar V, Mhiri C et al. (2010). Impact of transposable elements on the organization and function of allopolyploid genomes. New Phytol 186: 37–45.
Peng JC, Karpen GH . (2007). H3K9 methylation and RNA interference regulate nucleolar organization and repeated DNA stability. Nat Cell Biol 9: 25–35.
Pires JC, Lim KY, Kovarik A, Matyasek R, Boyd A, Leitch AR et al. (2004). Molecular cytogenetic analysis of recently evolved Tragopogon (Asteraceae) allopolyploids reveal a karyotype that is additive of the diploid progenitors. Am J Bot 91: 1022–1035.
Pontvianne F, Blevins T, Chandrasekhara C, Mozgova I, Hassel C, Pontes OMF et al. (2013). Subnuclear partitioning of rRNA genes between the nucleolus and nucleoplasm reflects alternative epiallelic states. Gene Dev 27: 1545–1550.
Raskina O, Belyayev A, Nevo E . (2004). Activity of the En/Spm-like transposons in meiosis as a base for chromosome repatterning in a small, isolated, peripheral population of Aegilops speltoides Tausch. Chromosome Res 12: 153–161.
Renny-Byfield S, Wendel JF . (2014). Doubling down on genome: polyploidy and crop plants. Am J Bot 101: 1711–1725.
Ritossa FM, Atwood KC, Spiegelman S . (1966). A molecular explanation of the bobbed mutants of Drosophila as partial deficiencies of ‘ribosomal’ DNA. Genetics 54: 819–834.
Soltis DE, Mavrodiev EV, Meyers SC, Severns PM, Zhang LJ, Gitzendanner MA et al. (2012). Additional origins of Ownbey’s Tragopogon mirus. Bot J Linn Soc 169: 297–311.
Soltis DE, Soltis PS, Pires JC, Kovarik A, Tate J . (2004). Recent and recurrent polyploidy in Tragopogon (Asteraceae): genetics, genomic, and cytogenetic comparisons. Biol J Linn Soc 82: 485–501.
Tate JA, Ni Z, Scheen AC, Koh J, Gilbert CA, Lefkowitz D et al. (2006). Evolution and expression of homeologous loci in Tragopogon miscellus (Asteraceae), a recent and reciprocally formed allopolyploid. Genetics 173: 1599–1611.
Volkov RA, Komarova NY, Hemleben V . (2007). Ribosomal DNA in plant hybrids: inheritance, rearrangement, expression. Syst Biodivers (NHM London) 5: 261–276.
Wendel JF, Schnabel A, Seelanan T . (1995). Bidirectional interlocus concerted evolution following allopolyploid speciation in cotton (Gossypium). Proc Natl Acad Sci USA 92: 280–284.
Acknowledgements
We thank Jana Kubíčková for help with sorting the SNP analysis data. We also thank anonymous referees for their insightful comments to the manuscript. We are indebted to our late colleague Dr Lim Yoong for his pioneered cytogenetic work. We apologize to those colleagues whose work was not cited due to the reference number limit. The work was supported by the Czech Science Foundation (P501/14/34632S and P501/13/10057S), NERC (UK) and the USA National Science Foundation (MCB-034637 and DEB-1146065).
Author information
Authors and Affiliations
Corresponding author
Ethics declarations
Competing interests
The authors declare no conflict of interest.
Additional information
Supplementary Information accompanies this paper on Heredity website
Supplementary information
Rights and permissions
About this article

Cite this article
Dobešová, E., Malinská, H., Matyášek, R. et al. Silenced rRNA genes are activated and substitute for partially eliminated active homeologs in the recently formed allotetraploid, Tragopogon mirus (Asteraceae). Heredity 114, 356–365 (2015). https://doi.org/10.1038/hdy.2014.111
Received:
Revised:
Accepted:
Published:
Issue Date:
DOI: https://doi.org/10.1038/hdy.2014.111
This article is cited by
-
Re-exploration of U’s Triangle Brassica Species Based on Chloroplast Genomes and 45S nrDNA Sequences
Scientific Reports (2018)
-
Epigenetic control of reproductive development
Plant Systematics and Evolution (2017)
-
Persistence, dispersal and genetic evolution of recently formed Spartina homoploid hybrids and allopolyploids in Southern England
Biological Invasions (2016)
