Abstract
Tourist movement patterns among attractions are complex and variable, and understanding such patterns can help manage tourist destinations more effectively. However, previous studies on tourist movement utilising complex networks have not explored the network motif approach comprehensively. Therefore, we adopted a network motif approach using social media data to extract and analyse motifs in a city network. This study analyses the attractions corresponding to the nodes in each motif, revealing the connection patterns between these attractions. We also discuss motifs between attractions with different types and titles. Popular attractions play a significant role in a local network while other attractions serve distinct functions within the network. This study’s findings enhance the significance of network motifs in examining tourist movement and deepen the understanding of recurring movement patterns between attractions. Moreover, they assist managers in developing policy tools for intelligent tourism destination marketing and planning that cater to tourists’ needs.
Introduction
Tourism has emerged as a leading economic activity worldwide, surpassing certain traditional industries and serving as a pivotal catalyst for international and regional economic growth. Specifically, urban tourism constitutes the cornerstone of contemporary tourism and has reached an advanced stage of competitive growth (Cárdenas-García et al., 2024; W. Su et al., 2003). Tourism has generated business prospects for numerous companies within renowned tourist cities such as Paris, New York, and Tokyo, simultaneously creating many employment opportunities for the urban population and infusing consistent economic vibrancy into such destinations (Hassan, 2000). Contemporary tourists’ movements in cities are no longer bound by rigid schedules or fixed itineraries, and their temporal and spatial flexibility is highlighted by their mobility patterns. John Urry’s ‘new mobility paradigm’ focuses on such changing nature of mobility (Korstanje, 2018; Merriman, 2012; Tzanelli, 2021; Urry (2008)).
The rapid development of information and communication technologies has led to the widespread popularisation of mobile terminal devices equipped with positioning technology. The large amount of user location data collected by these devices has significantly enhanced our understanding of tourist mobility over the past two decades (Chen et al., 2022; Chuang, 2023; Jiang & Phoong, 2023; Leng et al., 2021; Nguyen & Nguyen, 2023; Park et al., 2023; Xu et al., 2024). By leveraging these datasets, diverse research methods and theories have been used to investigate tourist mobility, including geographic information systems (Lau & McKercher, 2006), time geography (Grinberger et al., 2014; Xiao-Ting & Bi-Hu, 2012), and Markov chains (Vu et al., 2015; Xia et al., 2009). Tourism researchers have attempted to understand the essence of tourist mobility because it plays a key role in attraction marketing, event planning, and the management and design of attractions in cities. Understanding tourist mobility with a city as a single destination can help managers make refined decisions compared to tourist movement on a larger scale, such as movement between destinations. Notably, a prevalent trend involves the aggregation of individual-level mobility data into networks, which serve as a basis for analysing the topological structure of attraction systems (Vu et al., 2015).
Tourist mobility data correspond to a network structure in which tourist attractions are nodes and the spatial movement between two attractions represents bonds (Kang et al., 2018). Consequently, network analysis is a data mining technique that has been widely used to extract the connection patterns established between attractions as tourists move through a geographical space (García-Palomares et al., 2015; Han et al., 2018; Leung et al., 2012; Mou et al., 2020a; Peng et al., 2016; Xu et al., 2022; Zeng, 2018). Understanding the network characteristics of tourist attractions has practical implications for the competitiveness, management, and planning of tourist attractions (Stienmetz & Fesenmaier, 2015).
Nevertheless, most current literature employing social network analysis relies on descriptive measurements to analyse tourist mobility patterns. However, this approach hampers the assessment of the reliability and validity of the identified patterns (Park & Zhong, 2022). This study emphasises the concept of network motifs. These motifs are characterised as recurring and statistically significant subgraphs within a larger graph. As a crucial research task in complex network theory (Ahmed et al., 2017), motifs reveal functional properties based on the structural traits of network systems. Examining motifs in tourism networks enhances the understanding of how destinations are connected, how tourists move between destinations and how tourism policies affect network structure and dynamics. Moreover, in comparison with the travel motifs applied in previous studies (Park & Zhong, 2022; Yang et al., 2017), network motifs provide greater insight into individual tourist mobility at the aggregation level. Consequently, motifs can be useful in identifying the most influential or central destinations in tourism networks.
In summary, this study answers the following three questions: (1) What types of motifs do attractions constitute? (2) How are motifs linked to specific attractions? (3) How do motifs relate to attraction attributes? As the first study to use network motifs to examine tourist movement in a group manner, we select Suzhou City as the case study area and adopt social media data to extract tourists’ movements, which makes it easy to connect the nodes of the network with specific attractions. This paper proceeds as follows: The Literature Review section, as its name implies, presents a review of relevant studies on tourist mobility and network motifs. The Methodology section presents the dataset used in this study and the motif discovery method that we used to analyse it. The Results section presents an analysis of the results of motif discovery. In the Discussion section, we discuss this study’s results and implications for tourism. The Conclusion section presents the conclusions of the study.
Literature review
Research on network motifs
Network motifs are defined as patterns of interconnections occurring in complex networks at numbers that are significantly higher than those occurring in randomised networks (Milo et al., 2002). Motifs can characterise the dynamic and functional behaviour of a network, therefore enabling the classification of networks based on statistical analysis (Roy et al., 2023). Network motifs have practical implications for social relationships, protein complexes, and information infrastructures (Yu et al., 2020). Current methods for discovering network topics can be divided into two categories: network-centric and motif-centric approaches. Network-centric methods enumerate all subgraphs in a network, such as Mfinder (Kashtan et al., 2002), FanMod (Wernicke & Rasche, 2006), Kavosh (Kashani et al., 2009) and G-tries (Ribeiro & Silva, 2010). Conversely, approaches such as Grochow (Grochow & Kellis, 2007) and MODA (Omidi et al., 2009) are motif-centric. Based on subgraph symmetry, motif-centric methods search for a single query graph and then map frequencies rather than enumerate them.
Regarding the application of complex network science in the field of tourism, previous studies examine tourist flow networks from the perspective of inter-destination (Liu et al., 2017; Peng et al., 2016; Shih, 2006; Wang et al., 2020) and intra-destination (Gao et al., 2022; Hwang et al., 2006; Leung et al., 2012; Mou et al., 2020; Zeng, 2018; Zheng et al., 2021). Summarising these previous studies, two common types of metrics can be identified: network- and node-based metrics. Network-based indicators include density, efficiency, diameter, average shortest path, average clustering coefficient, and centralisation. Node-based metrics include degree (out and in), degree centrality (out and in), closeness centrality, and betweenness centrality. Furthermore, network structure analysis methods, such as structural holes and core-periphery analyses, have also been employed.
Although motif discovery is a crucial research area in network science, its application to tourism has been relatively limited. Several studies have been at the forefront of applying network motifs to the study of human mobility (Cao et al., 2019; Schneider et al., 2013; R. Su et al., 2020). In contrast to concentrating solely on subgraphs within mobility networks, researchers have introduced the concept of travel motifs, therefore expanding motifs from topological spaces to include temporal and semantic dimensions (Yang et al., 2017). To the best of our knowledge, this tourism network motif was first mentioned in a global tourism network study (Lozano & Gutiérrez, 2018). Several network motifs including transitive feedforward loops and different one and two mutual-dyads subgraphs, have been identified. Furthermore, a study conducted in South Korea introduced a network motif algorithm to examine the interconnections of travel patterns between places within the context of tourism (Park & Zhong, 2022), and disregarded only the spatial behaviour of local tourists. Moreover, because cell towers collect mobile sensor data, it is challenging to accurately determine the precise locations of mobile users and the tourist attractions corresponding to those specific locations. Therefore, this study employs social media data and links each tourist’s spatial behaviour to a corresponding attraction, therefore revealing the connection patterns among attractions.
Tourist mobility and network analysis
Tourist mobility encompasses tourists’ flow, movement, dispersal, and travel patterns across space and time (Hardy et al., 2020; Shoval et al., 2020). The analysis of spatial movement is a significant aspect of tourist mobility (Oppermann, 1995). Understanding how tourists move through time and space has important implications for infrastructure and transportation development, product development, destination planning, and planning of new attractions, as well as the management of the social, environmental, and cultural impacts of tourism (Lew & McKercher, 2006). The verifiability and reliability of tourist mobility studies can be improved through quantitative analysis; however, the results of quantitative analyses are highly dependent on the scales on which their studies are used (Jin et al., 2018; Zhang et al., 2023).
Some intra-destination mobility studies have conducted analyses at the individual level. For instance, Fennell (1996) examined tourist movements on the Shetland Islands using measures of space, time, perception, region, and core-periphery. Lew and McKercher (2006) used an inductive approach based on urban transportation to identify explanatory factors that influence tourist mobility within a destination. Early research favoured abstract methods based on fundamental tourist proposals. There is a general approach for modelling tourist mobility that is easy to reproduce, namely, the Markov model. Xia et al. (2009) used Markov chains to model tourist mobility as a stochastic process and calculated the probabilities of tourists’ movement patterns on an island. As a more practical and useful approach, using semi-Markov models is effective in deriving the probabilities of both tourist movement and the attractiveness of specific attractions (Xia et al., 2011). Furthermore, time geography is a conceptual framework used to describe and understand tourist mobility. Integrating time geography with geographic information systems tools, Grinberger et al. (2014) clustered tourists based on the time-space allocation measures of their behaviour to reveal tourists’ choices and the strategies they implemented within the constraints of time and space.
There is an increasing trend involving the aggregation of individual-level mobility data into networks as the basis for analysing the topological structure of attraction systems (Smallwood et al., 2011). Mobility patterns can be viewed as a network and are therefore subject to network analysis (Shih, 2006). Based on a core-periphery analysis of attraction networks, Zach and Gretzel (2011) analysed the structure of attraction networks and provided a strong and practical basis for technology design and tourism marketing. Leung et al. (2012) applied social network and content analyses to examine the most visited tourist attractions and main tourism movement patterns in Beijing during three distinct periods. Additionally, network methods are often used in conjunction with other analytical methods. For example, Liu et al. (2017) applied a quadratic assignment procedure to an attraction network to test the relationship between proximity and the attraction network determined by tourists’ free-choice movements. Another example is Mou et al. (2020a), who integrated social network analysis with traditional quantitative methods to develop a novel research framework. Indicators such as the Annual Gini Index and Pearson correlation coefficient can also be helpful when analysing tourists’ spatiotemporal behaviour (Zheng et al., 2021).
Motif discovery algorithms are commonly applied to gene regulation networks, electronic circuits, and neurones (Yu et al., 2020). However, studies using motif discovery methods to examine study tourist mobility are limited. It is worth mentioning that there are studies that examine travel motifs (which are extended from topological spaces to temporal and semantic spaces) to ascertain tourist mobility patterns (Yang et al., 2017). In fact, the variation in travel mobility patterns depends not only on tourists’ different lengths of stay and the topological structures of travel mobility but also on the relative proportions of each travel mobility type (Park & Zhong, 2022). However, travel motifs can only reflect the movement patterns of individual tourists rather than the movement patterns at the aggregated-individual level, let alone serve as the basis for analysing the topological structure of an attraction network (Jin et al., 2018). To the best of our knowledge, no previous study has used network motifs to examine tourist mobility at the individual-aggregation level. Only Lozano and Gutiérrez (2018) applied the network motif analysis tool offered by UCINET 6.0 to analyse the top three global tourism flows. Therefore, this study argues that the use of network motif analysis not only fills a research gap regarding tourist mobility at the aggregation level but also provides theoretical support for planning and the design of tourist attraction networks.
Methodology
Study area
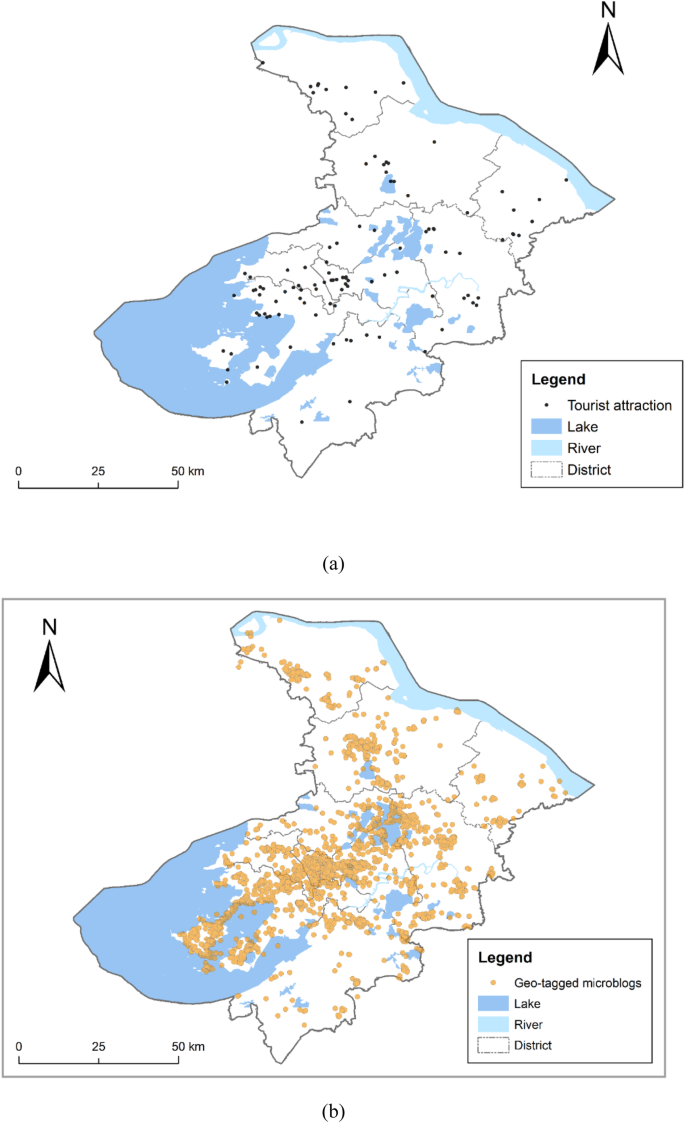
We selected Suzhou, China (Fig. 1a) as the study area. Suzhou is located in eastern China, west of Shanghai, and has a population of five million residents. With its plentiful tourism resources, Suzhou received more than 100 million domestic visitors annually before the COVID-19 pandemic. Suzhou is well-known for its cultural and historical heritage. The most popular attractions in Suzhou are its classical gardens, which were included in the World Heritage List of the previous century. Suzhou’s ancient city attractions cover an area of 14 km2. In addition to these historical attractions, Suzhou has a natural landscape with lush mountains and gleaming lakes.
Data collection and preprocessing
Social media data were primarily collected from location-based mobile phone applications. Sina Weibo, the Chinese equivalent of Twitter, is the most popular social media platform in China, with over 500 million active registered users who post 300 million microblogs daily (Kim et al., 2017). We used the application programming interface provided by Sina Weibo to crawl posts made in Suzhou from 12 April, 2012 to 31 October, 2016. The posts we crawled from the application programming interface contained various data about the users, including post identification (ID), user ID, post text, pictures, location information (longitude and latitude), and post time, as shown in Fig. 1b. Based on the user ID, we were also able to acquire users’ profile information while remaining compliant with user privacy regulations. User profile information includes registration location, gender, age, number of posts and fans, and ‘follows.’
However, only a portion of users were involved in tourism activities. We assumed that these tourists were not locals and that they had to return to their cities of residence after their trip. Referring to the double-filtration approach proposed by Su et al. (2020), we first filtered out local users based on the locations registered in their Weibo user profiles. In this study, the time difference between a user’s first and last post is defined as their length of stay. Referring to previous studies (Girardin et al., 2008; García-Palomares et al., 2015), we filtered out users who stayed longer than one month.
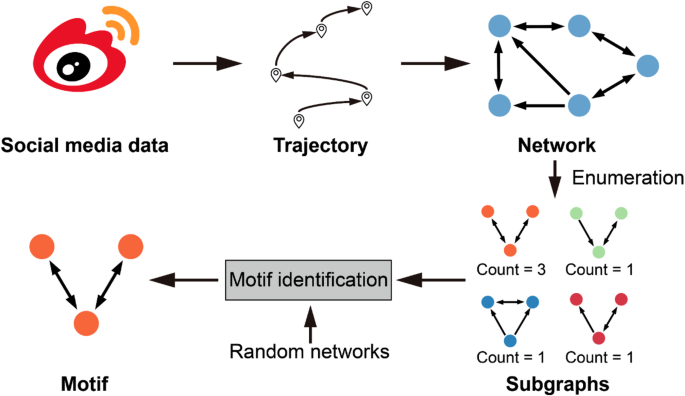
The purpose of tourism activities can be entertainment or relaxation; however, they can also be a part of official or business visits. Although official/business visits may also involve tourism activities, only visitors travelling to Suzhou of their own accord were considered tourists in our study. Therefore, during data preprocessing, we defined only users who posted microblogs within the tourist attractions shown in the Suzhou Tourism Bureau’s official list (http://tjj.suzhou.gov.cn/) as tourists. Specifically, we used the coordinates recorded in the geo-tagged microblogs to determine whether a user had visited one of the attractions on the official list. After filtering out individuals based on the criteria described above, 234,049 Weibo microblogs were obtained from 54,712 tourists. Sorting these microblogs by time gave us the of tourists’ trajectories within the city. As a result, we could map these trajectories to the directional connections between attractions to establish, a network of attractions (Fig. 2).
Extracting attractions’ connection patterns using network motif analysis
Just as attractions are represented in networks as nodes and flows as edges, tourist mobility patterns can also be transformed into complex networks (Schneider et al., 2013). Therefore, we discovered all recurrent mobility patterns related to the motifs appearing in the tourist flow network. To accomplish this, we introduced a new algorithm (Kavosh) designed to find k-size network motifs with less memory and CPU time than those required for other algorithms. The Kavosh algorithm is based on counting all k-size subgraphs of a given graph (directed or undirected). As shown in Fig. 2, the Kavosh algorithm consists of three steps: enumeration, random network generation, and motif identification. First, the algorithm enumerates all possible mobility patterns related to the subgraphs in the original network. The Kavosh algorithm groups the isomorphic subgraphs using the NAUTY algorithm. This optimisation enhances the overall process efficiency and minimises pattern redundancy. As not all patterns bear significance, the algorithm generates a large number of random networks and compares the frequency of occurrence of these patterns in all random networks. Lastly, the significance of each pattern in the input network is calculated for motif identification. Here, some statistical measures that generate probable motifs in the original network are introduced.
Frequency
This is the simplest method for estimating the significance of a motif. For a given network, we assume that Gp is a representative of an isomorphism class involved in that class. Frequency is defined as the number of occurrences of Gp in the input network.
Z-score
This measure reflects how randomly the class occurred in the input network. For the assumed motif Gp, this measure is defined as:
P-value
This measure indicates the number of random networks in which a motif, Gp, occurs more often than in the input network, divided by the total number of random networks. Therefore, the P-value ranges from 0 to 1. The smaller the P-value, the more significant the motif.
Therefore, the motifs found in the input network are available, including some related statistical measures. As mentioned in the previous step, three different measures are used in this algorithm. There are no exact thresholds for these measures to distinguish motifs; the more restricted the thresholds, the more precise the motif. According to previous experimental results (Milo et al., 2002), the following conditions can be used to describe a network motif:
-
1.
Using 1000 randomised networks, the P-value is < 0.01.
-
2.
The frequency is larger than four.
-
3.
Using 1000 randomised networks, the Z-score is > 1.
According to the above conditions, aiming to be as precise as possible, the patterns with significant measures are those that describe the network motifs.
Results
Extracted motifs of the tourist attraction network
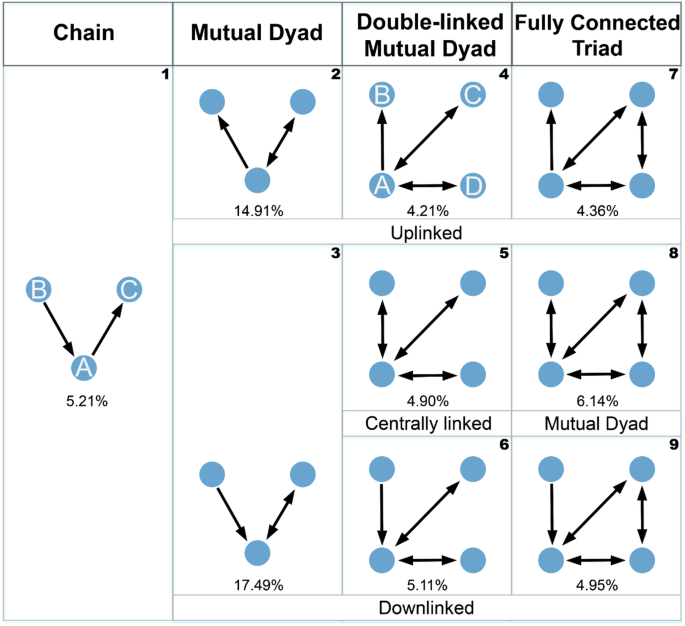
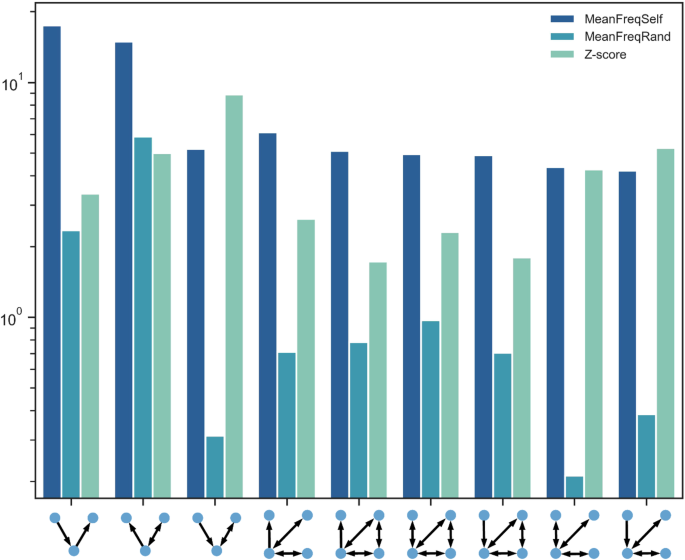
The Sina Weibo data analysed in this study encompassed 104 attractions within Suzhou City (Fig. 1a). According to the processing method described in the previous section, the data from Sina Weibo constituted a total of 2171 edges of the tourism network. When searching for k-motifs, the frequency of (k-1) motifs in the original network should be the same as that in the randomised network (Yu et al., 2020). In this study, motifs with more than four nodes did not meet the requirements for extraction; therefore, we extracted motifs with three and four nodes. We determined that a motif appeared in the network based on the criteria mentioned in the previous section. Consequently, we extracted three motifs for three-node motifs and six motifs for four-node motifs, as shown in Figs. 3 and 4.
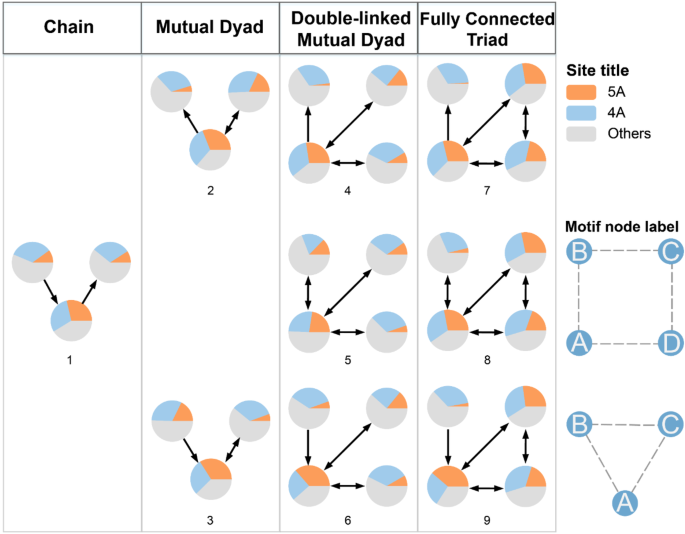
Under each motif in Fig. 3 is the proportion of that motif within the network, while the ID of that motif is in the top-right corner of each cell. Each node in the graph also contains a corresponding label, as shown by the IDs of motifs 1 and 4. The node labels of the other motifs are similar. Therefore, we did not label them all to ensure the figure remained concise. Referring to the classification of motifs in previous studies (Costa et al., 2007; Yang et al., 2017), we divided motifs into four base classes: chain, mutual dyad, double-linked mutual dyad, and fully connected triad. The chain-class motif refers to tourists visiting three attractions sequentially without returning. Similarly, a double-linked mutual dyad motif means that tourists flow in both directions between two pairs of attractions. The fully connected triad motif refers to a pair of three attractions with any two pairs flowing in both directions.
Among them, the mutual dyad, double-linked mutual dyad, and fully connected triad have uplinked and downlinked variants in their main categories. For example, if node A of the mutual dyad sends tourists to another attraction, we use the term ‘uplinked’ to describe this motif, whereas if node A receives tourists from another attraction, we describe the motif as ‘downlinked’. By analogy, these naming rules can be extended to double-linked mutual dyads and fully connected triads. The centrally linked mutual dyad and fully connected triad with a mutual dyad are two more specific variants. The centrally linked mutual dyad is based on a core attraction surrounded by three nodes with mutual circulation; however, none of the three attractions are connected to each other. A fully connected triad with a mutual dyad constitutes one fully connected triad in which one node forms another mutual dyad.
Among the abovementioned nine motifs, those with IDs 1, 2, and 3 are three-node motifs, accounting for 37.61% of the total number of network subgraphs. This indicates that the flow of tourists between any three attractions in the tourism network is dominated by chaining. This suggests that there is an order for most connections among the three attractions’ patterns. The remaining six motifs of the four nodes accounted for 29.67%, with three motifs (those with IDs 4, 5, and 6) forming around the centre point in the lower left corner. The centrally linked motif corresponds to a movement pattern referred to as a ‘basecamp’ in previous studies (Lau & McKercher, 2006; Lue et al., 1993; Oppermann, 1995), in which tourists establish one attraction as their basecamp and leave to visit other places, only to return later. In the downlinked variant, this base camp appeared as a gateway attraction for visiting attractions B and C. The motifs with IDs 7, 8, and 9 were mainly structured as a fully connected triple attraction, which comprised three closely linked attractions where tourists can move freely. In addition to this triple attraction, we also identified a relationship between one attraction and one of three attractions, exhibiting relationships of receiving, conveying, and circulating with each other. Therefore, regarding the connection patterns of the four attractions, the function of the key attractions in it is both specific and vital.
Motif interpretation: Specific attractions
In this study, all calculated motifs were the local mobility patterns of tourists that occurred at high frequencies in the original tourist network. The following analysis was performed for the distribution of attractions on each node of the extracted motifs. We selected the node with the highest degree for each motif and counted the attractions appearing in that node for all subgraphs in the tourist network. The top three attractions with the highest frequency on the highest-degree node were selected according to their frequency, as shown in Table 1. In the table, the highest-degree nodes are shown in orange.
Table 1 shows that the attractions Guanqian Street, Jinji Lake, and Pingjiang Road are the most highly placed nodes in the subgraph, indicating that these three attractions are in a relatively central position in the whole network. In other words, the network is organised around these three attractions, forming the vast majority of the local tourist movement patterns. Additionally, attractions such as Zhouzhuang and Hanshan Temple also play a key role in the local network. Zhouzhuang appears in the nodes of the motif as an attraction en route to other attractions, acting as a gateway. Generally, in motif patterns 3 and 9, tourists do not return after visiting Zhouzhuang but continue to visit attractions interconnected with Zhouzhuang, which is attributable to the long distance between Zhouzhuang and the urban area of Suzhou. The opposite is true for Hanshan Temple, whose corresponding motif patterns (2, 4, and 7) tend to be the attractions that tourists visited before they went to B through other attractions, implying that tourists all converged at that attraction before visiting other attractions. We further determined the top three attractions in node B: Tongli National Wetland Park, China Flower Botanical Garden, and Dabaidang Ecological Park. The common characteristic of these three attractions is that they all have multiple varieties of flowers with ornamental value and rich vegetation coverage, making them good places for hiking during spring.
Motif interpretation: Types and titles of attractions
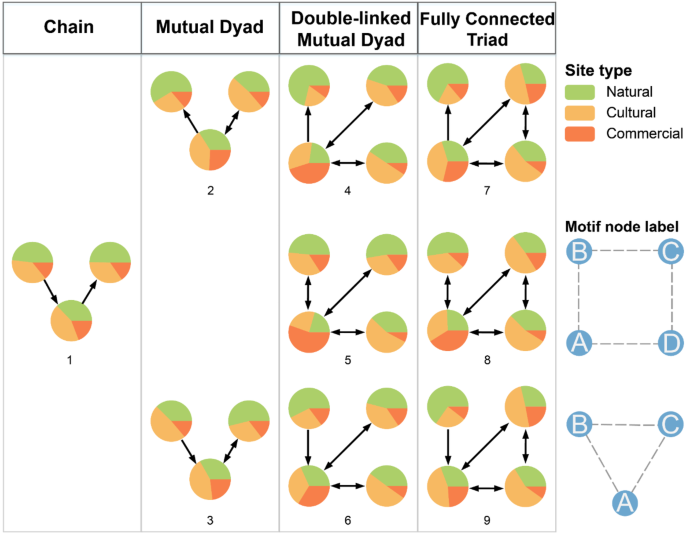
In addition to exploring the nodes with the highest degree of motifs, this study examines the types and titles of attractions on each node. According to the classification proposed by another study in Suzhou (Xue & Zhang, 2020), attractions can be classified into natural, cultural, and commercial, according to their landscape type; they may also be classified as 5A, 4A and others according to their title (A tourist attraction with a ‘5A’ score implies that it has the most beautiful scenery, the best service and perfect facilities). Fig. 5 shows the distribution of attraction types on the nodes, Fig. 6 shows the distribution of attraction titles on the nodes, while the node labels in the lower right corner of each figure are used to refer to the relative positions of the nodes on each motif. We refer to these node labels in the subsequent paragraphs.
Figures 5 and 6 show that the types of attractions on each node differ; however, the differences in the types of node attractions between each motif in each major category are relatively insignificant. This indicates that each major category of attraction connection pattern summarises a common class of tourists’ local movement patterns, while the attributes of each attraction in this movement pattern are fixed.
Types of attractions
In Fig. 5, the distribution of the attraction types of the nodes differs insignificantly in the type of attraction for the chain-type motif. Regarding the mutual dyad type, the types of node A are still relatively balanced, whereas the types dominated by nodes B and C are different and exactly opposite. Specifically, node B of motif 2 is dominated by natural-type attractions, whereas node C has more than 50% cultural attractions. Conversely, motif 3 shows the opposite pattern. The double-linked mutual dyad exhibited more obvious characteristics. First, we observe that the proportions of nodes C and D attraction types of the three motifs are identical, with the main differences appearing in nodes A and B. Second, for IDs 4 and 5, node A’s commercial attractions exhibit a significantly high proportion, which highlights their role in aggregating tourists in the local network. In contrast, for motif 6, node A primarily serves as a transit node from B to C and D, while its proportion of commercial attractions is not notably high. Lastly, in the fully connected triad, the proportion of interconnected nodes in the three motifs remains consistent. Nodes C and D are dominated by cultural attractions, whereas node A, acting as a communication hub for other attractions, exhibits a more balanced distribution of types.
Titles of attractions
In Fig. 6, the percentages of 5A and 4A attractions on nodes without attraction titles are significantly lower than those on nodes with famous attraction titles. Specifically, considering the percentage of attraction titles on each node, the difference in the percentage of B and C node levels for the chain-type motif is insignificant. Moreover, they are dominated by unpopular attractions. However, the percentage of A as a transit node for famous attractions is significantly higher than that of B and C. The situation of node A in the mutual Dyad type is similar to that of the chain type, with a higher percentage of famous attractions, whereas the situation is different for nodes B and C. Nodes B and C have the opposite ratio: when node B has a higher proportion of famous attractions, node C is dominated by non-famous attractions, and vice versa. Regarding the double-linked mutual dyad type, the proportion of famous attractions in node A is significantly higher than that in the other nodes. However, there is no significant difference in the percentage of attraction titles in the other nodes, regardless of whether it is a bidirectional flow with node A, and all of them are dominated by non-famous attractions. When there is a fully connected triad in the motif, the proportion of the three nodes that are fully connected as attractions with titles is very high, indicating that the flow of tourists between the 5A and 4A attractions is considerable. In contrast, most of the B nodes that are only connected to A nodes comprise non-famous attractions, indicating that attractions without good titles cannot establish a better connection with 5A and 4A.
Discussion
We applied network motif analytics as a novel approach for exploring the local structure of tourist networks, based on social media data. The overall structural features of the network emerged from the local relational features. To comprehend the principles of tourist network formation, it is essential to consider not only the overall network perspective but also local network connections. The results showed that attractions play an important role in local networks and that this role is related to the type and level of attractions. Therefore, enhancing the future development of tourism in Suzhou hinges on strategically guiding attractions to fulfill their appropriate service functions within the destination city.
Tourist mobility patterns
This study employs the theory of motifs, which originated from complex network science, as an innovative approach to investigating tourist mobility patterns. Originally used in the field of biology, the network motif algorithm for complex networks was applied in this study to examine the relationships between overabundant tourism mobility patterns and the corresponding attractions. Unlike previous methods for mining travel motifs, the analysis results of motif analysis in the network cannot directly extract tourists’ travel itineraries in the city. The motif-based analysis method focuses more on the movement patterns of groups of tourists between several strongly associated attractions. Based on this characteristic, network motif analysis is more suitable for observing local phenomena.
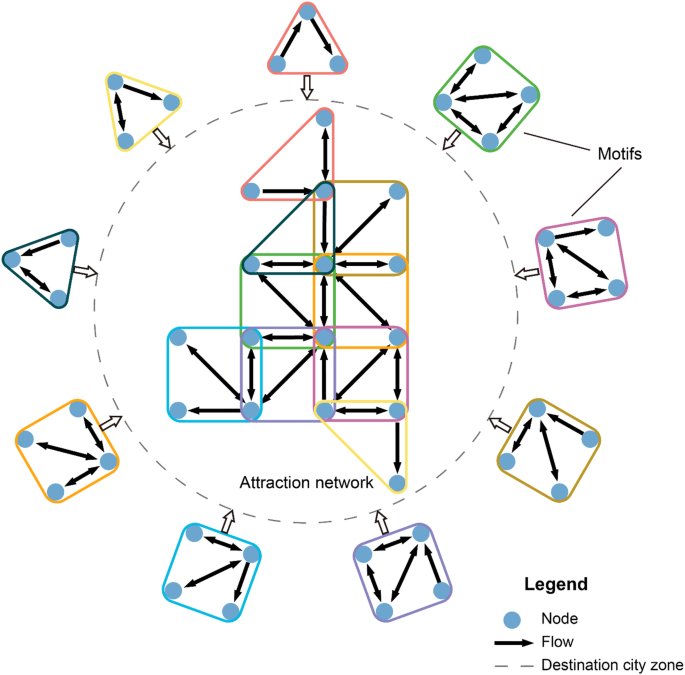
For tourist movement in urban tourist destinations, a large directed graph can be constructed for tourist movement between attrations according to the concept of network science theory. By applying the motif extraction method to this graph, we can find that it is these simple repeating topologies that make up the overall network (Fig. 7). In this study, four classes and nine motifs effectively summarised the diverse mobility patterns. This implies that despite the diversity of their travel history, humans follow simple reproducible patterns (González et al., (2008)). Understanding tourist mobility patterns enhances the comprehension of city destination systems and provides vital insights into city destination planning and development (Ashworth & Page, 2011).
Connection patterns between attractions
This study examines a tourist network’s connection patterns to identify attractions with distinct roles, including core, transit, and gateway attractions. Tourist attractions within destinations vary in significance, while the hierarchical structure of urban destination systems differs based on their appeal to tourists (Golledge, 1978). From a product-marketing standpoint, these findings help marketers understand the function of attractions in tourists’ travel itineraries and establish a foundation for the development of targeted tourism products. For example, for the core attractions, overall tourism planning should be carried out around them; for the identified transit attractions, more transportation routes should be planned for these attractions; for the gateway attractions, the hotel reception services and tourist guide services around these attractions should be enhanced. Nevertheless, the results underscore that the crucial nodes within the nine motifs are almost always composed of a few of the most renowned attractions. From a risk management perspective, an excessively concentrated destination may cause ‘overtourism’ (Peeters et al., 2018).
Implications for tourism management
Understanding tourists’ movement is essential for tourism managers to plan and implement effective sustainability strategies (Shi et al., 2017). The tourist network examined in this study reflects the movement of tourists among attractions, provides a novel approach to analyse tourist movement patterns within destinations and accurately depicts tourists’ digital footprint within destinations (Fan et al., 2024). The results show that although tourists’ detailed movement patterns among destinations are highly complex, local attractions’ connections in the network can be grouped into several patterns. This suggests that although tourists differ in preferences, there are also commonalities in their overall spatial behaviours, which helps enrich the group user profile of visiting tourists. Therefore, destinations can develop attractions and alternative attractions based on the analysis of tourist movement patterns by capturing popular travel routes (Vu et al., 2015).
Conclusions
As cities become centres of economic activity, new forms of urban tourism are becoming popular, while an increasing number of tourists are choosing cities as destinations to pursue novel, diverse, and personalised travel experiences (Füller & Michel, 2014). This study employs motif analysis in complex network science to elucidate tourist mobility patterns and depict the interconnections between attraction systems in Suzhou, China. We innovatively used actual attractions as network nodes and focused on attraction connection patterns to provide practical implications for destination management. The main conclusions are summarised as follows:
-
Referring to the motif discovery method known as Kavosh, we extracted nine motifs from a tourist network in Suzhou. These nine motifs can be categorised into four main classes: chain, mutual dyad, double-linked mutual dyad, and fully connected triad.
-
Specific attractions represented by nodes in the motifs are explored comprehensively. Suzhou’s network is organised around three attractions, namely, Guanqian Street, Jinji Lake and Pingjiang Road, which form most of the local attractions’ connection patterns. Attractions such as the Zhouzhuang and the Hanshan Temple perform specific functions in the network.
-
The types and proportions of attractions were investigated by visualising local tourist mobility patterns in the network. The results showed that nodes with a higher degree of motifs were generally well-known attractions with titles such as 5A or 4A and were dominated by cultural and commercial attractions.
These results provide a new analytical methodological framework for examining connection patterns in local attraction systems, as well as a basis for the management of attractions within urban tourism destinations.
Despite the theoretical insights and practical applications of this study, there are some limitations that must be acknowledged. For example, social media data are prone to various biases—e.g. the popularity of specific platforms among users—while the amount of data may vary by country, year and population. The bias associated with highly engaged users can result in the overrepresentation of such populations (Encalada-Abarca et al., 2023). Additionally, the data used in this study mainly reflect tourists’ spatial behaviour within a city. Because tourists’ spatial behaviour patterns within different destinations differ, it is necessary to use tourism networks within multiple destinations to establish comparisons in subsequent studies, which could help generalise this study’s findings. Future work could further explore the mechanisms of attraction selection by the mobility motifs, such as the fact that tourists are looking to maximise satisfaction when planning their itineraries.
Data availability
The datasets generated during and/or analysed during the current study are available from the corresponding author on reasonable request.
References
Ahmed NK, Neville J, Rossi RA, Duffield NG, Willke TL (2017) Graphlet decomposition: Framework, algorithms, and applications. Knowl Inf Syst 50(3):689–722. https://doi.org/10.1007/s10115-016-0965-5
Ashworth G, Page SJ (2011) Urban tourism research: Recent progress and current paradoxes. Tour Manag 32(1):1–15. https://doi.org/10.1016/j.tourman.2010.02.002
Cao J, Li Q, Tu W, Wang F (2019) Characterizing preferred motif choices and distance impacts. PLOS ONE 14(4):e0215242. https://doi.org/10.1371/journal.pone.0215242
Cárdenas-García PJ, Brida JG, Segarra V (2024) Modeling the link between tourism and economic development: evidence from homogeneous panels of countries. Humanit Soc Sci Commun 11(1):1–12. https://doi.org/10.1057/s41599-024-02826-8
Chen J, Becken S, Stantic B (2022) Harnessing social media to understand tourist travel patterns in muti-destinations. Ann Tour Res Empir Insights 3(2):100079. https://doi.org/10.1016/j.annale.2022.100079
Chuang CM (2023) The conceptualization of smart tourism service platforms on tourist value co-creation behaviours: an integrative perspective of smart tourism services. Humanit Soc Sci Commun 10(1):367. https://doi.org/10.1057/s41599-023-01867-9
Costa Lda F, Rodrigues FA, Travieso G, Villas Boas PR (2007) Characterization of complex networks: A survey of measurements. Adv Phys 56(1):167–242. https://doi.org/10.1080/00018730601170527
Encalada-Abarca L, Ferreira CC, Rocha J (2023) Revisiting city tourism in the longer run: An exploratory analysis based on LBSN data. Curr Issues Tourism:1–16. https://doi.org/10.1080/13683500.2023.2182669
Fan C, Yang Y, Mostafavi A (2024) Neural embeddings of urban big data reveal spatial structures in cities. Humanit Soc Sci Commun 11(1):1–15. https://doi.org/10.1057/s41599-024-02917-6
Fennell DA (1996) A tourist space-time budget in the Shetland Islands. Ann Tour Res 23(4):811–829. https://doi.org/10.1016/0160-7383(96)00008-4
Füller H, Michel B (2014) Stop Being a Tourist!” new dynamics of urban tourism in Berlin-Kreuzberg. Int J Urban Reg Res 38(4):1304–1318. https://doi.org/10.1111/1468-2427.12124
Gao J, Peng P, Lu F, Claramunt C (2022) A multi-scale comparison of tourism attraction networks across China. Tour Manag 90:104489. https://doi.org/10.1016/j.tourman.2022.104489
García-Palomares JC, Gutiérrez J, Mínguez C (2015) Identification of tourist hot spots based on social networks: A comparative analysis of European metropolises using photo-sharing services and GIS. Appl Geogr 63:408–417. https://doi.org/10.1016/j.apgeog.2015.08.002
Girardin F, Calabrese F, Dal Fiore FD, Ratti C, Blat J (2008) Digital footprinting: Uncovering tourists with user-generated content. IEEE Pervas Comput 7(4):36–43. https://doi.org/10.1109/MPRV.2008.71
Golledge RG (1978) Representing, interpreting, and using cognized environments. Pap Reg Sci Assoc 41(1):168–204. https://doi.org/10.1007/BF01936415
Golledge RG (1997) Spatial behavior: A geographic perspective. Guilford Press, New York
González MC, Hidalgo CA, Barabási AL (2008) Understanding individual human mobility patterns. Nature 453(7196):779–782. https://doi.org/10.1038/nature06958
Grinberger AY, Shoval N, McKercher B (2014) Typologies of tourists’ time–space consumption: A new approach using GPS data and GIS tools. Tour Geogr 16(1):105–123. https://doi.org/10.1080/14616688.2013.869249
Grochow JA, Kellis M (2007) Network motif discovery using subgraph enumeration and symmetry-breaking. In: Speed T, Huang H (eds), Research in computational molecular biology. Springer, Berlin, p 92–106. https://doi.org/10.1007/978-3-540-71681-5_7
Han H, Kim S, Otoo FE (2018) Spatial movement patterns among intra-destinations using social network analysis. Asia Pac J Tour Res 23(8):806–822. https://doi.org/10.1080/10941665.2018.1493519
Hardy A, Birenboim A, Wells M (2020) Using geoinformatics to assess tourist dispersal at the state level. Ann Tour Res 82:102903. https://doi.org/10.1016/j.annals.2020.102903
Hassan SS (2000) Determinants of market competitiveness in an environmentally sustainable tourism industry. J Travel Res 38(3):239–245. https://doi.org/10.1177/004728750003800305
Hwang Y-H, Gretzel U, Fesenmaier DR (2006) Multicity trip patterns. Ann Tour Res 33(4):1057–1078. https://doi.org/10.1016/j.annals.2006.04.004
Jiang C, Phoong SW (2023) A ten-year review analysis of the impact of digitization on tourism development (2012–2022). Humanit Soc Sci Commun. 10:665. https://doi.org/10.1057/s41599-023-02150-7
Jin C, Cheng J, Xu J (2018) Using user-generated content to explore the temporal heterogeneity in tourist mobility. J Travel Res 57(6):779–791. https://doi.org/10.1177/0047287517714906
Kang S, Lee G, Kim J, Park D (2018) Identifying the spatial structure of the tourist attraction system in South Korea using GIS and network analysis: An application of anchor-point theory. J Destin Mark Manag 9:358–370. https://doi.org/10.1016/j.jdmm.2018.04.001
Kashani ZRM, Ahrabian H, Elahi E, Nowzari-Dalini A, Ansari ES, Asadi S, Mohammadi S, Schreiber F, Masoudi-Nejad A (2009) Kavosh: A new algorithm for finding network motifs. BMC Bioinforma 10(1):1–12
Kashtan N, Itzkovitz S, Milo R, Alon U (2002). Mfinder tool guide: Technical report
Kim S-E, Lee KY, Shin SI, Yang S-B (2017) Effects of tourism information quality in social media on destination image formation: The case of Sina Weibo. Inf Manag 54(6):687–702. https://doi.org/10.1016/j.im.2017.02.009
Korstanje ME (2018) The theory of mobilities: a critical analysis. In: The Mobilities Paradox. Edward Elgar Publishing, Cheltenham, UK, p 10-37. https://doi.org/10.4337/9781788113311.00005
Lau G, McKercher B (2006) Understanding tourist movement patterns in a destination: A GIS approach. Tour Hosp Res 7(1):39–49. https://doi.org/10.1057/palgrave.thr.6050027
Leng Y, Babwany NA, Pentland A (2021) Unraveling the association between socioeconomic diversity and consumer price index in a tourism country. Humanit Soc Sci Commun 8:157. https://doi.org/10.1057/s41599-021-00822-w
Leung XY, Wang F, Wu B, Bai B, Stahura KA, Xie Z (2012) A social network analysis of overseas tourist movement patterns in Beijing: The impact of the Olympic Games. Int J Tour Res 14(5):469–484. https://doi.org/10.1002/jtr.876
Lew A, McKercher B (2006) Modeling tourist movements. Ann Tour Res 33(2):403–423. https://doi.org/10.1016/j.annals.2005.12.002
Liu B, Huang S, Fu H, Fu H, Fu H (2017) An application of network analysis on tourist attractions: The case of Xinjiang, China. Tour Manag 58:132–141. https://doi.org/10.1016/j.tourman.2016.10.009
Lozano S, Gutiérrez E (2018) A complex network analysis of global tourism flows. Int J Tour Res 20(5):588–604. https://doi.org/10.1002/jtr.2208
Lue C-C, Crompton JL, Fesenmaier DR (1993) Conceptualization of multi-destination pleasure trips. Ann Tour Res 20(2):289–301. https://doi.org/10.1016/0160-7383(93)90056-9
Merriman P (2012) Mobility, space and culture. Routledge, New York. https://doi.org/10.4337/9781800881426
Milo R, Shen-Orr S, Itzkovitz S, Kashtan N, Chklovskii D, Alon U (2002) Network motifs: Simple building blocks of complex networks. Science 298(5594):824–827. https://doi.org/10.1126/science.298.5594.824
Mou N, Zheng Y, Makkonen T, Yang T, Tang J, Song Y (2020) Tourists’ digital footprint: The spatial patterns of tourist flows in Qingdao, China. Tour Manag 81:104151. https://doi.org/10.1016/j.tourman.2020.104151
Nguyen HTT, Nguyen TX (2023) Understanding customer experience with Vietnamese hotels by analyzing online reviews. Humanit Soc Sci Commun 10:618. https://doi.org/10.1057/s41599-023-02098-8
Omidi S, Schreiber F, Masoudi-Nejad A (2009) MODA: An efficient algorithm for network motif discovery in biological networks. Genes Genet Syst 84(5):385–395. https://doi.org/10.1266/ggs.84.385
Oppermann M (1995) A model of travel itineraries. J Travel Res 33(4):57–61. https://doi.org/10.1177/004728759503300409
Park S, Zhong RR (2022) Pattern recognition of travel mobility in a city destination: Application of network motif analytics. J Travel Res 61(5):1201–1216. https://doi.org/10.1177/00472875211024739
Park S, Zu J, Xu Y, Zhang F, Liu Y, Li J (2023) Analyzing travel mobility patterns in city destinations: Implications for destination design. Tour Manag 96:104718. https://doi.org/10.1016/j.tourman.2022.104718
Peeters P, Gössling S, Klijs J, Milano C, Novelli M, Dijkmans C, Eijgelaar E, Hartman S, Heslinga J, Isaac R, Mitas O (2018) Overtourism: Impact and possible policy responses. Res Trans Comm 23:19
Peng H, Zhang J, Liu Z, Lu L, Yang L (2016) Network analysis of tourist flows: A cross-provincial boundary perspective. Tour Geogr 18(5):561–586. https://doi.org/10.1080/14616688.2016.1221443
Ribeiro P, Silva F (2010) g-tries: An efficient data structure for discovering network motifs. In: Proceedings of the 2010 ACM symposium on applied computing, p 1559–1566. https://doi.org/10.1145/1774088.1774422
Roy S, Al Musawi AF, Ghosh P (2023) Inferring links in directed complex networks through feed forward loop motifs. Humanit Soc Sci Commun 10:358. https://doi.org/10.1057/s41599-023-01863-z
Schneider CM, Belik V, Couronné T, Smoreda Z, González MC (2013) Unravelling daily human mobility motifs. J R Soc Interface 10(84):20130246. https://doi.org/10.1098/rsif.2013.0246
Shi B, Zhao J, Chen PJ (2017) Exploring urban tourism crowding in Shanghai via crowdsourcing geospatial data. Curr Issues Tour 20(11):1186–1209. https://doi.org/10.1080/13683500.2016.1224820
Shih H-Y (2006) Network characteristics of drive tourism destinations: An application of network analysis in tourism. Tour Manag 27(5):1029–1039. https://doi.org/10.1016/j.tourman.2005.08.002
Shoval N, Kahani A, De Cantis S, Ferrante M (2020) Impact of incentives on tourist activity in space-time. Ann Tour Res 80:102846. https://doi.org/10.1016/j.annals.2019.102846
Smallwood CB, Beckley LE, Moore SA (2011) An analysis of visitor movement patterns using travel networks in a large marine park, north-western Australia. Tourism Manag S0261517711001129. https://doi.org/10.1016/j.tourman.2011.06.001
Stienmetz JL, Fesenmaier DR (2015) Estimating value in Baltimore, Maryland: An attractions network analysis. Tour Manag 50:238–252. https://doi.org/10.1016/j.tourman.2015.01.031
Su R, McBride EC, Goulias KG (2020) Pattern recognition of daily activity patterns using human mobility motifs and sequence analysis. Transp Res C 120:102796. https://doi.org/10.1016/j.trc.2020.102796
Su W, Yang Y, Gu C (2003) A study on the evaluation of competitive power of urban tourism. Tour Trib 18(03):39–42
Su X, Spierings B, Dijst M, Tong Z (2020) Analysing trends in the spatio-temporal behaviour patterns of mainland Chinese tourists and residents in Hong Kong based on Weibo data. Curr Issues Tour 23(12):1542–1558. https://doi.org/10.1080/13683500.2019.1645096
Tzanelli R (2021) Frictions in cosmopolitan mobilities: the ethics and social practices of movement across cultures. Edward Elgar Publishing, Cheltenham, UK. https://doi.org/10.4337/9781800881426
Urry J (2008) Moving on the mobility turn. In: Tracing Mobilities. Routledge, New York, p 13-23. https://doi.org/10.4324/9781315550459
Vu HQ, Li G, Law R, Ye BH (2015) Exploring the travel behaviors of inbound tourists to Hong Kong using geotagged photos. Tour Manag 46:222–232. https://doi.org/10.1016/j.tourman.2014.07.003
Wang Z, Liu Q, Xu J, Fujiki Y (2020) Evolution characteristics of the spatial network structure of tourism efficiency in China: A province-level analysis. J Destin Mark Manag 18:100509. https://doi.org/10.1016/j.jdmm.2020.100509
Wernicke S, Rasche F (2006) FANMOD: A tool for fast network motif detection. Bioinformatics 22(9):1152–1153. https://doi.org/10.1093/bioinformatics/btl038
Xia JC, Zeephongsekul P, Arrowsmith C (2009) Modelling spatio-temporal movement of tourists using finite Markov chains. Math Comput Simul 79(5):1544–1553. https://doi.org/10.1016/j.matcom.2008.06.007
Xia JC, Zeephongsekul P, Packer D (2011) Spatial and temporal modelling of tourist movements using Semi-Markov processes. Tour Manag 32(4):844–851. https://doi.org/10.1016/j.tourman.2010.07.009
Xiao-Ting H, Bi-Hu W (2012) Intra-attraction tourist spatial-temporal behaviour patterns. Tour Geogr 14(4):625–645. https://doi.org/10.1080/14616688.2012.647322
Xu T, Chen R, Chen W, Zheng L, Zhang Y (2022) Comparing the spatiotemporal behavior patterns of local, domestic and overseas tourists in Beijing based on multi-source social media big data. Asia Pac J Tour Res 27(7):692–711. https://doi.org/10.1080/10941665.2022.2119419
Xu J, Su, T, Cheng X, Chen H (2024) Exploring the destination network in the context of tourism mobility: a multi-scale analytical framework. Curr Issues Tour. https://doi.org/10.1080/13683500.2024.2334830
Xue L, Zhang Y (2020) The effect of distance on tourist behavior: A study based on social media data. Ann Tour Res 82:102916. https://doi.org/10.1016/j.annals.2020.102916
Yang L, Wu L, Liu Y, Kang C (2017) Quantifying tourist behavior patterns by travel motifs and geo-tagged photos from Flickr. ISPRS Int J Geo Inf 6(11):345. https://doi.org/10.3390/ijgi6110345
Yu S, Feng Y, Zhang D, Bedru HD, Xu B, Xia F (2020) Motif discovery in networks: A survey. Comput Sci Rev 37:100267. https://doi.org/10.1016/j.cosrev.2020.100267
Zach F, Gretzel U (2011) Tourist-activated networks: Implications for dynamic bundling and en route recommendations. Inf Technol Tour 13(3):229–238. https://doi.org/10.3727/109830512X13283928066959
Zeng B (2018) Pattern of Chinese tourist flows in Japan: A Social Network Analysis perspective. Tour Geogr 20(5):810–832. https://doi.org/10.1080/14616688.2018.1496470
Zhang Y, Guo X, Su Y, Koura H, Wang Na, Song W (2023) Changes in spatiotemporal pattern and network characteristics in population migration of China’s cities before and after COVID-19. Humanit Soc Sci Commun 10:673. https://doi.org/10.1057/s41599-023-02201-z
Zheng Y, Mou N, Zhang L, Makkonen T, Yang T (2021) Chinese tourists in Nordic countries: An analysis of spatio-temporal behavior using geo-located travel blog data. Comput Environ Urban Syst 85:101561. https://doi.org/10.1016/j.compenvurbsys.2020.101561
Acknowledgements
Special thanks to Prof. Yang Xu for his advice in writing and conceptualization. This study was supported by the National Natural Science Foundation of China under Grant [number 41830645] and Yunnan Provincial Science and Technology Project at Southwest United Graduate School [number 202302AO370012]. The first author - Ding would like to thank to his fiancée, Lanqi Liu, for her help in coding and figure drawing. And her encouragement during Ding’s hard time was key to the final publication of this paper.
Author information
Authors and Affiliations
Contributions
Ding Ding: Conceptualization of this study, Methodology, Formal analysis, Investigation, Visualization, Writing - Original Draft. Yunhao Zheng: Conceptualization, Methodology, Visualization, Writing - Reviewing and Editing. Yi Zhang: Conceptualization, Data Curation, Validation, Writing - Reviewing. Yu Liu: Resources, Writing - Reviewing, Project administration, Supervision, Funding acquisition.
Corresponding author
Ethics declarations
Competing interests
The authors declare no competing interests.
Ethical
Ethical approval is not required as the study does not involve human participants.
Informed consent
This article does not contain any studies with human participants performed by any of the authors.
Additional information
Publisher’s note Springer Nature remains neutral with regard to jurisdictional claims in published maps and institutional affiliations.
Rights and permissions
Open Access This article is licensed under a Creative Commons Attribution 4.0 International License, which permits use, sharing, adaptation, distribution and reproduction in any medium or format, as long as you give appropriate credit to the original author(s) and the source, provide a link to the Creative Commons licence, and indicate if changes were made. The images or other third party material in this article are included in the article’s Creative Commons licence, unless indicated otherwise in a credit line to the material. If material is not included in the article’s Creative Commons licence and your intended use is not permitted by statutory regulation or exceeds the permitted use, you will need to obtain permission directly from the copyright holder. To view a copy of this licence, visit http://creativecommons.org/licenses/by/4.0/.
About this article
Cite this article
Ding, D., Zheng, Y., Zhang, Y. et al. Understanding attractions’ connection patterns based on intra-destination tourist mobility: A network motif approach. Humanit Soc Sci Commun 11, 636 (2024). https://doi.org/10.1057/s41599-024-03093-3
Received:
Accepted:
Published:
DOI: https://doi.org/10.1057/s41599-024-03093-3

