Abstract
This study investigates the intricate and enduring interplay of historical events, human activities, and natural processes shaping the landscape of North European Plain in western Poland over 230 years. Topographic maps serve as reliable historical data sources to quantify changes in forest, grassland, and wetland areas, scrutinizing their fragmentation and persistence. The primary objectives are to identify the permanent areas of the landscape and propose a universal cartographic visualization method for effectively mapping these changes. Using topographic maps and historical data, this research quantifies land cover changes, especially in forest, grassland, and wetland areas. With the help of retrogressive method we process raster historical data into vector-based information. Over time, wetlands experienced a substantial reduction, particularly in 1960–1982, attributed to both land reclamation and environmental factors. Grassland areas fluctuated, influenced by wetland and drier habitat dynamics. Fragmentation in grassland areas poses biodiversity and ecosystem health concerns, whereas forested areas showed limited fluctuations, with wetland forests nearly disappearing. These findings highlight wetland ecosystems’ sensitivity to human impacts and emphasize the need to balance conservation and sustainable development to preserve ecological integrity. This study advances landscape dynamics understanding, providing insights into historical, demographic, economic, and environmental transformations. It underscores the imperative for sustainable land management and conservation efforts to mitigate human impacts on ecosystems and biodiversity in the North European Plain.
Introduction
Land cover plays a significant role in the environment and human life, determining the landscape and character of an area, the species of plants and animals inhabiting a given territory, as well as the economic1,2 and touristic3,4 potential of the lands. Human activity, along with the development of settlements, agriculture, and later industry, has led to transformations in the natural landscape5,6. The intensification of this intervention is also facilitated by population growth and technological advancement. Humans alter the landscape to accommodate their needs, and with the advancement of knowledge, this can be done in a more responsible and sustainable manner.
It is widely accepted that the analysis of alterations in land cover since the pre-industrial era could reveal pivotal events in Land Use and Land Cover (LULC) changes, particularly evident in the context of long-term change studies derived from topographical sources7,8. The analysis of LULC changes holds significance as it serves as a vital indicator required for the realization of the United Nations' Sustainable Development Goals (SDGs)9,10,11. LULC change studies based on topographic materials often focus on several elements such as grasslands, forests, urban areas, or arable land12,13,14.
In the context of Forest Transition Theory15,16, the forest lands in the European Plains were cleared for agricultural purposes17,18, while the remaining areas were heavily managed for timber production19,20. As a result, many countries in the region have implemented policies and programs aimed at promoting sustainable forest management practices, conserving biodiversity, and protecting forest ecosystems21,22, which might be recognized as a reversal of the deforestation trend23.
To track changes in Land Use and Land Cover (LULC) and incorporate them into a specific theoretical trend, methods based on the analysis of topographic maps are employed, as observed in the case of mountain landscapes24,25,26,27,28. Some research has focused on parts of the European Plain29,30,31,32 incorporating grasslands that have consequently disappeared and fragmented due to agricultural development33,34.
In recent years, the drainage of wetlands for agriculture has slowed down in Europe, but the wetlands continue to face threats from urbanization and other forms of development35,36 as well as climate change37. However, it is rare to find scientific research that examines the wetlands, their changes, and stability in Greater Poland based on topographic materials from the eighteenth century38,39. These processes might lead to rapid and abrupt changes, resulting in a regime shift that limits the possibility of predicting future changes40,41.
Therefore, the question arises: Have there been such significant changes in the area of forests, meadows, and wetlands over the past 230 years on the Kościan Plain that their continuity has been interrupted?
Cartographic visualizations depicting changes in land cover can assume two distinct approaches42. The first option entails an analytical approach, where the presentation method and data granularity allow for a detailed investigation of changes. Such visualizations can be challenging to interpret, and their users are typically experts who utilize them as tools for studying and understanding the phenomenon43. In such cases, geographic visualization (geovisualization) is often employed, involving interactive tools to enhance analysis efficiency44,45,46,47. The second approach involves simplifying the data, making the information more easily communicable in a graphical manner, thereby reaching a broader audience.
Another research question that arises is: How can cartographic visualization reveal permanent landscape features since the eighteenth century using topographic maps?
The goal of this study is to assess changes in forest, grassland, and wetland area and recognizing permanent areas in the Kościan Plain in Poland on the European Plain over the past 230 years on a topographical scale, using topographic maps. Specifically, we aim to assess changes in forest, grassland, and wetland area, their fragmentation, and durability. We also propose a universal method for cartographic visualization to support the visualization of changes in forest, grassland, and wetland areas in the North European Plain.
The main research hypothesis posits that the existence of permanent areas within grasslands and forests on the Kościan Plain has played a crucial role in preserving these landscapes over the past 230 years. These permanent areas, coupled with the conservation of drainage canals, have been instrumental in sustaining substantial portions of permanent grasslands and forests despite landscape alterations. The second research hypothesis is that the cartographic method proposed in a local study will allow determining the location and area of forests, grasslands and wetlands that have a permanent character. Unlike other studies of this type that have been mentioned here, we would also like to include wetlands in the landscape analysis. Wetlands are not a common element of analysis based on cartographic materials. Moreover, we aim to supplement this type of research with a universal method of cartographic presentation that can be employed regardless of the type of landscape.
Materials and methods
Study area
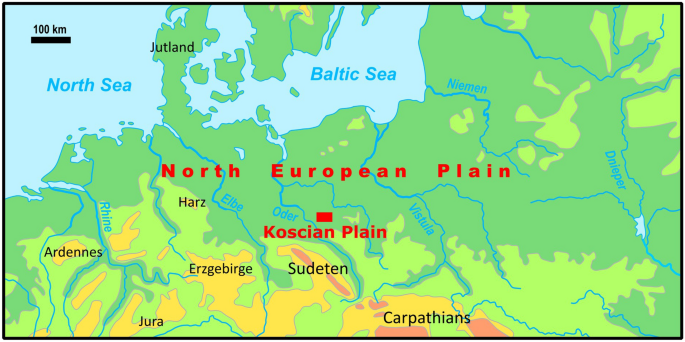
The Kościan Plain is a significant geographic region within the context of the North European Plain, located in western Poland (Greater Poland, Wielkopolska), covering an area of 194 km2, as illustrated in Fig. 1. It is distinguished by its relatively flat topography, fertile soils, and a mosaic of land cover types, including forests, grasslands, and wetlands. This region plays a crucial role in the broader North European Plain, extending from the southern coast of the Baltic Sea to the Alpine foothills in the south.
Representativeness of the Kościan Plain for the North European Plain in the context of cartographic materials results from access to credible and continuous cartographic material (including the first professional topographic maps created in the eighteenth century) compared to similar consistent materials, e.g., Lower Saxony, Brandenburg, the Netherlands, Greater Poland, and Mazovia48,49,50,51. The territorial limitation of our research to the shape and size of map sheet and regular sheet division for topographic map aimed to propose a universal methodological approach to each fragment of the North European Plain, as its elementary part.
Forests have been an essential feature of the Kościan Plain’s landscape, contributing to its ecological diversity and providing numerous ecosystem services. The changes in land cover in the Greater Poland (Wielkopolska) were documented the impact of deforestation for agricultural expansion and urban development39. Additionally, the effects of afforestation efforts on restoring forest ecosystems and their implications for the spread of the pollutions in ground waters and in soils were investigated52.
Due to changes in land cover, some grasslands, which have a permanent character53, not only reduce their surface area, but also their functionality54. Historically, grasslands have been an important part of Poland’s landscape, providing habitat for a wide variety of plant and animal species55,56. However, in recent years, many grasslands have been lost or degraded due to changes in land cover, such as the conversion of grasslands to agriculture or urban areas, and the abandonment of traditional land management practices57. In addition, the loss of grasslands can also have negative impacts on soil quality, water retention, and carbon storage58,59. To address these challenges, efforts are underway in Poland to protect and restore grasslands60. Grasslands have also been a crucial component of the Kościan Plain’s land cover. Traditionally used for sustainable agriculture and livestock grazing, grasslands have faced significant transformations due to agricultural intensification and changes in land management practices61. They also had the flood protection function. Research by Kozaczyk62 examined the water regulation impact on the permanent grasslands and their exploitation.
Historically, large areas of wetlands were drained for agricultural purposes, particularly in the Netherlands, Germany from the sixteenth century, and later in also Poland63. In western Poland, land reclamation was carried out on a small scale in the nineteenth century and on a much larger scale in the twentieth century, especially in the 1960s and by the early 1980s62,64. Wetlands, including marshes and peatlands, were once abundant in the Kościan Plain, contributing to water regulation, carbon sequestration, and wildlife habitat. However, Mizgajski65 highlighted the alarming decline of wetlands in the region due to drainage and land reclamation for agricultural purposes, especially in the nineteenth century. This has raised concerns about the loss of valuable wetland ecosystems and the potential implications for flood control and water quality.
Understanding the changes in forest, grassland, and wetland cover in the Kościan Plain is essential in the context of broader European Plains. It allows us to assess the impacts of land cover changes on regional biodiversity, ecosystem services, and environmental sustainability. The integration of this regional knowledge into broader European studies, such as those conducted by Wulf and Gross66 on pan-European land cover changes, enables a comprehensive understanding of the complex interactions between human activities and the natural environment across the continent.
Data
For research on land cover in the European Plain for Western Poland, there is high potential but still unexplored.
Manuscript topographical maps from the second half of the eighteenth century constitute a unique documentation of pre-industrial space in Europe. This uniqueness results not only from the fact that these are the first cartographic records occurring in a single copy, but also from the fact that they are based on direct field observations. Field mapping was executed through table sketches using surveying tools and observations49. Due to their specific cartometric nature and interpretational possibilities, these works have been the subject of few studies until now48,50,67.
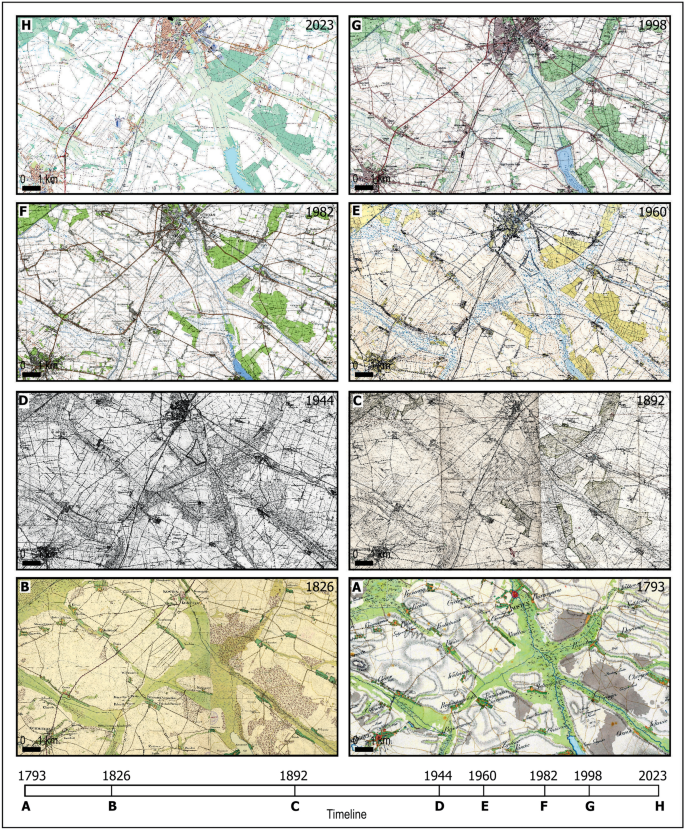
Table 1 presents a set of source maps with the following information: map name, publication year/years, scale, author/institution, provenance/owner, and publication technique. The year associated with each map in Table 1 indicates the approximate year in which forest, meadow, and wetland areas were mapped.
Figure 2 depicts the appearance of individual maps listed in Table 1 covering the study area (A-H) at a reduced scale.
Topographic maps of Kościan Plain from 1793 to 2023, according to the description in Table 1. An illustrative timeline is provided below the maps, aiding in conceptualizing the time intervals that separate various land cover states recorded in the source cartographic materials.
Visualization and data processing
Our method of result visualization will be a cartographic presentation method, which results from the overlapping of areas. Distinct extents represent wetland areas. The preparation of this type of visualization is preceded by data acquisition through the retrogressive method.
The retrogressive method in landscape studies involves examining landscapes by retracing steps from a more recent time period back to progressively older periods68,69,70,71. In cartographic studies, the retrogressive method is an approach that involves the analysis and interpretation of historical maps, charts, or aerial photographs to understand changes in land cover and landscape over time72. This method allows cartographers and researchers to examine past land cover patterns and identify historical trends and transformations in the landscape73,74. While older cartographic materials may lack the precision of modern surveys, they provide crucial baseline information for assessing historical land cover patterns and natural features with the use of modern GIS software75,76.
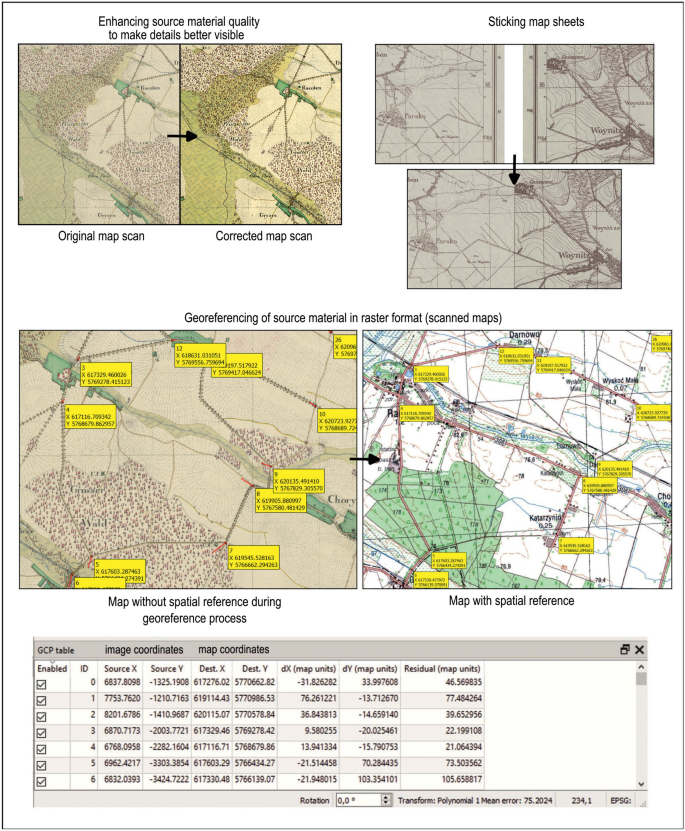
The foundation for the retrogressive vectorization of forest, grassland, and wetland from paper maps is georeferencing their scanned raster form to the current coordinate system to achieve the lowest possible root-mean-square error (RMSE), which, in the case of topographic maps, is approximately 1–2 mm on a paper map77. Considering the georeferencing methods of old maps75, we applied first-degree affine transformation to the currently valid UTM (Universal Transverse Mercator) coordinate system for topographic maps, zone 33, EPSG: 32,633 (Table 1).
Figure 3 illustrates an example of the retrogressive georeferencing process for a map from 1826. It is visible on the left side, with control points overlaid that correspond to identical, identifiable points on the contemporary reference map with spatial context. In this case, the same road intersections were identified on both maps.
Based on the harmonization of the existing legends for the six newest maps from 1892 to 2023, the construction of the legend for the oldest map from 179348,49,51,67 and supplementation with cartographic signs not appearing in the legend but visible on the map from 182678,79, the following land cover categories were defined for research: forest, grassland, wetland, wet forest, wet grassland.
For vectorization, objects from the previous state were utilized to retain shapes where there were no changes in the defined land cover boundaries or to modify only a portion of an object's shape. In order to preserve topological rules during the vectorization process, appropriate settings in GIS software were enabled, including snapping options such as topological editing, snapping tolerance, or prevention of polygons overlapping (“avoid overlap”). The layers were automatically checked by GIS software to identify features that could potentially have invalid geometry. Any such errors were subsequently fixed.
Results
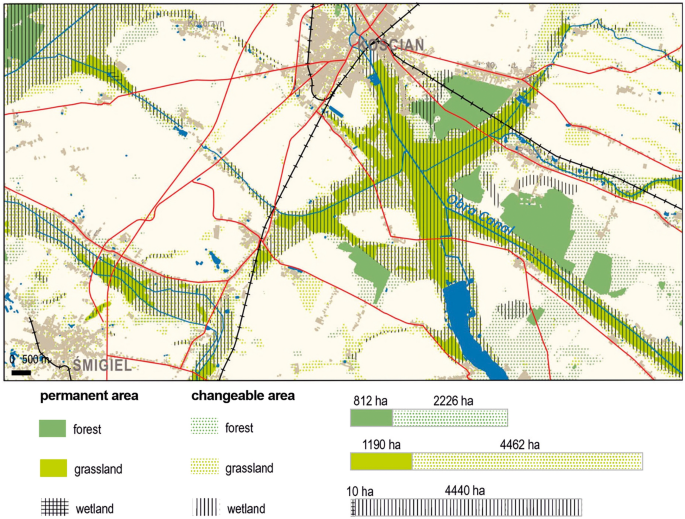
The use of appropriate cartographic visualization allowed to reveal those spatial relationships that would not be visible on individual maps. For this reason, in Fig. 4, we can observe the elements of the landscape that have undergone spatio-temporal changes and those that have remained unchanged for 230 years, starting from 1793. Firstly, we can distinguish a large area of grasslands, which are located in the main line of canals and rivers. Secondly, we can distinguish large patches of forest in the vicinity of Kościan, which also in their core have not changed over this time. Both in the case of grasslands and in the case of forests, the core of the area has remained unchanged, while a certain envelope of these areas can be distinguished, which has fluctuated over the years.
Long-term changes in forest cover
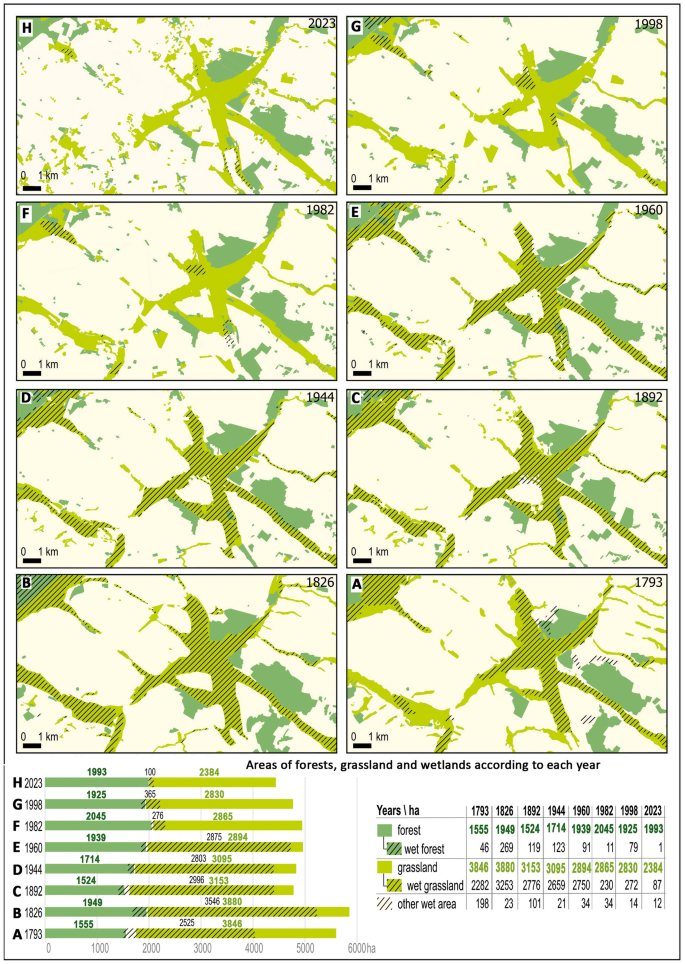
In 1793, the area of forests on Kościan Plain was 1555 ha. This forested area expanded to 1949 ha by 1826, but it decreased once more to 1524 ha in 1892. Over the subsequent years, the forested land gradually increased, reaching 2045 hectares by 1982. This peak acreage was slightly reduced, and as of 2023, the forested area stands at 1993 hectares. Throughout the period of 230 years, larger forested segments maintained or even expanded their acreage, with only a few smaller forested spots disappearing. Conversely, new areas were afforested.
Currently, in the structure of the Kościan Plain, there are nearly no forests growing on wetlands. However, in the past, such land cover were present to a slightly greater extent, especially in the year 1826 when the area of forests growing on wetlands reached as high as 14%.
Long-term changes in grassland cover
In 1793, the area covered by grasslands was estimated as 3846 ha. The majority of this land was situated in wetland areas, (2282 ha), while non-wetland habitats overgrown by grasslands accounted for 1564 ha. The grassland area underwent substantial growth by 1826, expanding to 3880 ha. This expansion was primarily attributed to the significant increase in wetland grasslands, which encompassed 3253 ha, whereas grasslands in drier habitats decreased dropping to 627 ha.
Subsequently, by 1892, the grassland area was decreasing, both in wet and drier habitats and it was 2776 ha and 377 ha respectively. Over the next 50 years, land management remained relatively stable, with a slight increase in grasslands within drier habitats and a decline in wetlands. In 1960, a decrease in grassland coverage was observed, with wetland grasslands expanding to 2750 ha, while only 144 ha of grassland persisted outside of wetlands. Overall grassland coverage diminished by 201 ha, reaching 2894 ha.
By 1982, the total grassland area remained nearly constant (decreasing by only 29 ha). However, a significant decline in wetland grasslands (only 230 ha) was noted, with drier habitats taking their place (2626 ha). The situation exhibited stability through 1998, but by 2023, the overall grassland area had diminished by 2487 ha. This reduction included merely 87 ha of wetland grasslands, accompanied by a decreasing extent of other grasslands.
Over the past 230 years, grasslands have undergone profound changes in their surface area and habitat types, but the main grassland complexes have maintained their location along the watercourses. Nevertheless, a strongly advanced unfavorable process of fragmentation of grassland areas is visible. In recent years, new grasslands have been established in many drier areas, but these are mostly very small enclaves.
The second of the developed cartographic visualizations serves as a synthesis of the results of landscape changes throughout the entire time analysis (Fig. 5).
Long-term changes in wetland cover
In 1793, a significant portion of the landscape, covering 2525 hectares, was comprised of wetlands, with the majority of it being utilized as grasslands (90%), while the forested wetland area was marginal (2%). By 1826, the wetland area had notably expanded to 3546 hectares, maintaining its predominant use as grasslands (92%). Over the following century, the wetland area gradually decreased, and by 1960, it had dropped to 2875 hectares, with grasslands still dominating (96%).
In 1982, a drastic reduction in the wetland area was detected, leaving only 276 hectares remaining, consisting mainly of wetland grasslands (87%) and some wetland forest (12%). The wetland area experienced a slight increase, reaching 365 hectares in 1998. However, by 2023, only 100 hectares of wetlands remained.
Discussion
The Kościan Plain remained relatively untouched by industry, with sustainable agricultural practices and limited urbanization due to a small human population in 1793. However, local timber harvesting for construction, fuel, and other needs may have been prevalent55.
The most significant changes were observed in the wetland area. Over 200 years, a progressive drying of habitats occurred. This slow process over 150 years was primarily driven by water regulation and land reclamation efforts initiated in the nineteenth century37,65. In 1982, a dramatic reduction in wetland area occurred, with only 276 hectares remaining, primarily consisting of wetland grasslands (87%) and some wetland forest (12%). The wetland area experienced a slight increase, reaching 365 hectares in 1998. However, by 2023, only 100 wetlands remained. This was primarily the result of large-scale land reclamation efforts initiated in the late 1960s and carried out during the 1970s to the early 1980s62,64.
On the one hand spatial arrangement of the landscape within the designated preservation areas in the Greater Poland Province reveals that these protected regions exhibit a notably rich and diverse array of natural elements, with a high density of different natural units80. On the other hand there was an increase in the share of agricultural areas by 73–81% and an increase in forest areas by 10–16.4% in the communes of Kościan and Śmigiel in the period between 1989 and 200539. Therefore, both of these growths, which are also visible from the study results (with a 7.9% increase in forest cover), could have been influenced by the decrease in grasslands by 6.2%.
The transition towards afforestation, observed between 1944 and 1960, exemplifies a broader trend in land management practices across Europe81. Over this temporal span, a discernible trend emerges, indicating a transition towards afforestation of previously cleared lands23. This pattern reflects urbanization processes that may result in the abandonment of land, facilitating forest regrowth, a phenomenon observed in the Greater Poland Province82 or in the Carpathians83. The efforts to expand forest cover during this timeframe demonstrate a concerted endeavor to restore ecosystem services, enhance biodiversity, and mitigate the environmental impacts of human activities.
Grasslands have seen significant surface area changes and shifts in habitat types over the past 230 years. While the main grassland complexes have generally remained along watercourses, there is evidence of a notable unfavorable trend of fragmentation in grassland areas. Recent years have witnessed the establishment of new grasslands in drier areas, albeit in smaller enclaves. The decline and fragmentation of grasslands can be attributed, in part, to the intensification of agricultural production in Europe, as noted by Cousins33 and Kiviniemi and Eriksson34. This trend is not unique to the Kościan Plain but is a global phenomenon affecting various landscapes, including mountains, boreal regions, lowlands, and islands, as documented by Monteiro et al.27 and Aune et al.84.
The suggested method for studying the area using the topographic map sheet aimed to be universal, applicable to all handwritten topographic maps from the eighteenth century for the North European Plain49. The Map of Lower Saxony (Kurhannoversche Landesaufnahme 1764–1786) serves as an example of a handwritten topographic map for which the proposed method can be applied here due to the circumstances of the map's creation. The constant increase in the number of citizens in the Hanoverian Electorate had led to the necessity of expanding cultivable areas, including the drainage of wetlands, starting from the late seventeenth century. This need to cultivate moors and drain other extensive wastelands in Lower Saxony prompted efforts to create detailed maps51.
Conclusions
Overall, the landscape changes on the Kościan Plain reflect a complex interplay between historical events, human activities, and natural processes. In conclusion, the existence of stable permanent areas in both grasslands and forests has contributed to the overall preservation of these landscapes on the Kościan Plain. The conservation of these permanent areas, along with the preservation of drainage canals, has played a vital role in maintaining a significant portion of permanent grasslands and forests.
This study successfully achieved its goal of quantifying changes in forest, grassland, and wetland areas and their distribution in the Kościan Plain, Poland, on the European Plain over the past 230 years. To achieve this objective, we utilized topographic maps as a reliable historical data source. Specifically, the study assessed changes in forest, grassland, and wetland areas, examining their durability over the study period. Wetlands have undergone significant reductions over time, with a drastic decrease in 1982. Land reclamation efforts and environmental factors have driven wetland loss. By 2023, only a fraction of wetlands remained.
Over the past two centuries, the grassland areas in the Kościan Plain fluctuated, influenced by wetland and drier habitat dynamics. Wetland grasslands expanded by 1826 but later declined. By 2023, overall grassland area had diminished remaining modified habitats still situated along watercourses exhibiting a concerning trend towards increased fragmentation. On the other hand the forested area has experienced limited fluctuations, also having a growth tendency peaking at in 1982. Forests on wetlands, which were always marginal, have nearly disappeared.
In this study, landscape metrics, as utilized in literature53,85,86,87, were not employed. Our methodology differs in its emphasis, focusing not on the indicative determination of the shape, fragmentation, or dispersion of land cover, but rather on identifying areas where land cover types have remained unchanged over the years (referred to as "permanent"). This approach also considers changeable areas of occurrence and incorporates graphical solutions for effective map representation.
In addition to the quantification of landscape changes, the study proposed a universal method for cartographic visualization. This method aims to support the effective visualization of changes in forest, grassland, and wetland areas in the North European Plain, providing valuable tools for future research and land-use planning efforts. The comprehensive analysis presented in this study provides valuable insights into the historical dynamics of the Kościan Plain's landscape and contributes to our understanding of the long-term impacts of human activities and urbanization on natural ecosystems. The proposed cartographic visualization method offers a practical tool for researchers and policymakers to monitor and manage landscape changes effectively.
Data availability
The datasets used and/or analyzed during the current study available from the corresponding author on reasonable request.
References
Chen, C. et al. Analysis of regional economic development based on land use and land cover change information derived from Landsat imagery. Sci. Rep. 10(1), 12721. https://doi.org/10.1038/s41598-020-69716-2 (2020).
Qu, Y. & Long, H. The economic and environmental effects of land use transitions under rapid urbanization and the implications for land use management. Habitat Int. 82(12), 113–121. https://doi.org/10.1016/j.habitatint.2018.10.009 (2018).
Atik, M., Altan, T. & Artar, M. Land use changes in relation to coastal tourism developments in Turkish Mediterranean. Pol. J. Environ. Stud. 19(1), 21–33 (2010).
Morrison, A. M. Editorial land issues and their impact on tourism development. Land 11(5), 658. https://doi.org/10.3390/land11050658 (2022).
Aziz, A. & Anwar, M. Landscape change and human environment. Environ. Earth Ecol. 3(1), 7–12. https://doi.org/10.24051/eee/110396 (2019).
Ellis, E. C. Land use and ecological change. A 12000-year history. Annu. Rev. Environ. Resour. 46(1), 1–33. https://doi.org/10.1146/annurev-environ-012220-010822 (2021).
Affek, A. N., Zachwatowicz, M. & Solon, J. Long-term landscape dynamics in the depopulated Carpathian foothills: A Wiar River basin case study. Geogr. Pol. 93(1), 5–23. https://doi.org/10.7163/GPol.0160 (2020).
Olah, B. Historical maps and their application in landscape ecological research. Ekol. Bratisl. 28(2), 143–151. https://doi.org/10.4149/ekol_2009_02_143 (2009).
Sims, N. C. et al. Developing good practice guidance for estimating land degradation in the context of the United Nations sustainable development goals. Environ. Sci. Policy 92, 349–355. https://doi.org/10.1016/j.envsci.2018.10.014 (2019).
Sims, N.C., Newnham, G.J., England, J.R., Guerschman, J., Cox, S.J.D., Roxburgh, S.H., Viscarra Rossel, R.A., Fritz. Good Practice Guidance. SDG Indicator 15.3.1. Proportion of Land That Is Degraded Over Total Land Area. Version 2.0. (United Nations Convention to Combat Desertification, Bonn, Germany, 2021).
Bucała-Hrabia, A. Land-use changes and their impact on land degradation in the context of sustainable development of the Polish Western Carpathians during the transition to free-market economics (1986–2019). Geogr. Pol. 96(1), 131–143. https://doi.org/10.7163/GPol.0249 (2023).
Bucała-Hrabia, A. From communism to a free-market economy. A reflection of socio-economic changes in land use structure in the vicinity of the city (Beskid Sądecki, Western Polish Carpathians). Geogr. Pol. 90(1), 65–79. https://doi.org/10.7163/GPol.0079 (2017).
Janík, T., Skokanová, H., Borovec, R. & Romportl, D. Landscape changes of rural protected landscape areas in Czechia. From Arable land to permanent Grassland—From Old to New unification?. J. Landsc. Ecol. 14(3), 88–109. https://doi.org/10.2478/jlecol-2021-0018 (2021).
Skokanová, H. & Eremiášová, R. Changes in the secondary landscape structure and the connection to ecological stability. The cases of two model areas in the Czech Republic. Ekol. Bratisl. 31(1), 33–45. https://doi.org/10.4149/ekol_2012_01_33 (2012).
Barbier, E. B., Burgess, J. C. & Grainger, A. The forest transition. Towards a more comprehensive theoretical framework. Land Use Policy 27(2), 98–107. https://doi.org/10.1016/j.landusepol.2009.02.001 (2010).
Mather, A. S. The forest transition. Area 24(4), 367–379 (1992).
Macias, A. & Szymczak, M. Changes in the forest cover in the town and commune of Krotoszyn in the years 1793–2005. Sylwan 156(9), 710–720 (2012).
Williams, M. Dark ages and dark areas Global deforestation in the deep past. J. Hist. Geogr. 26(1), 28–46. https://doi.org/10.1006/jhge.1999.0189 (2000).
Ceccherini, G. et al. Abrupt increase in harvested forest area over Europe after 2015. Nature 583(7814), 72–77. https://doi.org/10.1038/s41586-020-2438-y (2020).
Wernick, I. K. et al. Quantifying forest change in the European Union. Nature 592(7856), E13–E14. https://doi.org/10.1038/s41586-021-03293-w (2021).
Kubacka, M., Żywica, P., Vila Subirós, J., Bródka, S. & Macias, A. How do the surrounding areas of national parks work in the context of landscape fragmentation? A case study of 159 protected areas selected in 11 EU countries. Land Use Policy 113(2), 105910. https://doi.org/10.1016/j.landusepol.2021.105910 (2022).
Gordeeva, E., Weber, N. & Wolfslehner, B. The new EU forest strategy for 2030—An analysis of major interests. Forests 13(9), 1503. https://doi.org/10.3390/f13091503 (2022).
Meyfroidt, P. & Lambin, E. F. Global forest transition. Prospects for an end to deforestation. Annu. Rev. Environ. Resour. 36(1), 343–371. https://doi.org/10.1146/annurev-environ-090710-143732 (2011).
Latocha, A. Changes in the rural landscape of the Polish Sudety Mountains in the post-war period. Geogr. Pol. 85(4), 13–21. https://doi.org/10.7163/GPol.2012.4.21 (2012).
Kaim, D. et al. Broad scale forest cover reconstruction from historical topographic maps. Appl. Geogr. 67(1), 39–48. https://doi.org/10.1016/j.apgeog.2015.12.003 (2016).
Kozak, J. et al. Forest-cover increase does not trigger forest-fragmentation decrease. Case study from the Polish Carpathians. Sustainability 10(5), 1472. https://doi.org/10.3390/su10051472 (2018).
Monteiro, A. T., Fava, F., Hiltbrunner, E., Della Marianna, G. & Bocchi, S. Assessment of land cover changes and spatial drivers behind loss of permanent meadows in the lowlands of Italian Alps. Landsc. Urban Plan. 100(3), 287–294. https://doi.org/10.1016/j.landurbplan.2010.12.015 (2011).
Szymura, T. H., Murak, S., Szymura, M. & Raduła, M. W. Changes in forest cover in Sudety Mountains during the last 250 years. Patterns, drivers, and landscape-scale implications for nature conservation. Acta Soc. Bot. Pol. 87(1), 3576. https://doi.org/10.5586/asbp.3576 (2018).
Baude, M. & Meyer, B. C. Changes in landscape structure and ecosystem services since 1850 analyzed using landscape metrics in two German municipalities. Ecol. Indic. 152(11), 110365. https://doi.org/10.1016/j.ecolind.2023.110365 (2023).
Müller, S. et al. Land-use intensity and landscape structure drive the acoustic composition of grasslands. Agric. Ecosyst. Environ. 328(80), 107845. https://doi.org/10.1016/j.agee.2021.107845 (2022).
Palang, H., Mander, Ü. & Luud, A. Landscape diversity changes in Estonia. Landsc. Urban Plan. 41(3–4), 163–169. https://doi.org/10.1016/S0169-2046(98)00055-3 (1998).
Zachwatowicz, M. & Giętkowski, T. Temporal changes of land cover in relation to chosen environmental variables in different types of landscape. Misc. Geogr. 14(1), 33–45. https://doi.org/10.2478/mgrsd-2010-0004 (2010).
Cousins, S. A. O. Analysis of land-cover transitions based on 17th and 18th century cadastral maps and aerial photographs. Landsc. Ecol. 16(1), 41–54. https://doi.org/10.1023/A:1008108704358 (2001).
Kiviniemi, K. & Eriksson, O. Size-related deterioration of semi-natural grassland fragments in Sweden. Diversi. Distrib. 8(1), 21–29. https://doi.org/10.1046/j.1366-9516.2001.00125.x (2002).
Walpole, M. & Davidson, N. Stop draining the swamp. It’s time to tackle wetland loss. Oryx 52(4), 595–596. https://doi.org/10.1017/S0030605318001059 (2018).
Szoszkiewicz, J., Szoszkiewicz, K. ed. The estimation of the agricultural value of grassland communities on the base of large area geobotanical surveys. Mat. II Międzynarodowego Symposjum IAVS (Bailleul, 1994).
Ballut-Dajud, G. A. et al. Factors affecting wetland loss. Rev. Land 11(3), 434. https://doi.org/10.3390/land11030434 (2022).
Ławniczak, R. & Kubiak, J. Cartographic sources as a base of knowledge about land use in selected areas in the north-western Poland. Polish Cartogr. Rev. 54(1), 143–157. https://doi.org/10.2478/pcr-2022-0010 (2022).
Łowicki, D. Land use changes in Poland during transformation. Landsc. Urban Plan. 87(4), 279–288. https://doi.org/10.1016/j.landurbplan.2008.06.010 (2008).
Müller, D. et al. Regime shifts limit the predictability of land-system change. Global Environ. Change 28(1), 75–83. https://doi.org/10.1016/j.gloenvcha.2014.06.003 (2014).
Ramankutty, N. & Coomes, O. T. Land-use regime shifts. An analytical framework and agenda for future land-use research. Ecol. Soc. https://doi.org/10.5751/ES-08370-210201 (2016).
Medyńska-Gulij, B. Map compiling, map reading, and cartographic design in “Pragmatic pyramid of thematic mapping”. Quaest. Geogr. 29(1), 57–63. https://doi.org/10.2478/v10117-010-0006-5 (2010).
Szantoi, Z. et al. Addressing the need for improved land cover map products for policy support. Environ. Sci. Policy 112, 28–35. https://doi.org/10.1016/j.envsci.2020.04.005 (2020).
Forrest, D. Thematic Maps in Geography, 260–267 (Elsevier, 2015).
Pieniążek, M. & Zych, M. Statistical maps. Data visualisation methods (Statistics Poland, Warszawa, 2020).
Smaczyński, M., Medyńska-Gulij, B. & Halik, Ł. The land use mapping techniques (including the areas used by pedestrians) based on low-level aerial imagery. ISPRS Int. Geo-Inf. 9(12), 754. https://doi.org/10.3390/ijgi9120754 (2020).
Strode, G. et al. Geovisualization of land use and land cover using bivariate maps and Sankey flow diagrams. Proc. Int. Cartogr. Assoc. 1, 1–5. https://doi.org/10.5194/ica-proc-1-106-2018 (2018).
de Coene, K. et al. Ferraris, the legend. Cartogr. J. 49(1), 30–42. https://doi.org/10.1179/1743277411Y.0000000013 (2012).
Medyńska-Gulij, B. & Żuchowski, T. J. An analysis of drawing techniques used on european topographic maps in the eighteenth century. Cartogr. J. 55(4), 309–325. https://doi.org/10.1080/00087041.2018.1558021 (2018).
Scharfe, W. Abriss der Kartographie Brandenburgs 1771–1821 (De Gruyter, 1972).
Bauer, H. Die Kurhannoversche Landesaufnahme des 18. Jahrhunderts. Erläuterungen zu den farbigen Reproduktionen im Maßstab 1 : 25 000 mit Zeichenerklärung und Blattübersicht (Niedersächsisches Landesverwaltungsamt–Landesvermessung, Hanover, 1993).
Szajdak, L., Życzyńska-Bałoniak, I. & Jaskulska, R. Impact of afforestation on the limitation of the spread of the pollutions in ground water and in soils. Pol. J. Environ. Stud. 12(4), 453–460 (2003).
Affek, A. N. Dynamika krajobrazu. Uwarunkowania i prawidłowości na przykładzie dorzecza Wiaru w Karpatach (XVIII-XXI wiek) = Landscape dynamics : determinants and patterns on the example of the Wiar river basin in the Carpathians (18th - 21st century) 251 (IGiPZ PAN, Warszawa, 2016).
Schils, R. L. M. et al. Permanent grasslands in Europe. Land use change and intensification decrease their multifunctionality. Agric. Ecosyst. Environ. 330(3), 107891. https://doi.org/10.1016/j.agee.2022.107891 (2022).
Kędziora, A. et al. in Biodiversity enrichment in a diverse world, (ed by G. A. Lameed) (InTech, Rijeka, Croatia, 2012), pp. 281–336.
Kulik, M. et al. Grazing of native livestock breeds as a method of grassland protection in Roztocze National Park, Eastern Poland. J. Ecol. Eng. 21(3), 61–69. https://doi.org/10.12911/22998993/118298 (2020).
Gabryszuk, M., Barszczewski, J. & Wróbel, B. Characteristics of grasslands and their use in Poland. J. Water Land. Dev. 51(9–13), 243–249. https://doi.org/10.24425/jwld.2021.139035 (2021).
Hayes, E., Higgins, S., Geris, J. & Mullan, D. Grassland reseeding. Impact on soil surface nutrient accumulation and using LiDAR-based image differencing to infer implications for water quality. Agriculture 12(11), 1854. https://doi.org/10.3390/agriculture12111854 (2022).
Bai, Y. & Cotrufo, M. F. Grassland soil carbon sequestration. Current understanding, challenges, and solutions. Science 377(6606), 603–608. https://doi.org/10.1126/science.abo2380 (2022).
Szymura, T. H. & Szymura, M. Spatial structure of grassland patches in Poland. Implications for nature conservation. Acta Soc. Bot. Pol. 88(1), 3615. https://doi.org/10.5586/asbp.3615 (2019).
Kryszak, A., Strychalska, A., Klarzyńska, A., Łubniewska, A. & Kryszak, J. Natural values of maritime salt grasslands and the possibilities of their preservation. J. Res. App. Agr. Eng. 60(4), 13–16 (2015).
Kozaczyk, P. Transformations of land amelioration systems in the catchment of the Rów Wyskoc River in the context of their use to counteract the effects of drought. J. Ecol. Eng. 18(6), 103–109. https://doi.org/10.12911/22998993/76834 (2017).
Czerwiński, S. et al. Environmental implications of past socioeconomic events in Greater Poland during the last 1200 years. Synthesis of paleoecological and historical data. Quat. Sci. Rev. 259(2), 106902. https://doi.org/10.1016/j.quascirev.2021.106902 (2021).
Pijanowski, B. C. et al. Soundscape ecology. The science of sound in the landscape. BioScience 61(3), 203–216. https://doi.org/10.1525/bio.2011.61.3.6 (2011).
Mizgajski, A. Development of rural landscape in Wielkopolska in reference to metabolism of agroecosystems. Quaest. Geogr. 26A, 39–51 (2007).
Hazeu, G. W., Mucher, C. A., Kramer, H. & Kienast, F. Compilation and assessment of pan-European land cover changes. Proceedings 28th EARSeL Symposium: Remote Sensing for a Changing Europe, Istanbul, Turkey, 2-7 June, 2008, 220–238 (IOS Press, Istanbul, Turkey, 2008).
Wulf, M. & Gross, J. Die Schmettau-Schulenburgsche Karte. Eine Legende für das Land Brandenburg (Ostdeutschland) mit kritischen Anmerkungen (Sauerländer, 2004).
Antonson, H. Revisiting the “Reading Landscape Backwards” approach. Advantages disadvantages, and use of the retrogressive method. Rural Landsc. Soc. Environ. Hist. 5(1), 1–15 (2018).
Baker, A. A note on the retrogressive and retrospective approaches in historical geography. Erdkunde 22(3), 243–244. https://doi.org/10.3112/ERDKUNDE.1968.03.07 (1968).
Gulley, J. L. M. The Retrospective approach in historical geography (Die rückschreitende Methode in der historischen Geographie). Erdkunde 15(4), 306–309. https://doi.org/10.2478/quageo-2020-0019 (1961).
Medyńska-Gulij, B. et al. Die kartographische Rekonstruktion der Landschaftsentwicklung des Oberschlesischen Industriegebiets (Polen) und des Ruhrgebiets (Deutschland). KN J. Cartogr. Geogr. Inf. 69(2), 131–142. https://doi.org/10.1007/s42489-019-00018-y (2019).
Gregory, I. & Ell, P. S. Historical GIS. Technologies, methodologies, and scholarship (Cambridge University Press, Cambridge, 2007).
Cybulski, P., Wielebski, Ł, Medyńska-Gulij, B., Lorek, D. & Horbiński, T. Spatial visualization of quantitative landscape changes in an industrial region between 1827 and 1883. Case study Katowice, southern Poland. J. Maps 16(1), 77–85. https://doi.org/10.1080/17445647.2020.1746416 (2020).
Związek, T., Panecki, T. & Zachara, T. A retrogressive approach to reconstructing the sixteenth-century forest landscapes of western Poland. J. Hist. Geogr. 74(4), 55–74. https://doi.org/10.1016/j.jhg.2021.01.008 (2021).
Affek, A. N. Georeferencing of historical maps using GIS, as exemplified by the Austrian Military Surveys of Galicia. Geogr. Pol. 86(4), 375–390. https://doi.org/10.7163/GPol.0160 (2013).
Panecki, T. The evaluation of archival maps in geohistorical research. Misc. Geogr. 19(4), 72–77. https://doi.org/10.1515/mgrsd-2015-0027 (2015).
Luft, J. & Schiewe, J. Automatic content-based georeferencing of historical topographic maps. Trans. GIS 25(6), 2888–2906. https://doi.org/10.1111/tgis.12794 (2021).
Müller-Miny, H. Die Kartenaufnahme der Rheinlande durch Tranchot und v. Müffling, 1801–1828. Teil 2 - Das Gelände - Eine quellenkritische Untersuchung des Kartenwerkes (Köln, 1975).
Lorek, D. & Medyńska-Gulij, B. Scope of information in the legends of topographical maps in the nineteenth century-Urmesstischblätter. Cartogr. J. 57(2), 113–129. https://doi.org/10.1080/00087041.2018.1547471 (2020).
Bródka, S., Kubacka, M. & Macias, A. Landscape diversity and the directions of its protection in Poland illustrated with an example of Wielkopolskie Voivodeship. Sustainability 13(24), 13812. https://doi.org/10.3390/su132413812 (2021).
Jepsen, M. R. et al. Transitions in European land-management regimes between 1800 and 2010. Land Use Policy 49(1), 53–64. https://doi.org/10.1016/j.landusepol.2015.07.003 (2015).
Macias, A. & Dryjer, M. Forest Cover dynamics in the city of Poznań from 1830 to 2004. Quaest. Geogr. 29(3), 47–57. https://doi.org/10.2478/v10117-010-0022-5 (2010).
Affek, A. N., Wolski, J., Zachwatowicz, M., Ostafin, K. & Radeloff, V. C. Effects of post-WWII forced displacements on long-term landscape dynamics in the Polish Carpathians. Landsc. Urban Plan. 214(3), 104164. https://doi.org/10.1016/j.landurbplan.2021.104164 (2021).
Aune, S., Bryn, A. & Hovstad, K. A. Loss of semi-natural grassland in a boreal landscape. Impacts of agricultural intensification and abandonment. J. Land Use Sci. 13(4), 375–390. https://doi.org/10.1080/1747423X.2018.1539779 (2018).
Cain, D. H., Riitters, K. & Orvis, K. A multi-scale analysis of landscape statistics. Landsc. Ecol. 12(4), 199–212. https://doi.org/10.1023/A:1007938619068 (1997).
Huang, J., Lu, X. X. & Sellers, J. M. A global comparative analysis of urban form. Applying spatial metrics and remote sensing. Landsc. Urban Plan. 82(4), 184–197. https://doi.org/10.1016/j.landurbplan.2007.02.010 (2007).
Wang, Z., Liu, Y., Li, Y. & Su, Y. Response of ecosystem health to land use changes and landscape patterns in the Karst Mountainous regions of Southwest China. Int. J. Environ. Res. Public Health 19(6), 3273. https://doi.org/10.3390/ijerph19063273 (2022).
Author information
Authors and Affiliations
Contributions
Methodology, formal analysis, and investigation, original draft preparation, review, and editing: B.M.-G., K.S., P.C. & Ł.W.; B.M.-G., K.S., P.C. & Ł.W.; figure preparation: B.M.-G. & Ł.W.; conceptualization: B.M.-G..
Corresponding author
Ethics declarations
Competing interests
The authors declare no competing interests.
Additional information
Publisher's note
Springer Nature remains neutral with regard to jurisdictional claims in published maps and institutional affiliations.
Rights and permissions
Open Access This article is licensed under a Creative Commons Attribution 4.0 International License, which permits use, sharing, adaptation, distribution and reproduction in any medium or format, as long as you give appropriate credit to the original author(s) and the source, provide a link to the Creative Commons licence, and indicate if changes were made. The images or other third party material in this article are included in the article's Creative Commons licence, unless indicated otherwise in a credit line to the material. If material is not included in the article's Creative Commons licence and your intended use is not permitted by statutory regulation or exceeds the permitted use, you will need to obtain permission directly from the copyright holder. To view a copy of this licence, visit http://creativecommons.org/licenses/by/4.0/.
About this article
Cite this article
Medyńska-Gulij, B., Szoszkiewicz, K., Cybulski, P. et al. Permanent areas and changes in forests, grasslands, and wetlands in the North European Plain since the eighteenth century—a case study of the Kościan Plain in Poland. Sci Rep 14, 10305 (2024). https://doi.org/10.1038/s41598-024-61086-3
Received:
Accepted:
Published:
DOI: https://doi.org/10.1038/s41598-024-61086-3
Keywords
Comments
By submitting a comment you agree to abide by our Terms and Community Guidelines. If you find something abusive or that does not comply with our terms or guidelines please flag it as inappropriate.

