Abstract
In stark contrast to common ice, Ih, water ice at planetary interior conditions has been predicted to become superionic with fast-diffusing (that is, liquid-like) hydrogen ions moving within a solid lattice of oxygen. Likely to constitute a large fraction of icy giant planets, this extraordinary phase has not been observed in the laboratory. Here, we report laser-driven shock-compression experiments on water ice VII. Using time-resolved optical pyrometry and laser velocimetry measurements as well as supporting density functional theory–molecular dynamics (DFT-MD) simulations, we document the shock equation of state of H2O to unprecedented extreme conditions and unravel thermodynamic signatures showing that ice melts near 5,000 K at 190 GPa. Optical reflectivity and absorption measurements also demonstrate the low electronic conductivity of ice, which, combined with previous measurements of the total electrical conductivity under reverberating shock compression, provides experimental evidence for superionic conduction in water ice at planetary interior conditions, verifying a 30-year-old prediction.
Main
Extensive studies of the unique properties of water reveal extraordinary polymorphism, with subtle rearrangements of the H2O molecules induced by pressure and/or temperature yielding at least 18 crystalline and several amorphous ice phases1,2. Under high pressure — above 50–100 GPa — and near three-fold compression, water molecules lose their characteristic 100° H–O–H geometry and the cubic ice VII structure (or ice VIII at low temperature) transforms into the ionic ice X with linear O–H–O bonds3,4. Early classical molecular dynamics (MD) simulations on water ice under high pressure–temperature conditions5 suggested the occurrence of superionic conduction enabled by liquid-like hydrogen ions rapidly diffusing within the solid lattice of oxygen. Several groups have since then reported Car–Parrinello and Kohn–Sham density-functional-theory-based MD simulations (DFT–MD) showing that the onset of superionic behaviour might be occurring at higher pressure6,7,8,9,10,11,12,13,14,15,16; these provided detailed predictions of its atomic structure13,14,15 and transport properties12,17,18. In particular, the high diffusivity and effective charge ~+e of superionic ice protons17,18,19 enable high ionic conductivity σi exceeding 100 S cm–1 whereas the electronic transport remains that of a semiconductor, with electronic conductivity \({\sigma }_{{\rm{e}}}\ll {\sigma }_{{\rm{i}}}\). Theory also predicts a rapid rise of the melting line associated with the onset of superionic conduction, reaching temperatures higher than previously thought9,10,11,12,13, thereby suggesting that superionic ice could be stable under the expected extreme conditions inside Neptune and Uranus.
In parallel with these computational efforts, static compression experiments at high pressures and temperatures20,21,22,23,24,25,26,27 indicate a sudden increase of the melting line above 20–50 GPa (refs 23,24,25,26,27) with spectroscopic fingerprints25 pointing to the transition to superionic ice. However, unambiguous thermodynamic and transport signatures of the superionic state remain elusive. Despite a claim of superionic conduction28, electrical conductivity measurements up to 900 K and 70 GPa also fall short by two orders of magnitude in σ of identifying the expected characteristic high conductivity of rapidly diffusing protons.
Dynamic compression offers an alternative approach for recreating the extreme conditions of interest in the laboratory. However, single-shock compression of ambient-condition liquid H2O is not suitable to reach the predicted stability domain of superionic water because shock temperatures rise too quickly (Fig. 1a). Measurements of the optical properties reveal the transition, on increasing pressure, from transparent29,30 to opaque near 50 GPa (refs 31,32,33) and finally to reflecting34,35,36 above ~100 GPa and 5,000 K. Given that ions do not contribute to the optical conductivity at such high photon frequencies ~1014 Hz, these optical measurements are probing the electronic contribution to the conductivity (σe) and the high shock-front reflectivity reveals the onset of significant electronic conductivity in the dense fluid with σe > 100 S cm–1. In contrast, electrical impedance measurements of the total conductivity σ show the emergence of ionic conductivity37,38,39 in transparent, shock-compressed water, with a rapid increase from 0.1 S cm–1 at 10 GPa to 20 S cm–1 at 20 GPa before saturating near 30 S cm–1 above 30 GPa and 2,000 K. This saturation has been interpreted as a signature of water being fully dissociated: increasing pressure and temperature do not create more charge carriers, in agreement with some19 but not all17 DFT–MD simulations.

a, Simplified phase diagram for water shows the predicted stability domain of superionic ices and the pressure–temperature states accessible by single (black line) or reverberating41 (blue diamond) shock compression of liquid water with ρ0 ~ 1 g cm–3 or single shocks on pre-compressed ice VII with ρ0 ~ 1.6 g cm–3 (blue line; see also Supplementary Fig. 10). b, Sketch of the diamond anvil cell (DAC) to pre-compress water into ice VII at 2.5 GPa. c, Schematic detail of the pressure chamber. d, VISAR and SOP data for shot 70998 overlayed with the corresponding shock-front velocity history US(t) (green) and averaged SOP counts lineout (red) showing: (1) shock arrival at the diamond/quartz interface; (2) propagation through the quartz; (3) arrival at the quartz/ice VII interface; (4) propagation through the ice; and (5) arrival at the ice/diamond interface. Event (3) is used as t = 0.
The electrical (total) conductivity σ was also measured using a series of reverberating shocks between 70 and 180 GPa, in two independent studies40,41. In these experiments, dividing the dynamic compression into multiple stages reduces the production of entropy and keeps the temperature below ~5,000 K while exploring higher density states (Fig. 1a). These reverberating shock experiments reveal electrical conductivity σ ~ 150 S cm–1, much larger than σ ~ 30 S cm–1 at similar temperature along the single-shock Hugoniot (locus of shock states). This indicates that higher pressure and density induce a significant increase of electrical conductivity, reflecting either a higher ionic conductivity or the onset of a significant electronic contribution. Such an increase of ionic conductivity seems unlikely in the fluid phase, considering that σ saturates above 30 GPa along the liquid Hugoniot. Instead, the efficient diffusion of H ions in superionic ice is expected to enable high ionic conductivity σi > 100 S cm–1, thus it has been proposed that these reverberating shock experiments validate the prediction for superionic ice17,18. However, experimental data on the optical properties of H2O at these conditions are critical to understand whether the emergence of significant electronic conduction σe > 100 S cm–1 may offer a valid alternative interpretation and argue against the existence of superionic water ice.
Here, we report time-resolved optical pyrometry and laser velocimetry measurements at the Omega Laser facility, as well as supporting DFT–MD simulations of H2O in and beyond the pressure–temperature (P–T) regime explored by the reverberating shock experiments (Fig. 1). Using a combination of static pre-compression and laser-driven shock compression, we document the shock equation of state of H2O along the Hugoniot starting with ice VII and find pressure–density and temperature–pressure signatures for melting near 190 GPa and 4,800 K (Fig. 2a,b). We also document the optical properties through reflectivity measurements (Fig. 2c) at 532 nm (2.33 eV) and absorption measurements at 532 nm and near 650 nm (1.9 eV) (Fig. 3) and find that the onset of significant electronic conductivity above 100 S cm–1 occurs in the fluid phase at higher P and T conditions than reached in the reverberating shock experiments (Fig. 4). Hereafter, we refer to the optical properties as being for an energy of 2 eV when we are combining reflectivity and absorption results. Altogether, the new data provide experimental evidence for superionic conduction in water ice at planetary interior conditions (Fig. 5) in agreement with the DFT–MD simulations.

a, Shock velocity versus particle velocity compressibility measurements obtained from the impedance-matching analysis, linear fit and piecewise-linear fit. Three different standard statistical analyses (Fisher’s F-test, Akaike’s information criterion test and Bayesian information criterion test) comparing the results of these two fits indicate that the piecewise model is a better representation of the data, indicating a small discontinuity near US ~ 15–16 km s–1 in agreement with the DFT–MD model. b, A small discontinuity in the shock temperature as a function of shock velocity is also observed, providing a second thermodynamic signature for the melting transition near US ~15 km s–1. c, The shock-front reflectivity stays below ~2% up to ~17 km s–1 (250 GPa), indicating that the refractive index n is similar to the index of ice at 300 K (ref. 42), and then increases quickly with the onset of significant electronic conductivity above ~17 km s–1. Errors bars represent standard deviations at the 1σ level and include random and systematic uncertainties.

a, Velocimetry (VISAR) and pyrometry (SOP) streaked images for shot 70997 (185 GPa) with corresponding shock-front velocity history US(t) (green) and averaged SOP counts lineout (red), showing extra brightness after t = 0 due to the incomplete screening of the hot quartz thermal radiance by the shocked H2O. b, SOP signal as a function of the shocked water layer thickness \({\rm{\Delta }}x={\int }_{0}^{t}\left[{U}_{{\rm{S}}}\left(t^{\prime} \right)-{u}_{{\rm{p}}}\left(t^{\prime} \right)\right]{\rm{d}}t^{\prime} \). Once corrected by subtracting the shocked H2O self-emission contribution, the observed signal exhibits a characteristic Beer–Lambert exponential extinction. c, Absorption coefficient α and optical depth d = 1/α of the shock-compressed H2O obtained from the pyrometry and a similar analysis of velocimetry data, prediction from DFT–MD and estimated values from the optical conductivity inferred from the reflectivity measurements. Horizontal dotted lines correspond to selected optical conductivity ranging from 1 to 1,000 S cm–1 (Supplementary Information). Absorbance increases with pressure, but the corresponding electronic optical conductivity remains well below 100 S cm–1 up to 200 GPa. Errors bars represent standard deviations at the 1σ level and include random and systematic uncertainties.

Experimental data obtained in this study are compared with previous electrical impedance37,38,39,40, optical reflectivity34,35 and absorption30,49 measurements and simulations18 along the liquid Hugoniot, and electrical impedance40,41 and simulations18 along the pre-compressed Hugoniot. Guide-for-the-eye lines indicate the the evolution of the total conductivity (solid) and electronic conductivity (dashed). The low electronic conduction observed along the ice VII Hugoniot shows that the difference in the total conductivity along the liquid Hugoniot and along the ice VII Hugoniot cannot be explained by the onset of significant electronic conductivity. Instead, superionic conduction is likely responsible for the high total conductivity along the ice VII Hugoniot below 5,000 K.
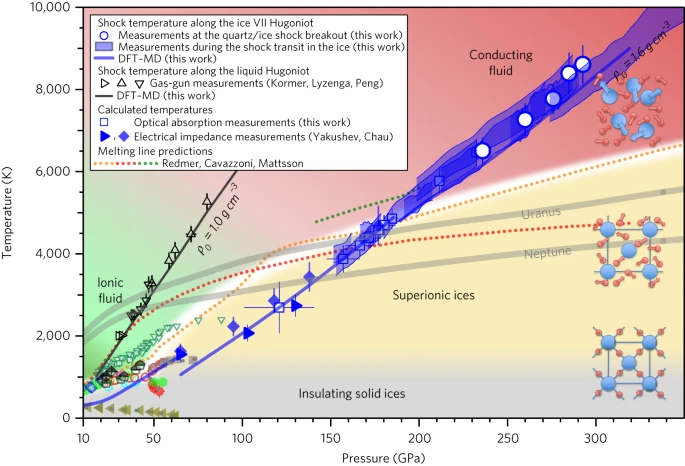
Measured temperature for shocked water ice VII and computed curve from DFT-MD simulations. Liquid water Hugoniot experiments31,33,50 and DFT–MD prediction. Proposed experimental (broad white line) and simulated melting lines7,11,12, solid phase boundaries and diamond anvil cell data (see also Supplementary Fig. 10). Calculated temperature for the electronic conductivity measurements using optical absorption and the total conductivity measurements using electrical impedance40,41 (Fig. 4). Three sketches illustrate the transitions from the insulating solid ice to the oxygen solid lattice and diffusing hydrogens of superionic ice, and then the conducting fluid. Errors bars represent standard deviations at the 1σ level and include random and systematic uncertainties.
Water is pre-compressed into the cubic ice VII phase in a diamond anvil cell at room temperature, then further compressed and heated by laser-generated shocks with pressures between 100 and 300 GPa (Fig. 1a). In these experiments, the shock waves are strong enough to transform the quartz reference plates into an optically reflecting state with a submicrometre optical depth so that the velocimetry interferometer system for any reflector (VISAR) tracks the shock front velocity (US) and reflectivity (R) while the streaked optical pyrometer (SOP) measures the thermal emission of a thin layer of shock-compressed material just behind the shock front (Fig. 1 and Supplementary Fig. 2). However, we find that the optical depth of shocked H2O is larger, decreases with increasing shock pressure and only becomes submicrometre above ~200 GPa (Fig. 3). Nevertheless, even at low shock pressure, we can track the shock velocity by taking advantage of the 1–2% reflectivity caused by the sharp refractive-index jump between unshocked and shocked ice.
Using the Rankine–Hugoniot conservation relations and impedance matching with the quartz as a reference, the velocity history extracted from the VISAR fringe phase analysis provides shock velocity–particle velocity, US–up, points, equivalent to a pressure–density shock equation of state (Fig. 2a and Supplementary Fig. 4). As expected, the shocks on ice VII explore higher density states than the liquid Hugoniot, and the compressibility is well captured by the DFT–MD simulations. In the absence of a phase transformation, most materials exhibit near-linear, slowly varying US–up relationships. Changes in volume and compressibility caused by phase transformations are often revealed by jumps and kinks in US–up. The new data along the shock Hugoniot for water ice VII (Fig. 2a) are best fit by a piecewise model with a small discontinuity near US ~15−16 km s–1. This suggests the occurrence of a phase transformation with a positive Clapeyron slope, consistent with melting and in agreement with the DFT–MD predictions.
As the pre-compressed water ice VII is transparent, the pyrometry (SOP) data provide direct access to the shock temperature of an optically thick layer of shocked H2O, using the shock front in quartz as an in situ brightness reference and a grey-body assumption. In addition to measurements on arrival of the shock in the ice layer (chosen as t = 0), we also collect continuous measurements by following the slow decay of the shock waves during their travel through the H2O (Fig. 2b). Provided we include corrections to account for quantum nuclear vibrational effects (Supplementary Information), the simulated shock temperatures agree well with the experimental data. In addition, the initial density increase gained by the pre-compression allows us to reach lower entropy states and to access the predicted pressure–temperature stability domain of superionic water (Fig. 5).
In the absence of a phase transformation, materials respond to increasing shock velocity by a steady temperature rise to accommodate the rise in internal energy (Fig. 2b). Latent heat and/or changes in the thermodynamic properties on a phase transformation are often revealed by discontinuities or plateau in the T−US Hugoniot. Here, we identify the small discontinuity that we expect on the crossing of the melting line near US ~15 km s–1. Together with the US–up discontinuity, this indicates that water melts along the ice VII Hugoniot near U S = 15 km s–1 and T = 4,800 K. Converting the shock velocity into pressure with the measured US−up relationship, we can plot our data in the T−P plane and find that the melting pressure is 190 GPa (Fig. 5). This also shows that the pre-compressed shock states match the pressure and temperature probed during the reverberating-shock electrical conductivity experiments40,41 and that these probed the properties of ice (see Supplementary Information for details on our re-analysis of refs 40,41 P−T conditions using DFT-MD equation of state data).
Since the VISAR directly tracks the shock, analysis of the fringe amplitude using the shock front in quartz as a reference provides a measurement of the shock-front reflectivity R (Fig. 2c). Knowing the index of the unshocked ice VII (n0 = 1.52), the behaviour of R documents the changes in the refractive index of shocked H2O induced by increasing pressure and temperature. Between 120 and 240 GPa, the measured weak reflectivity indicates that the index is similar to the index of ice at 300 K at the same density42. The rapid increase of the reflectivity (up to 11%) near 350 GPa suggests the onset of significant electronic conductivity σe > 100 S cm–1, similar to the conductivity observed along the liquid Hugoniot. Assuming that the real part of the index continues to increase slowly with density we estimate σe(2 eV) ~ 900 S cm–1 at 290 GPa. Post-processing the DFT−MD simulations to calculate the optical properties of shocked H2O confirms this interpretation, and reproduces the observed reflectivity and the estimated optical conductivity: superionic ice is a wide-bandgap semiconductor while the fluid is electrically conducting (Supplementary Fig. 9). Both a Drude model and the DFT−MD simulations suggest that the d.c. conductivity is similar to the optical conductivity at 2 eV (Supplementary Information).
Further analysis of the pyrometry and velocimetry records also reveals that shocked H2O is partially transparent up to ~240 GPa. As shown in Fig. 3 and Supplementary Fig. 2, the drop of the pyrometry (SOP) signal at the shock breakout from the quartz into the ice VII exhibits a significant broadening due to the incomplete screening of the hot quartz thermal radiance by the partially transparent shocked H2O. A qualitative assessment of the SOP data (Supplementary Fig. 3) indicates that the optical depth decreases with increasing pressure. Correcting the signal to account for the thermal emission of the shocked H2O, and using the velocimetry data to calculate the thickness of the shocked H2O layer at each time reveals a characteristic exponential decay behaviour (Fig. 3b), which can be fitted to extract the optical depth d or its inverse the absorption coefficient α (Supplementary Information). Including a mirror on the quartz/ice interface for three shots allowed us to collect additional extinction data from the velocimetry laser probe, yielding similar values of α in the same spectral range. This quantitative analysis confirms the qualitative trend of a gradual increase of the absorption coefficient from ~103 cm−1 near 120 GPa to ~2 × 104 cm−1 near 240 GPa (Fig. 3c). Here, the DFT−MD predictions underestimate the observed absorption coefficients, suggesting that defect-induced tails in the electronic density of states (which cannot be modelled accurately within the simulation framework used here) might be dominating the dielectric function near 2 eV and masking the predicted 4–6 eV bandgap of the superionic ice (Supplementary Fig. 9)
Combining the results on the reflectivity (giving n(ω)) and the absorption (giving α(ω)) up to 240 GPa, yields model-independent optical conductivity at ~2 eV as σ(ω) = \({\epsilon }_{0}\)cα(ω)n(ω) (where \({\epsilon }_{0}\) is the vacuum permittivity and c is the speed of light in vacuum). Figures 3c and 4 show that σe(2 eV) \(\ll \) 100 S cm–1 below 200 GPa and 5,000 K, and reaches 200 S cm–1 only above 240 GPa, well above the melting line. Comparing our data for σe together with the previous measurements shows that the difference in total conductivity at similar temperatures along the liquid Hugoniot (single shock37,38,39) and along the ice VII Hugoniot (very close to the reverberating shock states40,41) cannot be explained by the onset of significant electronic conductivity. Instead, considering also the two thermodynamic signatures in US−up and in T−US, indicating that water is likely solid at those conditions, we conclude that ice has a very high ionic conductivity between 2,000 and 5,000 K (100 and 190 GPa) along the pre-compressed Hugoniot. Our study therefore provides experimental evidence for the existence of superionic water ice, almost three decades after the first report of fast protonic diffusion in pioneering molecular dynamics simulations of water at extreme conditions5.
Providing experimental evidence for superionic water ice, our study also confirms the rapid rise of the melting line above ~50 GPa predicted by the DFT−MD simulations and hinted at by several static compression studies23,24,25,26,27 (Supplementary Fig. 10). This rapid rise can be attributed to the enhanced entropy of the superionic ice. The signature of a phase transformation observed in ref. 27 near 1,400 K and 70 GPa is therefore likely due to the solid-to-superionic ice transition, not to melting.
Considering the abundance of H and O in the Solar System, and the stability of H2O molecules, water is expected to be an important planetary building block. As previously suggested10,11,12,13,43,44, but in contrast with the prevailing model of fully fluid interiors7,45, superionic ice could constitute a large fraction of the interior of Neptune and Uranus46. However, the presence of crystalline ice does not preclude large-scale convection within these planets, as we expect a low shear strength for superionic ice, based on simulations of the shear modulus of superionic ice16, or by analogy with the high plasticity of other crystalline superionic compounds47. Yet, to compensate for its relatively low conductivity, near 100 S cm–1, vigorous convection with flow velocities similar to those stirring Earth’s liquid outer core (~104 m yr–1) would be required to sustain a dynamo in a superionic ice mantle45,46. The internal stratification allowed by the high melting temperature of the superionic ice might then favour a thin-shell dynamo in the ionic fluid upper mantle46. This could help reconcile the observed multipolar, non-axisymmetric magnetic field of these bodies with their expected composition and gravity field45,46. In contrast, conducting fluid water could constitute a large fraction of sub-Neptune exoplanets48 with surface temperatures exceeding 500–700 K due to high stellar irradiance, such as GJ 1214b or Kepler 11c among many others, and contribute to generate much different magnetic field topologies typical of thick-shell dynamos45 (Supplementary Fig. 19).
Understanding whether water and water-rich C–H–O–N mixtures are miscible or not and what are the properties of the stable phases at the relevant conditions appears as an obvious extension of this work. More generally, as astronomical observations and extreme-condition laboratory experiments improve in the near future, we are confident that tying planetary modelling45,46,48 to the fundamental properties of planetary constituents should soon yield a better understanding of the diversity of icy planet formation, structure and evolution.
Methods
Pre-compressed samples
Double-distilled, deionized water was loaded in diamond anvil cells (DACs) with 200 × 200 μm quartz plates either 15 or 30 μm thick and four ruby microspheres51, then compressed at room temperature to 2.5 GPa to form ice VII. The liquid-ice VI and ice VI–ice VII phase transitions were monitored by visual inspections during compression. Pre-shot pressure was determined by ruby luminescence, allowing us to infer the initial density near 1.6 g cm−3 and the refractive index near 1.52 based on previous studies52,53. White-light interferometry provided the pre-shot thicknesses of the quartz and ice layers. The thin diamond anvil was 350 μm thick and had a 10–15 μm polyimide plastic coating facing the laser drive on top of a 4 μm Au layer, and a 100 nm Ti layer on the sample interface. The 1,200-μm-thick diamond anvil and the quartz plate had anti-reflection coatings. Some targets had an extra 100 nm Ti layer on half of the quartz/water interface.
Laser-driven shock compression
The DAC target assemblies54,55,56,57,58,59,60 containing the water ice were shock compressed by direct-drive laser ablation at the Omega Laser Facility, Laboratory for Laser Energetics (LLE) of the University of Rochester, NY (USA) using 700–2,000 J of 351 nm UV laser in a 1 ns super-Gaussian flat-top temporally shaped pulse. Up to six laser beams incident at a 23° angle with the normal to the target were used (Supplementary Fig. 1). SG8-Flat distributed phase plates created a super-Gaussian spatial distribution matching the 900 μm DAC opening61. The shock compression is destructive: each DAC is shot once.
Ultrafast diagnostics
Our primary diagnostics were Omega’s velocity interferometer system for any reflector (VISAR) and streaked optical pyrometer (SOP). The VISAR offers a line-imaging, time-resolved record of the velocity of moving reflecting interfaces and optical properties (reflectivity, absorptivity) at the probe laser wavelength, 532 nm. The fringe phase shift encodes the velocity history while the fringe amplitude records the reflectivity of the tracked moving interface and the absorptivity of the different media that the probe laser is passing through61,62. The SOP acquires line-imaging, time-resolved records of the spectral radiance between 590 nm and 850 nm (refs 61,63,64). Both diagnostics share the same optical telescope and image the same area of the target. VISAR sensitivities (vacuum velocity per fringe, vvpf) were 2.732 and 6.907 km s–1. Two-gigahertz timing fiducials were recorded for each streaked image on all three cameras, allowing us to accurately correct the timing for sweep rate nonlinearities. The rise time of the SOP between 10% and 90% at a shock breakout event is ~130 ps.
Equation of state simulations with DFT–MD
Using the Vienna Ab-initio Simulation Package (VASP), we performed finite-temperature DFT–MD simulations of water, extending previously reported work10,15,65, to precisely map the pressure P and internal energy e as a function of density ρ and temperature T in the experimentally explored region. In addition to simulations over a coarse ρ–T grid approximately every 1,000 K (Supplementary Tables 5 and 6), we also performed a series of simulations every 100 K between 4,000 and 6,000 K at three densities close to the ice VII Hugoniot. To obtain meaningful results and avoid metastability issues, we analysed each MD snapshot and discriminated between the fluid and the superionic phases. We then fitted the temperature dependence of both internal energy and pressure along the three isochores for both the superionic and the fluid phases. We therefore obtained two grids of DFT equation of state (EOS) points for the fluid and superionic phases (Supplementary Tables 7 and 8). We applied a correction to the vibrational energies of the protons to account for their quantum nature66,67, and were able to solve the Rankine–Hugoniot equation e = e0 + 0.5(P + P0)(1/ρ0 − 1/ρ) to obtain the predicted shock pressure, density and temperature starting with water ice VII. The calculation was performed at the Perdew, Burke and Ernzerhof (PBE) level of approximation to the exchange-correlation functional in the NVT ensemble (constant number, volume and temperature) with a plane-wave energy cutoff of 900 eV, a time step of 0.4 fs and a Nosé–Hoover thermostat using 162 atoms. Projector-augmented wave (PAW) pseudopotentials were used to account for the oxygen core electrons: we used the O and H in the VASP PBE PAW library with core radii of 1.52 and 1.10 Bohr, respectively. The electronic density was constructed from single-particle wavefunctions by sampling at the Γ point of the Brillouin zone. The electron occupation numbers were taken to be a Fermi–Dirac distribution set at the average temperature of the ions. For the different densities and temperatures, we used a sufficient number of bands such that we had at least 40 bands with occupation numbers smaller than 10−5. The MD simulation was run for 20,000 steps with the last 16,000 steps used for averaging the internal energy and the pressure.
Data analysis
Tracking reflecting shocks with VISAR to measure shock velocity and impedance match analysis to obtain pressure–density data
In the experiments reported here, the shock waves were strong enough to transform the quartz into a metallic-like, optically reflecting state so that VISAR tracked the shock-front velocity US and reflectivity R while SOP measured the thermal emission of a thin submicrometre layer of shock-compressed and shock-heated material just behind the shock front61.
Although H2O was not always transformed into a metallic-like state with a submicrometre optical depth, the high dynamic range of reflectivity measurements provided by the line-imaging VISAR at Omega allowed us to track the shock front as it propagated through the water ice VII layer (except for shot 71795). Even at low shock pressure, when the optical depth of shocked H2O was larger than several micrometres, the VISAR detected the 1–2% reflectivity due to the sharp refractive-index jump at the shock front between the unshocked and the shocked ice.
Before extracting the phase map, some images were corrected by subtracting ghost fringes that are caused by spurious residual reflections at the ice/diamond or diamond/vacuum interface61. Having determined the time dependency of the shock velocity, US(t) (Fig. 1 and Supplementary Fig. 2), we could extract US Quartz and US Water, the shock velocities right before and after the time (which we set as t = 0) of the shock transit from the quartz into the water layer, using a linear fit over ~100–200 ps extrapolated to t = 0.
The Rankine–Hugoniot relations68, derived from conservation of mass, momentum and energy across a shock front, link the initial and final shock pressures, internal energies and densities with the shock and particle velocities US and up. For a given set of starting conditions P0−ρ0−e0, all the shock end states lie on a curve in the pressure−density−energy space, the Hugoniot.
Using the Rankine–Hugoniot relations, the measured change in shock velocity on the crossing of the interface between two materials — having different density and/or compressibility — can be used to infer the shock compressibility of the second material (sample) if the behaviour of the first material (reference) is known. Here we use quartz as a reference for the impedance-matching procedure69,70. We explicitly include corrections to account for the pre-compression of the quartz reference60.
For each shot, the impedance-matching procedure applied to the US Quartz,US Water pair yields a US–up point, which is equivalent to a P–ρ datum, so that we obtained eleven US–up and P–ρ data points (Fig. 2a, and Supplementary Fig. 4 and Supplementary Table 1). We used a Monte Carlo routine to explicitly propagate random uncertainties associated with (i) the VISAR record, (ii) the data reduction to obtain the phase shift map and the initial pressure measurements, as well as (iii) systematic uncertainties associated with the VISAR instrument and (iv) the use of the quartz reference for the impedance-matching procedure.
In the absence of a phase transformation, most materials exhibit a near-linear, slowly varying US–up relationship. Changes in volume and compressibility caused by phase transformations are often revealed by jumps and kinks in US−up.
We show the new data along the shock Hugoniot for water ice VII in Supplementary Fig. 2a. We applied both a linear fit US = a + bup (a = 4.378 ± 0.355 km s–1, b = 1.362 ± 0.0406); and a two-segment piecewise linear fit defined as US = a1 + b1up for up < c and US = a2 + b2 up for up ≥ c (a1 = 7.547 ± 1.16 km s–1, b1 = 0.931 ± 0.155, a2 = 5.762 ± 0.443 km s–1, b2 = 1.222 + ±0.046 with c = 8 km s–1). Three different standard statistical analyses (Fisher’s F-test, Akaike’s information criterion test and Bayesian information criterion test) comparing the results of these two fits indicate that the piecewise model is a better representation of the data. Analysis of the velocimetry data suggests the occurrence of a phase transformation with a positive Clapeyron slope.
Note that the presence of the mirror coating on about half of the quartz/ice interface in shots 71000, 71001 and 71795 (Supplementary Fig. 1) caused artefacts in the VISAR data that prevented us from accurately measuring the shock velocity in the quartz.
Reflectivity
While the VISAR fringe phase encodes the velocity information, the amplitude of the fringes contains information about the reflectivity of the moving reflector (here the shock front). We used the shock front during its travel across the quartz plate as an in situ reference based on previous absolute measurements at the Omega Laser61,71 but using corrections to account for the higher initial density of the precompressed quartz reference60. Doing so, we were able to determine the reflectivity time dependence R(t) and extract one R–P datum per shot for shocked H2O using an extrapolation of R(t) to t = 0+ and the pressure obtained from the impedance-matching analysis (Supplementary Fig. 2c). We explicitly corrected the fringe amplitude to compensate for small sweep-rate nonlinearities by normalizing it to a constant dwell time per pixel. We also performed a Hill-function fit to the shock-front reflectivity for water along the ice VII Hugoniot that we use to estimate the emissivity of shocked H2O that we need to infer shock temperatures from the SOP data: \(R=1.35+5.82{U}_{{\rm{S}}}^{41.91}{\rm{/}}\left(17.5{1}^{41.91}+{U}_{{\rm{S}}}^{41.91}\right)\). Another fit restricted to the data above US = 16.5 km s–1 was used for shot 86363: \(R=69.51-10.40{U}_{{\rm{S}}}+0.3808{U}_{{\rm{S}}}^{2}\).
Pyrometry
The spectral radiance space–time history recorded by the SOP allowed us to obtain shock temperatures provided one can attribute the observed radiance to a homogeneous part of the dynamically compressed target package. Note that, as for the reflectivity analysis, we explicitly corrected the SOP signal to compensate the small sweep-rate nonlinearities by normalizing to a constant dwell time per pixel.
Quartz shock-compressed into the fluid phase has significant metallic-like electronic conductivity (optical depth is much smaller than 1 μm) so that the SOP collects the spectral radiance of about a 1 optical-depth-thick layer of shocked SiO2 at any given time during the shock transit in the quartz plate. We can then relate the SOP counts to the shock temperature61, assuming that thermal emission is that of a grey body, with an emissivity \(\epsilon \) independent of wavelength, that is inferred from the shock-front reflectivity: \(\epsilon =1-R\). We used corrections to account for the higher initial density of the pre-compressed quartz reference, compared to the original absolute measurements60.
For Omega shot numbers 69347, 70421, 70424, 70998, 70999 and 86363, the SOP images show a sharp (limited by our temporal resolution) drop in radiance on shock breakout of the quartz into the water ice layer, followed by an approximatively linear decay up to the arrival of the shock at the ice/diamond interface (Fig. 1 and Supplementary Fig. 2a). Here, the interpretation is straightforward and we can attribute the radiance between these two events to the thermal self-emission of the shock-compressed H2O. Using the fit of the measured reflectivity to calculate the emissivity of shocked H2O, we obtain the temperature time dependence T(t) for each shot from which we can extract a T–P datum using a linear extrapolation of T(t) to just after t = 0 and the pressure obtained from the impedance-matching analysis (shown as blue circles in Figs. 2 and 5). In addition, we can also combine US(t) and T(t) during the transit of the shock front through the water layer to obtain a continuous T(US) record. As the shock decays slowly during its transit, we collect a series of shock temperature data along the ice VII Hugoniot in each shot (shown as shaded blue areas in Figs. 2 and 5). We emphasize that these decaying-shock data differ from shock-and-release measurements that would be obtained if one were to look at an interface between a hot, opaque shocked material and a less compressible transparent ‘window’ or the vacuum (see also ref. 72).
The SOP records for the shots at lower pressure (Fig. 3 and Supplementary Figs 2 and 3) are slightly more complex, as the SOP did not record only the thermal emission of the shocked H2O during the shock transit in the water ice layer. Instead, the drop of the pyrometry (SOP) signal at the shock breakout from the quartz into the ice VII exhibits a significant broadening due to the incomplete screening of the hot quartz thermal radiance by the partially transparent shocked H2O. A detailed analysis of these records provides a way to accurately determine the optical depth of the shock-compressed H2O as well as the shock temperature for a few shots in which we could create an optically thick shocked H2O layer.
Using the velocimetry records we obtained US(t) from which we can determine the shocked water layer thickness at each time \({\rm{\Delta }}x(t)={\int }_{0}^{t}[{U}_{{\rm{S}}}(t^{\prime} )-{u}_{{\rm{p}}}({t}^{^{\prime} })]d{t}^{^{\prime} }\) (the shock front moves at US but the quartz/ice interface is also put into motion, to velocity up, by the shock). We could then transform the measured SOP time history, counts(t), into a record as a function of optical transit depth, counts(Δx). As shown in Fig. 3, such traces exhibit an exponential-like decay, but to obtain a more accurate determination of the optical opacity, we corrected these records by subtracting the estimated contribution of the shocked H2O self-emission. To do this, we first calculated the time dependence of the H2O shock temperature using the measured US(t) together with the T(US) relationship predicted by the DFT–MD, then used the quartz calibration for shock temperature to transform these estimated temperatures into SOP counts. The good agreement between the measured and predicted shock temperatures provides a good consistency check. The corrected SOP traces exhibit a clear Beer–Lambert behaviour and exponential fits from t = 0 yielded the optical depth d = 1/α, where α is the absorption coefficient. The corresponding pressure was obtained by interrogating the US(t) record at t = 0+ and at the instant when the corrected SOP signal reached a steady state. The corresponding temperature was interpolated from the predicted T(US) below 200 GPa and the averaged experimental data above 200 GPa.
This analysis relies implicitly on a steady thermal emission from the quartz that has isentropically released from its initial shock state due to the shock impedance mismatch with the ice. One-dimensional Lagrangian hydrodynamic simulations of the experiments using the commercial code Hyades73 indicate that the temperature of the hot quartz at the quartz/ice interface stays constant during the few nanosecond duration of the optical absorption measurements. We also made sure to avoid attributing the drop in quartz temperature to absorption by the water layer by calculating the SOP counts corresponding to the release temperature, estimated from the impedance-match analysis at t = 0.
For the few shots in which we could create an optically thick shocked H2O layer with Δx > 7−10d (70997, 70423 and 71000), we also extracted the portion of the record after the instant when the corrected SOP signal reached a steady state to obtain continuous T(US) data. Here, we made sure to account for the smearing of the decaying-shock data by the approximately micrometre measured optical depth, but found that this effect was negligible due to the slow velocity decay.
The targets for shots 71000, 71001 and 71795 featured an additional titanium mirror coating on approximately half of the quartz/water interface. Orienting appropriately the slit of the streak camera that represents the imaging direction y, we recorded VISAR and SOP for both the coated and uncoated region for each shot (Supplementary Fig. 1). Supplementary Figure 5 describes the experimental configuration and data interpretation for shots 71000 and 71001 near 180 GPa for which the shocked H2O layer optical depth was about 2 μm. In the portion of the VISAR image corresponding to the portion of the interface with a mirror, two reflectors are tracked simultaneously: (i) a weak ~1–2% reflection at the shock front due to the mismatch of the real part of the refractive index between the unshocked ice VII and the shocked H2O; and (ii) a strong 37% reflection at the titanium-coated quartz/ice interface that is being attenuated by the two passes through the partially absorbing layer of shocked H2O. These two contributions are visible in the portion of the VISAR streaked image shown in Supplementary Fig. 5. During the shock transit through the diamond and the quartz plate, the VISAR signal reflects off the Ti mirror coating and the fringes are stationary (no motion). On event (3), the arrival of the shock at the quartz/ice interface, the fringe intensity drops rapidly while fringes associated with the weakly reflecting shock front become visible and appear slightly slanted, indicating a slightly decaying shock.
Analysis of the temporal history of the fringe amplitude for the two VISAR channels indicates that this decay occurs on a longer timescale than the etalon delay for each VISAR. When plotted against the thickness of the shocked H2O layer, the rapid decay is found to be in good agreement with the expected Beer–Lambert exponential behaviour. The optical depth values are very close to 1.5 μm (Fig. 3). Note that the extinction appears faster on the VISAR images because the attenuation occurs twice (before and after reflection from the Ti mirror coating). Here, we use the nominal 37% reflectivity of the titanium layer at the quartz/ice VII interface as a reference to measure the reflectivity of the shock front.
Supplementary Figure 6 describes the corresponding pyrometry data. Taking advantage of the line-imaging capability, we recorded SOP data for both the coated and uncoated portions of the targets. In both regions, two contributions are collected simultaneously by the SOP as the shocked H2O is not optically thick: (i) a weak self-emission from the shocked H2O; and (ii) a stronger self-emission by the shocked-and-released quartz that is being attenuated by the one pass through the partially absorbing layer of shocked H2O. Looking at the region with the mirror, we see no self-emission until event (3), when the thin Ti layer is quickly heated by the arrival of the shock wave in the quartz plate underneath, and the pyrometry signal in this portion of the record quickly matches the one in the uncoated quartz portion. Here, we could not accurately measure the shock velocity in the quartz because the fringe quality was not sufficient. Instead, we calculated it from extrapolating the measured shock velocity in shocked H2O to t = 0 as well as a linear fit of the US Quartz−US Water data obtained from the targets without a coating (using only the four points below the melting line). Having determined US Quartz, we used the SOP during event (2) to link the SOP signal to the grey-body temperature. A portion of the record corresponding to the late time of shot 71000 is reported in Figs. 2b and 5. We also analysed the SOP decay to obtain the absorption coefficient as describe above (Fig. 3).
In this shot, the shocked H2O remains optically thin: the optical depth is comparable to the 34 μm thickness of the sample layer. The VISAR record is dominated by the strong reflection at the Ti-coated quartz/ice interface, only slightly attenuated by the shocked H2O. The weak signal associated with the ~1% shock-front reflectivity is not distinguishable. Identifying events (3) and (5) yields the shock transit time through the ice layer, which allows us to obtain an average shock velocity US = 12.4 ± 0.8 km s–1. Assuming the compressibility (we used the DFT–MD model from French15), we can calculate the true particle velocity up = 5.89 ± 0.16 km s–1 that corresponds to a pressure at event (3) near 120 GPa. Analysing the fringe shift between events (3) and (5) yields the apparent interface velocity uapp = 6.56 ± 0.16 km s–1. Using also the unshocked refractive index n0 = 1.52, we can then calculate the real part of the refractive index of the shocked H2O at these conditions using74 n = (uapp − n0US)/(up − U S ) = 1.91 ± 0.19.
This value is in excellent agreement with the measured values at the same density at room temperature42. We also analysed the VISAR amplitude to obtain the absorption coefficient (Fig. 3). For this shot, the SOP record (Supplementary Fig. 3) shows a clear drop at event (3) consistent with the expected drop from the incident shock state temperature to the released state temperature. Analysing the (very small) decay of the SOP signal due to the absorption by the shocked H2O layer, we can also obtain a similar absorption coefficient.
Data availability
The data that support the plots within this paper and other findings of this study are available from the corresponding author upon reasonable request.
References
Dunaeva, A. N., Antsyshkin, D. V. & Kuskov, O. L. Phase diagram of H2O: thermodynamic functions of the phase transitions of high-pressure ices. Sol. Syst. Res. 44, 222–243 (2010).
Bartels-Rausch, T. et al. Ice structures, patterns, and processes: a view across the icefields. Rev. Mod. Phys. 84, 885–944 (2012).
Goncharov, A. F., Struzhkin, V. V., Somayazulu, M. S., Hemley, R. J. & Mao, H. K. Compression of ice to 210 gigapascals: infrared evidence for a symmetric hydrogen-bonded phase. Science 273, 218–220 (1996).
Loubeyre, P., LeToullec, R., Wolanin, E., Hanfland, M. & Hausermann, D. Modulated phases and proton centring in ice observed by X-ray diffraction up to 170 GPa. Nature 397, 503–506 (1999).
Demontis, P., LeSar, R. & Klein, M. L. New high-pressure phases of ice. Phys. Rev. Lett. 60, 2284–2287 (1988).
Benoit, M., Bernasconi, M., Focher, P. & Parrinello, M. New high-pressure phase of ice. Phys. Rev. Lett. 76, 2934–2936 (1996).
Cavazzoni, C. et al. Superionic and metallic states of water and ammonia at giant planet conditions. Science 283, 44–46 (1999).
Goldman, N., Fried, L., Kuo, I.-F. & Mundy, C. Bonding in the superionic phase of water. Phys. Rev. Lett. 94, 217801 (2005).
Schwegler, E., Sharma, M., Gygi, F. & Galli, G. Melting of ice under pressure. Proc. Natl Acad. Sci. USA 105, 14779–14783 (2008).
French, M., Mattsson, T., Nettelmann, N. & Redmer, R. Equation of state and phase diagram of water at ultrahigh pressures as in planetary interiors. Phys. Rev. B 79, 054107 (2009).
Redmer, R., Mattsson, T. R., Nettelmann, N. & French, M. The phase diagram of water and the magnetic fields of Uranus and Neptune. Icarus 211, 798–803 (2011).
Mattsson, T. R. & Desjarlais, M. P. Phase diagram and electrical conductivity of high energy-density water from density functional theory. Phys. Rev. Lett. 97, 017801 (2006).
Wilson, H. F., Wong, M. L. & Militzer, B. Superionic to superionic phase change in water: consequences for the interiors of Uranus and Neptune. Phys. Rev. Lett. 110, 151102 (2013).
Sun, J., Clark, B. K., Torquato, S. & Car, R. The phase diagram of high-pressure superionic ice. Nat. Commun. 6, 8156 (2015).
French, M., Desjarlais, M. P. & Redmer, R. Ab-initio calculation of thermodynamic potentials and entropies for superionic water. Phys. Rev. E 93, 022140 (2016).
Hernandez, J.-a & Caracas, R. Superionic-superionic phase transitions in body-centered cubic H2O ice. Phys. Rev. Lett. 117, 135503 (2016).
French, M., Mattsson, T. & Redmer, R. Diffusion and electrical conductivity in water at ultrahigh pressures. Phys. Rev. B 82, 174108 (2010).
French, M., Hamel, S. & Redmer, R. Dynamical screening and ionic conductivity in water from ab initio simulations. Phys. Rev. Lett. 107, 185901 (2011).
Goldman, N. et al. Ab initio simulation of the equation of state and kinetics of shocked water. J. Chem. Phys. 130, 124517 (2009).
Datchi, F., Loubeyre, P. & LeToullec, R. Extended and accurate determination of the melting curves of argon, helium, ice (H2O), and hydrogen (H2). Phys. Rev. B 61, 6535–6546 (2000).
Dubrovinskaia, N. & Dubrovinsky, L. Whole-cell heater for the diamond anvil cell. Rev. Sci. Instrum. 74, 3433–3437 (2003).
Frank, M. R. M., Fei, Y. & Hu, J. Constraining the equation of state of fluid H2O to 80 GPa using the melting curve, bulk modulus, and thermal expansivity of ice VII. Geochim. Cosmochim. Acta 68, 2781–2790 (2004).
Schwager, B., Chudinovskikh, L., Gavriliuk, A. & Boehler, R. Melting curve of H2O to 90 GPa measured in a laser-heated diamond cell. J. Phys. Condens. Matter 16, S1177–S1179 (2004).
Lin, J.-F. et al. Melting behavior of H2O at high pressures and temperatures. Geophys. Res. Lett. 32, L11306 (2005).
Goncharov, A. et al. Dynamic ionization of water under extreme conditions. Phys. Rev. Lett. 94, 125508 (2005).
Ahart, M., Karandikar, A., Gramsch, S., Boehler, R. & Hemley, R. J. High P-T Brillouin scattering study of H2O melting to 26 GPa. High Press. Res. 34, 327–336 (2014).
Kimura, T., Kuwayama, Y. & Yagi, T. Melting temperatures of H2O up to 72 GPa measured in a diamond anvil cell using CO2 laser heating technique. J. Chem. Phys. 140, 074501 (2014).
Sugimura, E. et al. Experimental evidence of superionic conduction in H2O ice. J. Chem. Phys. 137, 194505 (2012).
Kormer, S. B., Yushko, K. & Krishkevich, G. Phase transformation of water into ice VII by shock compression. Sov. Phys. JETP 27, 879–881 (1968).
Holmes, N., Nellis, W., Graham, W. & Walrafen, G. Spontaneous Raman scattering from shocked water. Phys. Rev. Lett. 55, 2433–2436 (1985).
Lyzenga, G. A. The temperature of shock-compressed water. J. Chem. Phys. 76, 6282 (1982).
Koenig, M. et al. High pressures generated by laser driven shocks: applications to planetary physics. Nucl. Fusion 44, S208–S214 (2004).
Peng, X., Liu, F., Zhang, S., Zhang, M. & Jing, F. The C V for calculating the shock temperatures of water below 80 GPa. Sci. China Phys. Mech. Astron. 54, 1443–1446 (2011).
Celliers, P. M. et al. Electronic conduction in shock-compressed water. Phys. Plasmas 11, L41 (2004).
Knudson, M. et al. Probing the interiors of the ice giants: shock compression of water to 700 GPa and 3.8 g/cm3. Phys. Rev. Lett. 108, 091102 (2012).
Kimura, T. et al. P-ρ-T measurements of H2O up to 260 GPa under laser-driven shock loading. J. Chem. Phys. 142, 164504 (2015).
Yuknavech, M. M. Memorandum Report. No. 1563 (Technical Report, Ballistic Research Laboratories, Aberdeen Proving Ground, MD, 1964).
Hamann, S. D. & Linton, M. Electrical conductivity of water in shock compression. Trans. Faraday Soc. 62, 2234–2241 (1966).
Mitchell, A. C. & Nellis, W. J. Equation of state and electrical conductivity of water and ammonia shocked to the 100 GPa (1 Mbar) pressure range. J. Chem. Phys. 76, 6273–6281 (1982).
Yakushev, V. V., Postnov, V. I., Fortov, V. E. & Yakysheva, T. I. Electrical conductivity of water during quasi-isentropic compression to 130 GPa. J. Exp. Theor. Phys. 90, 617–622 (2000).
Chau, R., Mitchell, A. C., Minich, R. W. & Nellis, W. J. Electrical conductivity of water compressed dynamically to pressures of 70–180 GPa (0.7–1.8 Mbar). J. Chem. Phys. 114, 1361 (2001).
Zha, C.-S., Hemley, R. J., Gramsch, S. A., Mao, H.-K. & Bassett, W. A. Optical study of H2O ice to 120 GPa: dielectric function, molecular polarizability, and equation of state. J. Chem. Phys. 126, 074506 (2007).
Lin, J.-F., Schwegler, E. & Yoo, C.-S. in Earth’s Deep Water Cycle (eds Jacobsen, S. D. & van der Lee, S.) Vol. 168, 159–169 (American Geophysical Union, Washington DC, 2006).
Goncharov, A. F. & Crowhurst, J. Proton delocalization under extreme conditions of high pressure and temperature. Phase Transitions 80, 1051–1072 (2007).
Stanley, S. & Bloxham, J. Convective-region geometry as the cause of Uranus’ and Neptune’s unusual magnetic fields. Nature 428, 151–153 (2004).
Nettelmann, N., Helled, R., Fortney, J. & Redmer, R. New indication for a dichotomy in the interior structure of Uranus and Neptune from the application of modified shape and rotation data. Planet. Space Sci. 77, 143–151 (2013).
Kirpichnikova, L. F., Urusovskaya, A. A. & Mozgovoi, V. I. Superplasticity of CsHSO4 crystals in the superionic phase. JETP Lett. 62, 638–641 (1995).
Tian, B. Y. & Stanley, S. Interior structure of water planets: implications for their dynamo source regions. Astrophys. J. 768, 156 (2013).
Zel’dovich, Y. B., Kormer, S. B., Sinitsyn, M. V. & Yushko, K. B. A study of the optical properties of transparent materials under high pressure. Sov. Phys. Dokl. 6, 494–496 (1961).
Kormer, S. B. Optical study of the characteristics of shock condensed dielectrics. Sov. Phys. Usp. 11, 229–254 (1968).
Chervin, J. C., Canny, B. & Mancinelli, M. Ruby-spheres as pressure gauge for optically transparent high pressure cells. High Press. Res. 21, 305–314 (2001).
Dewaele, A., Eggert, J. H., Loubeyre, P. & Le Toullec, R. Measurement of refractive index and equation of state in dense He, H2, H2O, and Ne under high pressure in a diamond anvil cell. Phys. Rev. B 67, 094112 (2003).
Bezacier, L. et al. Equations of state of ice VI and ice VII at high pressure and high temperature. J. Chem. Phys. 141, 104505 (2014).
Jeanloz, R. et al. Achieving high-density states through shock-wave loading of precompressed samples. Proc. Natl Acad. Sci. USA 104, 9172–9177 (2007).
Loubeyre, P. et al. Coupling static and dynamic compressions: first measurements in dense hydrogen. High Press. Res. 24, 25–31 (2004).
Lee, K. K. M. et al. Laser-driven shock experiments on precompressed water: implications for “icy” giant planets. J. Chem. Phys. 125, 014701 (2006).
Loubeyre, P. et al. Extended data set for the equation of state of warm dense hydrogen isotopes. Phys. Rev. B 86, 144115 (2012).
Eggert, J. et al. Hugoniot data for helium in the ionization regime. Phys. Rev. Lett. 100, 124503 (2008).
Celliers, P. M. et al. Insulator-to-conducting transition in dense fluid helium. Phys. Rev. Lett. 104, 184503 (2010).
Brygoo, S. et al. Analysis of laser shock experiments on precompressed samples using a quartz reference and application to warm dense hydrogen and helium. J. Appl. Phys. 118, 195901 (2015).
Millot, M. et al. Shock compression of stishovite and melting of silica at planetary interior conditions. Science 347, 418–420 (2015).
Celliers, P. M. et al. Line-imaging velocimeter for shock diagnostics at the OMEGA laser facility. Rev. Sci. Instrum. 75, 4916 (2004).
Miller, J. E. et al. Streaked optical pyrometer system for laser-driven shock-wave experiments on OMEGA. Rev. Sci. Instrum. 78, 034903 (2007).
Gregor, M. C. et al. Absolute calibration of the OMEGA streaked optical pyrometer for temperature measurements of compressed materials. Rev. Sci. Instrum. 87, 114903 (2016).
French, M. & Redmer, R. Construction of a thermodynamic potential for the water ices VII and X. Phys. Rev. B 91, 014308 (2015).
Berens, P. H., Mackay, D. H. J., White, G. M. & Wilson, K. R. Thermodynamics and quantum corrections from molecular dynamics for liquid water. J. Chem. Phys. 79, 2375 (1983).
French, M. & Redmer, R. Estimating the quantum effects from molecular vibrations of water under high pressures and temperatures. J. Phys. Condens. Matter 21, 375101 (2009).
Celliers, P. M., Collins, G. W., Hicks, D. G. & Eggert, J. H. Systematic uncertainties in shock-wave impedance-match analysis and the high-pressure equation of state of Al. J. Appl. Phys. 98, 113529 (2005).
Hicks, D. G. et al. Shock compression of quartz in the high-pressure fluid regime. Phys. Plasmas 12, 082702 (2005).
Desjarlais, M. P., Knudson, M. D. & Cochrane, K. R. Extension of the Hugoniot and analytical release model of α-quartz to 0.2–3 TPa. J. Appl. Phys. 122, 035903 (2017).
Hicks, D. G. et al. Dissociation of liquid silica at high pressures and temperatures. Phys. Rev. Lett. 97, 025502 (2006).
Millot, M. Identifying and discriminating phase transitions along decaying shocks with line imaging Doppler interferometric velocimetry and streaked optical pyrometry. Phys. Plasmas 23, 014503 (2016).
Larsen, J. T. & Lane, S. M. HYADES—a plasma hydrodynamics code for dense plasma studies. J. Quant. Spectrosc. Radiat. Transf. 51, 179–186 (1994).
Fratanduono, D. E. et al. Index of refraction of shock-released materials. J. Appl. Phys. 110, 083509 (2011).
Acknowledgements
We gratefully acknowledge S. Uhlich, A. Correa Barrios, C. Davis, J. Emig, E. Folsom, R. Posadas Soriano, T. Uphaus and W. Unites for target preparation, the Omega Laser Facility management, staff and support crew for excellent shot and diagnostic support with special thanks to C. Sorce, A. Sorce and J. Kendrick, discussions with S. Brygoo, R. Chau, Z. Geballe, D. Hicks, P. Loubeyre and P. Sterne, and P. Loubeyre for re-analysing XRD data. Prepared by Lawrence Livermore National Laboratory (LLNL) under contract DE-AC52-07NA27344. Omega shots were allocated by the Laboratory Basic Science program of the Laboratory for Laser Energetics at the University of Rochester, NY. Extensive computational support was provided by the LLNL Computing facility. Partial support was provided by LLNL LDRD program 17-ERD-085, the US Department of Energy through the joint FES/NNSA HEDLP program, the University of California, including UC Berkeley’s Miller Institute for Basic Research in Science, the National Science Foundation (#PHY11-25915) and NASA (#NNH12AU44I).
Author information
Authors and Affiliations
Contributions
M.M. designed the project, prepared the pre-compressed cells, fielded the laser experiments, analysed the data and wrote the manuscript. J.R.R. was the principal investigator of the Omega campaign. S.H. performed DFT–MD simulations. P.M.C., J.H.E., J.R.R., G.W.C. and R.J. developed the laser DAC platform and associated analytical methods. J.R.R., D.E.F., F.C. and D.C.S. contributed to the data analysis. All authors discussed the data and commented on the manuscript.
Corresponding author
Ethics declarations
Competing interests
The authors declare no competing financial interests.
Additional information
Publisher’s note: Springer Nature remains neutral with regard to jurisdictional claims in published maps and institutional affiliations.
Supplementary information
Supplementary Information
I. Data analysis methods, II. Optical properties and electrical conductivity, III. Molecular dynamics simulations, IV. Models, simulations and previous experiment, V. Superionic water in planetary interiors and dynamo scaling
Rights and permissions
About this article

Cite this article
Millot, M., Hamel, S., Rygg, J.R. et al. Experimental evidence for superionic water ice using shock compression. Nature Phys 14, 297–302 (2018). https://doi.org/10.1038/s41567-017-0017-4
Received:
Accepted:
Published:
Issue Date:
DOI: https://doi.org/10.1038/s41567-017-0017-4
This article is cited by
-
Rich proton dynamics and phase behaviours of nanoconfined ices
Nature Physics (2024)
-
Thermal and Tidal Evolution of Ice Giants with Growing Frozen Cores: The Case of Neptune
Space Science Reviews (2024)
-
2H-NMR study of molecular reorientation of D2O confined into the slit-shaped micropores of activated carbon fiber
Adsorption (2024)
-
Double superionicity in icy compounds at planetary interior conditions
Nature Communications (2023)
-
Thermodynamics of diamond formation from hydrocarbon mixtures in planets
Nature Communications (2023)
