
Abstract
Viable nature-based climate solutions (NbCS) are needed to achieve climate goals expressed in international agreements like the Paris Accord. Many NbCS pathways have strong scientific foundations and can deliver meaningful climate benefits but effective mitigation is undermined by pathways with less scientific certainty. Here we couple an extensive literature review with an expert elicitation on 43 pathways and find that at present the most used pathways, such as tropical forest conservation, have a solid scientific basis for mitigation. However, the experts suggested that some pathways, many with carbon credit eligibility and market activity, remain uncertain in terms of their climate mitigation efficacy. Sources of uncertainty include incomplete GHG measurement and accounting. We recommend focusing on resolving those uncertainties before broadly scaling implementation of those pathways in quantitative emission or sequestration mitigation plans. If appropriate, those pathways should be supported for their cobenefits, such as biodiversity and food security.
Main
Nature-based climate solutions (NbCS) are conservation, restoration and improved management strategies (pathways) in natural and working ecosystems with the primary motivation to mitigate GHG emissions and remove CO2 from the atmosphere1 (similar to ecosystem-based mitigation2). GHG mitigation through ecosystem stewardship is integral to meeting global climate goals, with the greatest benefit coming from near-term maximization of emission reductions, followed by CO2 removal3. Many countries (for example, Indonesia, China and Colombia) use NbCS to demonstrate progress toward national climate commitments.
The scope of NbCS is narrower than that of nature-based solutions (NbS) which include interventions that prioritize non-climate benefits alongside climate (for example, biodiversity, food provisioning and water quality improvement)4. In many cases, GHG mitigation is considered a cobenefit that results from NbS actions focused on these other challenges2. In contrast, NbCS are broader than natural climate solutions, which are primarily focused on climate mitigation through conservation, restoration and improved land management, generally not moving ecosystems beyond their unmodified structure, function or composition5. NbCS may involve moving systems beyond their original function, for example by cultivating macroalgae in water deeper than their natural habitat.
The promise of NbCS has generated a proliferation of interest in using them in GHG mitigation plans6,7; 104 of the 168 signatories to the Paris Accord included nature-based actions as part of their mitigation plans8. Success in long-term GHG management requires an accurate accounting of inputs and outputs to the atmosphere at scale, so NbCS credits must have robust, comprehensive and transparent scientific underpinnings9. Given the urgency of the climate problem, our goal is to identify NbCS pathways with a sufficient scientific foundation to provide broad confidence in their potential GHG mitigation impact, provide resources for confident implementation and identify priority research areas in more uncertain pathways. Evaluating implementation of mitigation projects is beyond our scope; this effort focuses on understanding the underlying science. The purpose is not evaluating any specific carbon crediting protocol or implementation framework but rather the current state of scientific understanding necessary to provide confidence in any NbCS.
In service of this goal, we first investigated nine biomes (boreal forests, coastal marine (salt marsh, mangrove, seagrass and coral reef), freshwater wetlands, grasslands, open ocean (large marine animal and mesopelagic zone biomass, seabed), peatlands, shrublands, temperate forests and tropical forests) and three cultivation types (agroforestry, croplands and macroalgae aquaculture); these were chosen because of their identified potential scale of global impact. In this context, impact is assessed as net GHG mitigation: the CO2 sequestered or emissions reduced, for example, discounted by understood simultaneous emissions of other GHG (as when N2O is released simultaneously with carbon sequestration in cropland soils). From there, we identified 43 NbCS pathways which have been formally implemented (with or without market action) or informally proposed. We estimated the scale of mitigation impact for each pathway on the basis of this literature and, as a proxy measure of NbCS implementation, determined eligibility and activity under existing carbon crediting protocols. Eligibility means that the pathway is addressed by an existing GHG mitigation protocol; market activity means that credits are actively being bought under those eligibility requirements. We considered pathways across a spectrum from protection to improved management to restoration to manipulated systems, but some boundaries were necessary. We excluded primarily abiotically driven pathways (for example, ocean alkalinity enhancement) or where major land use or land-use trade-offs exist (for example, afforestation)10,11,12. Of the 43 pathways, 79% are at present eligible for carbon crediting (sometimes under several methodologies) and at least 65% of those have been implemented (Supplementary Table 1). This review was then appraised by 30 independent scholars (at least three per pathway; a complete review synthesis is given in the Supplementary Data).
Consolidation of a broad body of scientific knowledge, with inherent variance, requires expert judgement. We used an expert elicitation process13,14,15 with ten experts to place each proposed NbCS pathway into one of three readiness categories following their own assessment of the scientific literature, categorized by general sources of potential uncertainty: category 1, sufficient scientific basis to support a high-quality carbon accounting system or to support the development of such a system today; category 2, a >25% chance that focused research and reasonable funding would support development of high-quality carbon accounting (that is, move to category 1) within 5 years; or category 3, a <25% chance of development of high-quality carbon accounting within 5 years (for example, due to measurement challenges, unconstrained leakage, external factors which constrain viability).
If an expert ranked a pathway as category 2, they were also asked to rank general research needs to resolve: leakage/displacement (spillover to other areas), measuring, reporting and verification (the ability to quantify all salient stocks and fluxes), basic mechanisms of action (fundamental science), durability (ability to predict or compensate for uncertainty in timescale of effectiveness due to disturbances, climate change, human activity or other factors), geographic uncertainty (place-to-place variation), scaling potential (ability to estimate impact) and setting of a baseline (ability to estimate additionality over non-action; a counterfactual). To avoid biasing towards a particular a priori framework for evaluation of the scientific literature, reviewers could use their own framework for evaluating the NbCS literature about potential climate impact and so could choose to ignore or add relevant categorizations as well. Any pathway in category 1 would not need fundamental research for implementation; research gaps were considered too extensive for useful guidance on reducing uncertainty in category 3 pathways. Estimates of the global scale of likely potential impact (PgCO2e yr−1) and cobenefits were also collected from expert elicitors. See Methods and Supplementary Information for the survey instrument.
Results
Four pathways with the highest current carbon market activity and high mitigation potential (tropical and temperate forest conservation and reforestation; Table 1 and Supplementary Data), were consistently rated as high-confidence pathways in the expert elicitation survey. Other NbCS pathways, especially in the forestry sector, were rated relatively strongly by the experts for both confidence in scientific basis and scale of potential impact, with some spread across the experts (upper right quadrant, Fig. 1). Conversely, 13 pathways were consistently marked by experts as currently highly uncertain/low confidence (median score across experts: 2.5–3.0) and placed in category 3 (for example, cropland microbial amendments and coral reef restoration; Supplementary Tables 1 and 2). For the full review, including crediting protocols currently used, literature estimates of scale and details of sub-pathways, see Supplementary Data.
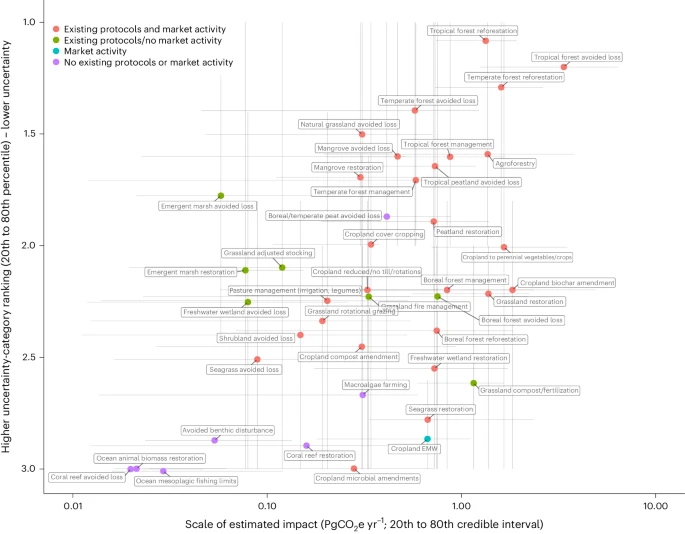
Pathways in the upper right quadrant have both high confidence in the scientific foundations and the largest potential scale of global impact; pathways in the lower left have the lowest confidence in our present scientific body of knowledge and an estimated smaller potential scale of impact. Designations of carbon credit eligibility under existing protocols and market activity at the present time are noted. Grassland enhanced mineral weathering (EMW) is not shown (mean category rating 2.9) as no scale of impact was estimated. See Supplementary Table 1 for specific pathway data. Bars represent 20th to 80th percentiles of individual estimates, if there was variability in estimates. A small amount of random noise was added to avoid overlap.
The experts assessed 26 pathways as having average confidence scores between 1.5 and 2.4, suggesting the potential for near-term resolution of uncertainties. This categorization arose from either consensus amongst experts on the uncertain potential (for example, boreal forest reforestation consistently rated category 2, with primary concerns about durability) or because experts disagreed, with some ranking category 1 and others category 3 (for example, pasture management). We note that where expert disagreement exists (seen as the spread of responses in Fig. 1 and Supplementary Table 1; also see Data availability for link to original data), this suggests caution against overconfidence in statements about these pathways. These results also suggest that confidence may be increased by targeted research on the identified sources of uncertainty (Supplementary Table 3).
Sources of uncertainty
Durability and baseline-setting were rated as high sources of uncertainty across all pathways ranked as category 2 by the experts (mean ratings of 3.6 and 3.4 out of 5, respectively; Supplementary Table 3). Understanding of mechanisms and geographic spread had the lowest uncertainty ratings (2.1 and 2.3, respectively), showing confidence in the basic science. Different subsets of pathways had different prioritizations, however, suggesting different research needs: forest-centric pathways were most uncertain in their durability and additionality (3.8 and 3.4, respectively), suggesting concerns about long-term climate and disturbance trajectories. Agricultural and grassland systems, however, had higher uncertainty in measurement methods and additionality (3.9 and 3.5 respectively). Although there were concerns about durability from some experts (for example, due to sea-level rise), some coastal blue carbon pathways such as mangrove restoration (mean category ranking: 1.7 (20th to 80th percentile 1.0–2.0)) have higher confidence than others (for example, seagrass restoration: mean category ranking 2.8, 20th to 80th percentile 2.6–3.0)), which are relatively poorly constrained in terms of net radiative forcing potential despite a potentially large carbon impact (seagrass median: 1.60 PgCO2e yr−1; see Supplementary Data for more scientific literature estimates).
Scale of impact
For those pathways with lower categorization by the expert elicitation (category 2 or 3) at the present time, scale of global impact is a potential heuristic for prioritizing further research. High variability, often two orders of magnitude, was evident in the mean estimated potential PgCO2e yr−1 impacts for the different pathways (Fig. 1 and Supplementary Table 2) and the review of the literature found even larger ranges produced by individual studies (Supplementary Data). A probable cause of this wide range was different constraints on the estimated potential, with some studies focusing on potential maximum impact and others on more constrained realizable impacts. Only avoided loss of tropical forest and cropland biochar amendment were consistently estimated as having the likely potential to mitigate >2 PgCO2e yr−1, although biochar was considered more uncertain by experts due to other factors germane to its overall viability as a climate solution, averaging a categorization of 2.2. The next four highest potential impact pathways, ranging from 1.6 to 1.7 PgCO2e yr−1, spanned the spectrum from high readiness (temperate forest restoration) to moderate (cropland conversion from annual to perennial vegetation and grassland restoration) to low (seagrass restoration, with main uncertainties around scale of potential impact and durability).
There was high variability in the elicitors’ estimated potential scale of impact, even in pathways with strong support, such as tropical forest avoided loss (20th to 80th percentile confidence interval: 1–8 PgCO2e yr−1), again emphasizing the importance of consistent definitions and constraints on how NbCS are measured, evaluated and then used in broad-scale climate change mitigation planning and budgeting. Generally, as pathway readiness decreased (moving from category 1 to 3), the elicitor-estimated estimates of GHG mitigation potential decreased (Supplementary Fig. 1). Note that individual studies from the scientific literature may have higher or lower estimates (Supplementary Data).
Expert elicitation meta-analyses suggest that 6–12 responses are sufficient for a robust and stable quantification of responses15. We tested that assumption via a Monte Carlo-based sensitivity assessment. Readiness categorizations by the ten experts were robust to a Monte Carlo simulation test, where further samples were randomly drawn from the observed distribution of responses: mean difference between the original and the boot-strapped data was 0.02 (s.d. = 0.05) with an absolute difference average of 0.06 (s.d. = 0.06). The maximum difference in readiness categorization means across all pathways was 0.20 (s.d. = 0.20) (Supplementary Table 2). The full dataset of responses is available online (see ʻData availabilityʼ).
Discussion
These results highlight opportunities to accelerate implementation of NbCS in well-supported pathways and identify critical research needs in others (Fig. 1). We suggest focusing future efforts on resolving identified uncertainties for pathways at the intersection between moderate average readiness (for example, mean categorizations between ~1.5 and 2.0) and high potential impact (for example, median >0.5 PgCO2e yr−1; Supplementary Table 1): agroforestry, improved tropical and temperate forest management, tropical and boreal peatlands avoided loss and peatland restoration. Many, although not all, experts identified durability and baseline/additionality as key concerns to resolve in those systems; research explicitly targeted at those specific uncertainties (Supplementary Table 3) could rapidly improve confidence in those pathways.
We recommend a secondary research focus on the lower ranked (mean category 2.0 to 3.0) pathways with estimated potential impacts >1 PgCO2e yr−1 (Supplementary Fig. 2). For these pathways, explicit, quantitative incorporation into broad-scale GHG management plans will require further focus on systems-level carbon/GHG understandings to inspire confidence at all stages of action and/or identifying locations likely to support durable GHG mitigation, for example ref. 16. Examples of this group include avoided loss and degradation of boreal forests (for example, fire, pests and pathogens and albedo16) and effective mesopelagic fishery management, which some individual studies estimate would avoid future reductions of the currently sequestered 1.5–2.0 PgC yr−1 (refs. 17,18). These pathways may turn out to have higher or lower potential than the expert review suggests, on the basis of individual studies (Supplementary Data) but strong support will require further, independent verification of that potential.
We note that category 3 rankings by expert elicitation do not necessarily imply non-viability but simply that much more research is needed to confidently incorporate actions into quantitative GHG mitigation plans. We found an unsurprising trend of lower readiness categorization with lower pathway familiarity (Supplementary Fig. 3). This correlation may result from two, non-exclusive potential causes: (1) lower elicitor expertise in some pathways (inevitable, although the panel was explicitly chosen for global perspectives, connections and diverse specialties) and (2) an actual lack of scientific evidence in the literature, which leads to that self-reported lack of familiarity, a common finding in the literature review (Supplementary Data). Both explanations suggest a need to better consolidate, develop and disseminate the science in each pathway for global utility and recognition.
Our focus on GHG-related benefits in no way diminishes the substantial conservation, environmental and social cobenefits of these pathways (Supplementary Table 4), which often exceed their perceived climate benefits1,19,20,21. Where experts found climate impacts to remain highly uncertain but other NbS benefits are clear (for example, biodiversity and water quality; Supplementary Table 4), other incentives or financing mechanisms independent of carbon crediting should be pursued. While the goals here directly relate to using NbCS as a reliably quantifiable part of global climate action planning and thus strong GHG-related scientific foundations, non-climate NbS projects may provide climate benefits that are less well constrained (and thus less useful from a GHG budgeting standpoint) but also valuable. Potential trade-offs, if any, between ecosystem services and management actions, such as biodiversity and positive GHG outcomes, should be explored to ensure the best realization of desired goals2.
Finally, our focus in this study was on broad-scale NbCS potential in quantitative mitigation planning because of the principal and necessary role of NbCS in overall global warming targets. We recognize the range of project conditions that may increase, or decrease, the rigour of any pathway outside the global-scale focus here. We did not specifically evaluate the large and increasing number of crediting concepts (by pathway: Supplementary Data), focusing rather on the underlying scientific body of knowledge within those pathways. Some broad pathways may have better defined sub-pathways within them, with a smaller potential scale of impact but potentially lower uncertainty (for example, macroalgae harvest cycling). Poorly enacted NbCS actions and/or crediting methodologies at project scales may result in loss of benefits even from high-ranking pathways22,23,24 and attention to implementation should be paramount. Conversely, strong, careful project-scale methodologies may make lower readiness pathways beneficial for a given site.
Viable NbCS are vital to global climate change mitigation but NbCS pathways that lack strong scientific underpinnings threaten global accounting by potentially overestimating future climate benefits and eroding public trust in rigorous natural solutions. Both the review of the scientific literature and the expert elicitation survey identified high potential ready-to-implement pathways (for example, tropical reforestation), reinforcing present use of NbCS in planning.
However, uncertainty remains about the quantifiable GHG mitigation of some active and nascent NbCS pathways. On the basis of the expert elicitation survey and review of the scientific literature, we are concerned that large-scale implementation of less scientifically well-founded NbCS pathways in mitigation plans may undermine net GHG budget planning; those pathways require more study before they can be confidently promoted at broad scales and life-cycle analyses to integrate system-level emissions when calculating totals. The expert elicitation judgements suggest a precautionary approach to scaling lower confidence pathways until the scientific foundations are strengthened, especially for NbCS pathways with insufficient measurement and monitoring10,24,25 or poorly understood or measured net GHG mitigation potentials16,26,27,28. While the need to implement more NbCS pathways for reducing GHG emissions and removing carbon from the atmosphere is urgent, advancing the implementation of poorly quantified pathways (in relation to their GHG mitigation efficacy) could give the false impression that they can balance ongoing, fossil emissions, thereby undermining overall support for more viable NbCS pathways. Explicitly targeting research to resolve these uncertainties in the baseline science could greatly bolster confidence in the less-established NbCS pathways, benefiting efforts to reduce GHG concentrations29.
The results of this study should inform both market-based mechanisms and non-market approaches to NbCS pathway management. Research and action that elucidates and advances pathways to ensure a solid scientific basis will provide confidence in the foundation for successfully implementing NbCS as a core component of global GHG management.
Methods
NbCS pathway selection
We synthesized scientific publications for nine biomes (boreal forests, coastal blue carbon, freshwater wetlands, grasslands, open ocean blue carbon, peatlands, shrublands, temperate forests and tropical forests) and three cultivation types (agroforestry, croplands and macroalgae aquaculture) (hereafter, systems) and the different pathways through which they may be able to remove carbon or reduce GHG emissions. Shrublands and grasslands were considered as independent ecosystems; nonetheless, we acknowledge that there is overlap in the numbers presented here because shrublands are often included with grasslands5,30,31,32,33.
The 12 systems were chosen because they have each been identified as having potential for emissions reductions or carbon removal at globally relevant scales. Within these systems, we identified 43 pathways which either have carbon credit protocols formally established or informally proposed for review (non-carbon associated credits were not evaluated). We obtained data on carbon crediting protocols from international, national and regional organizations and registries, such as Verra, American Carbon Registry, Climate Action Reserve, Gold Standard, Clean Development Mechanism, FAO and Nori. We also obtained data from the Voluntary Registry Offsets Database developed by the Berkeley Carbon Trading Project and Carbon Direct company34. While we found evidence of more Chinese carbon crediting protocols, we were not able to review these because of limited publicly available information. To maintain clarity and avoid misrepresentation, we used the language as written in each protocol. A full list of the organizations and registries for each system can be found in the Supplementary Data.
Literature searches and synthesis
We reviewed scientific literature and reviews (for example, IPCC special reports) to identify studies reporting data on carbon stocks, GHG dynamics and sequestration potential of each system. Peer-reviewed studies and meta-analyses were identified on Scopus, Web of Science and Google Scholar using simple queries combining the specific practice or pathway names or synonyms (for example, no-tillage, soil amendments, reduced stocking rates, improved forest management, avoided forest conversion and degradation, avoided mangrove conversion and degradation) and the following search terms: ‘carbon storage’, ‘carbon stocks’, ‘carbon sequestration’, ‘carbon sequestration potential’, ‘additional carbon storage’, ‘carbon dynamics’, ‘areal extent’ or ‘global’.
The full literature review was conducted between January and October 2021. We solicited an independent, external review of the syntheses (obtaining from at least three external reviewers per natural or working system; see p. 2 of the Supplementary Data) as a second check against missing key papers or misinterpretation of data. The review was generally completed in March 2022. Data from additional relevant citations were added through October 2022 as they were discovered. For a complete list of all literature cited, see pp. 217–249 of the Supplementary Data.
From candidate papers, the papers were considered if their results/data could be applied to the following central questions:
-
(1)
How much carbon is stored (globally) at present in the system (total and on average per hectare) and what is the confidence?
-
(2)
At the global level, is the system a carbon source or sink at this time? What is the business-as-usual projection for its carbon dynamics?
-
(3)
Is it possible, through active management, to either increase net carbon sequestration in the system or prevent carbon emissions from that system? (Note that other GHG emissions and forcings were included here as well.)
-
(4)
What is the range of estimates for how much extra carbon could be sequestered globally?
-
(5)
How much confidence do we have in the present methods to detect any net increases in carbon sequestration in a system or net changes in areal extent of that?
From each paper, quantitative estimates for the above questions were extracted for each pathway, including any descriptive information/metadata necessary to understand the estimate. In addition, information on sample size, sampling scheme, geographic coverage, timeline of study, timeline of projections (if applicable) and specific study contexts (for example, wind-break agroforestry) were recorded.
We also tracked where the literature identified trade-offs between carbon sequestered or CO2 emissions reduced and emissions of other GHG (for example, N2O or methane) for questions three and five above. For example, wetland restoration can result in increased CO2 uptake from the atmosphere. However, it can also increase methane and N2O emissions to the atmosphere. Experts were asked to consider the uncertainty in assessing net GHG mitigation as they categorized the NbCS pathways.
Inclusion of each pathway in mitigation protocols and the specific carbon registries involved were also identified. These results are reported (grouped or individually as appropriate) in the Supplementary Data, organized by the central questions and including textual information for interpretation. The data and protocol summaries for each of the 12 systems were reviewed by at least three scientists each and accordingly revised.
These summaries were provided to the expert elicitation group as optional background information.
Unit conversions
Since this synthesis draws on literature from several sources that use different methods and units, all carbon measurements were standardized to the International System of Units (SI units). When referring to total stocks for each system, numbers are reported in SI units of elemental carbon (that is, PgC). When referring to mitigation potential, elemental carbon was converted to CO2 by multiplying by 3.67. Differences in methodology, such as soil sampling depth, make it difficult to standardize across studies. Where applicable, the specific measurement used to develop each stock estimate is reported.
Expert elicitation process
To assess conclusions brought about by the initial review process described above, we conducted an expert elicitation survey to consolidate and add further, independent assessments to the original literature review. The expert elicitation survey design followed best practice recommendations14, with a focus on participant selection, explicitly defining uncertainty, minimizing cognitive and overconfidence biases and clarity of focus. Research on expert elicitation suggests that 6–12 responses are sufficient for a stable quantification of responses15. We identified >40 potential experts via a broad survey of leading academics, science-oriented NGO and government agency publications and products. These individuals have published on several NbCS pathways or could represent larger research efforts that spanned the NbCS under consideration. Careful attention was paid to the gender and sectoral breakdown of respondents to ensure equitable representation. Of the invitees, ten completed the full elicitation effort. Experts were offered compensation for their time.
Implementation of the expert elicitation process followed the IDEA protocol15. Briefly, after a short introductory interview, the survey was sent to the participants. Results were anonymized and standardized (methods below) and a meeting held with the entire group to discuss the initial results and calibrate understanding of questions. The purpose of this meeting was not to develop consensus on a singular answer but to discuss and ensure that all questions are being considered in the same way (for example, clarifying any potentially confusing language, discussing any questions that emerged as part of the process). The experts then revisited their initial rankings to provide final, anonymous rankings which were compiled in the same way. These final rankings are the results presented here and may be the same or different from the initial rankings, which were discarded.
Survey questions
The expert elicitation survey comprised five questions for each pathway. The data were collected via Google Forms and collated anonymously at the level of pathways, with each respondent contributing one datapoint for each pathway. The experts reported their familiarity (or the familiarity of the organization whose work they were representing) with the pathway and other cobenefits for the pathways.
The initial question ranked the NbCS pathway by category, from one to three.
-
Category 1 was defined as a pathway with sufficient scientific knowledge to support a high-quality carbon accounting system today (for example, meets the scientific criteria identified in the WWF-EDF-Oeko Institut and ICAO TAB) or to support the development of such a system today. The intended interpretation is that sufficient science is available for quantifying and verifying net GHG mitigation. Note that experts were not required to reference any given ‘high-quality’ crediting framework, which were provided only as examples. In other words, the evaluation was not intended to rank a given framework (for example, ref. 35) but rather expert confidence in the fundamental scientific understandings that underpin potential for carbon accounting overall. To this end, no categorization of uncertainty was required (reviewers could skip categorizations they felt were not necessary) and space was available to fill in new categories by individual reviewers (if they felt a category was missing or needed). Uncertainties at this category 1 level are deemed ‘acceptable’, for example, not precluding accounting now, although more research may further substantiate high-quality credits.
-
Category 2 pathways have a good chance (>25%) that with more research and within the next 5 years, the pathway could be developed into a high-quality pathway for carbon accounting and as a nature-based climate solution pathway. For these pathways, further understanding is needed for factors such as baseline processes, long-term stability, unconstrained fluxes, possible leakage or other before labelling as category 1 but the expert is confident that information can be developed, in 5 years or less, with more work. The >25% chance threshold and 5-year timeframe were determined a priori to reflect and identify pathways that experts identified as having the potential to meet the Paris Accord 2030 goal. Other thresholds (for example, longer timeframes) could have been chosen, which would impact the relative distribution of pathways in categories 2 and 3 (for example, a longer timeframe allowed could move some pathways from category 3 into category 2, for some reviewers). We emphasize that category 3 pathways do not necessarily mean non-valuable approaches but longer timeframes required for research than the one set here.
-
Category 3 responses denoted pathways that the expert thought had little chance (<25%) that with more research and within the next 5 years, this pathway could be developed into a suitable pathway for managing as a natural solutions pathway, either because present evidence already suggests GHG reduction is not likely to be viable, co-emissions or other biophysical feedbacks may offset those gains or because understanding of key factors is lacking and unlikely to be developed within the next 5 years. Notably, the last does not mean that the NbCS pathway is not valid or viable in the long-term, simply that physical and biological understandings are probably not established enough to enable scientific rigorous and valid NbCS activity in the near term.
The second question asked the experts to identify research gaps associated with those that they ranked as category 2 pathways to determine focal areas for further research. The experts were asked to rank concerns about durability (ability to predict or compensate for uncertainty in timescale of effectiveness due to disturbances, climate change, human activity or other factors), geographic uncertainty (place-to-place variation), leakage or displacement (spillover of activities to other areas), measuring, reporting and verification (MRV, referring to the ability to quantify all salient stocks and fluxes to fully assess climate impacts), basic mechanisms of action (fundamental science), scaling potential (ability to estimate potential growth) and setting of a baseline (ability to reasonably quantify additionality over non-action, a counterfactual). Respondents could also enter a different category if desired. For complete definitions of these categories, see the survey instrument (Supplementary Information). This question was not asked if the expert ranked the pathway as category 1, as those were deemed acceptable, or for category 3, respecting the substantial uncertainty in that rating. Note that responses were individual and so the same NbCS pathway could receive (for example) several individual category 1 rankings, which would indicate reasonable confidence from those experts, and several category 2 rankings from others, which would indicate that those reviewers have lingering concerns about the scientific basis, along with their rankings of the remaining key uncertainties in those pathways. These are important considerations, as they reflect the diversity of opinions and research priorities; individual responses are publicly available (anonymized: https://doi.org/10.5281/zenodo.7859146).
The third question involved quantification of the potential for moving from category 2 to 1 explicitly. Following ref. 14, the respondents first reported the lowest plausible value for the potential likelihood of movement (representing the lower end of a 95% confidence interval), then the upper likelihood and then their best guess for the median/most likely probability. They were also asked for the odds that their chosen interval contained the true value, which was used to scale responses to standard 80% credible intervals and limit overconfidence bias13,15. This question was not asked if the expert ranked the pathway as category 3, respecting the substantial uncertainty in that rating.
The fourth question involved the scale of potential impact from the NbCS, given the range of uncertainties associated with effectiveness, area of applicability and other factors. The question followed the same pattern as the third, first asking about lowest, then highest, then best estimate for potential scale of impact (in PgCO2e yr−1). Experts were again asked to express their confidence in their own range, which was used to scale to a standard 80% credible interval. This estimate represents a consolidation of the best-available science by the reviewers. For a complete review including individual studies and their respective findings, see the Supplementary Data. This question was not asked if the expert ranked the pathway as category 3, respecting the substantial uncertainty in that rating.
Final results
After collection of the final survey responses, results were anonymized and compiled by pathway. For overall visualization and discussion purposes, responses were combined into a mean and 20th to 80th percentile range. The strength of the expert elicitation process lies in the collection of several independent assessments. Those different responses represent real differences in data interpretation and synthesis ascribed by experts. This can have meaningful impacts on decision-making by different individuals and organizations (for example, those that are more optimistic or pessimistic about any given pathway). Therefore, individual anonymous responses were retained by pathway to show the diversity of responses for any given pathway. The experts surveyed, despite their broad range of expertise, ranked themselves as less familiar with category 3 pathways than category 1 or 2 (linear regression, P < 0.001, F = 59.62, 394); this could be because of a lack of appropriate experts—although they represented all principal fields—or simply because the data are limited in those areas.
Sensitivity
To check for robustness against sample size variation, we conducted a Monte Carlo sensitivity analysis of the data on each pathway to generate responses of a further ten hypothetical experts. Briefly, the extra samples were randomly drawn from the observed category ranking mean and standard deviations for each individual pathway and appended to the original list; values <1 or >3 were truncated to those values. This analysis resulted in only minor differences in the mean categorization across all pathways: the mean difference between the original and the boot-strapped data was 0.02 (s.d. = 0.05) with an absolute difference average of 0.06 (s.d. = 0.06). The maximum difference in means across all pathways was 0.20 (s.d. = 0.20) (Supplementary Table 2). The results suggest that the response values are stable to additional responses.
All processing was done in R36, with packages including fmsb37 and forcats38.
Data availability
Anonymized expert elicitation responses are available on Zenodo39: https://doi.org/10.5281/zenodo.7859146.
Code availability
R code for analysis available on Zenodo39: https://doi.org/10.5281/zenodo.7859146.
References
Novick, K. A. et al. Informing nature‐based climate solutions for the United States with the best‐available science. Glob. Change Biol. 28, 3778–3794 (2022).
Cohen-Shacham, E., Walters, G., Janzen, C. & Maginnis, S. (eds) Nature-based Solutions to Address Global Societal Challenges (IUCN, 2016).
IPCC Climate Change 2021: The Physical Science Basis (eds Masson-Delmotte, V. et al.) (Cambridge Univ. Press, 2021).
Seddon, N. et al. Understanding the value and limits of nature-based solutions to climate change and other global challenges. Philos. Trans. R. Soc. B 375, 20190120 (2020).
Griscom, B. W. et al. Natural climate solutions. Proc. Natl Acad. Sci. USA 114, 11645–11650 (2017).
Blaufelder, C., Levy, C., Mannion, P. & Pinner, D. A. Blueprint for Scaling Voluntary Carbon Markets to Meet the Climate Challenge (McKinsey & Company, 2021).
Arcusa, S. & Sprenkle-Hyppolite, S. Snapshot of the carbon dioxide removal certification and standards ecosystem (2021–2022). Clim. Policy 22, 1319–1332 (2022).
Seddon, N. et al. Global recognition of the importance of nature-based solutions to the impacts of climate change Glob. Sustain. 3, pe15 (2020).
Anderegg, W. R. Gambling with the climate: how risky of a bet are natural climate solutions? AGU Adv. 2, e2021AV000490 (2021).
Gattuso, J. P. et al. Ocean solutions to address climate change and its effects on marine ecosystems. Front. Mar. Sci. 5, p337 (2018).
Bach, L. T., Gill, S. J., Rickaby, R. E., Gore, S. & Renforth, P. CO2 removal with enhanced weathering and ocean alkalinity enhancement: potential risks and co-benefits for marine pelagic ecosystems. Front. Clim. 1, 7 (2019).
Doelman, J. C. et al. Afforestation for climate change mitigation: potentials, risks and trade‐offs. Glob. Change Biol. 26, 1576–1591 (2019).
Speirs-Bridge, A. et al. Reducing overconfidence in the interval judgments of experts. Risk Anal. 30, 512–523 (2010).
Morgan, M. G. Use (and abuse) of expert elicitation in support of decision making for public policy. Proc. Natl Acad. Sci. USA 111, 7176–7184 (2014).
Hemming, V., Burgman, M. A., Hanea, A. M., McBride, M. F. & Wintle, B. C. A practical guide to structured expert elicitation using the IDEA protocol. Methods Ecol. Evol. 9, 169–180 (2018).
Anderegg, W. R. et al. Climate-driven risks to the climate mitigation potential of forests. Science 368, eaaz7005 (2020).
Boyd, P. W., Claustre, H., Levy, M., Siegel, D. A. & Weber, T. Multi-faceted particle pumps drive carbon sequestration in the ocean. Nature 568, 327–335 (2019).
Saba, G. K. et al. Toward a better understanding of fish-based contribution to ocean carbon flux. Limnol. Oceanogr. 66, 1639–1664 (2021).
Seddon, N., Turner, B., Berry, P., Chausson, A. & Girardin, C. A. Grounding nature-based climate solutions in sound biodiversity science. Nat. Clim. Change 9, 84–87 (2019).
Soto-Navarro, C. et al. Mapping co-benefits for carbon storage and biodiversity to inform conservation policy and action. Philos. Trans. R. Soc. B 375, 20190128 (2020).
Schulte, I., Eggers, J., Nielsen, J. Ø. & Fuss, S. What influences the implementation of natural climate solutions? A systematic map and review of the evidence. Environ. Res. Lett. 17, p013002 (2022).
West, T. A., Börner, J., Sills, E. O. & Kontoleon, A. Overstated carbon emission reductions from voluntary REDD+ projects in the Brazilian Amazon. Proc. Natl Acad. Sci. USA 117, 24188–24194 (2020).
Di Sacco, A. et al. Ten golden rules for reforestation to optimize carbon sequestration, biodiversity recovery and livelihood benefits. Glob. Change Biol. 27, 1328–1348 (2021).
López-Vallejo, M. in Towards an Emissions Trading System in Mexico: Rationale, Design and Connections with the Global Climate Agenda (ed. Lucatello, S.) 191–221 (Springer, 2022)
Oldfield, E. E. et al. Realizing the potential of agricultural soil carbon sequestration requires more effective accounting. Science 375, 1222–1225 (2022).
Burkholz, C., Garcias-Bonet, N. & Duarte, C. M. Warming enhances carbon dioxide and methane fluxes from Red Sea seagrass (Halophila stipulacea) sediments. Biogeosciences 17, 1717–1730 (2020).
Guenet, B. et al. Can N2O emissions offset the benefits from soil organic carbon storage? Glob. Change Biol. 27, 237–256 (2021).
Rosentreter, J. A., Al‐Haj, A. N., Fulweiler, R. W. & Williamson, P. Methane and nitrous oxide emissions complicate coastal blue carbon assessments. Glob. Biogeochem. Cycles 35, pe2020GB006858 (2021).
Schwartzman, S. et al. Environmental integrity of emissions reductions depends on scale and systemic changes, not sector of origin. Environ. Res. Lett. 16, p091001 (2021).
Crop and Livestock Products Database (FAO, 2022); https://www.fao.org/faostat/en/#data/QCL
Fargione, J. E. et al. Natural climate solutions for the United States. Sci. Adv. 4, eaat1869 (2018).
Meyer, S. E. Is climate change mitigation the best use of desert shrublands? Nat. Resour. Environ. Issues 17, 2 (2011).
Lorenz, K. & Lal, R. Carbon Sequestration in Agricultural Ecosystems (Springer Cham, 2018).
Haya, B., So, I. & Elias, M. The Voluntary Registry Offsets Database (Univ. California, 2021); https://gspp.berkeley.edu/faculty-and-impact/centers/cepp/projects/berkeley-carbon-trading-project/offsets-database
Core Carbon Principles; CCP Attributes; Assessment Framework for Programs; and Assessment Procedure (ICVCM, 2023); https://icvcm.org/the-core-carbon-principles/
R Core Team. R: A Language and Environment for Statistical Computing (R Foundation for Statistical Computing, 2022).
Nakazawa, M. fmsb: Functions for medical statistics book with some demographic data. R package version 0.7.4 https://CRAN.R-project.org/package=fmsb (2022).
Wickham, H. forcats: Tools for working with categorical variables (factors). R package version 0.5.2 https://CRAN.R-project.org/package=forcats (2022)
Buma, B. Nature-based climate solutions: expert elicitation data and analysis code. Zenodo https://doi.org/10.5281/zenodo.7859146 (2023).
Acknowledgements
This research was supported through gifts to the Environmental Defense Fund from the Bezos Earth Fund, King Philanthropies and Arcadia, a charitable fund of L. Rausing and P. Baldwin. We thank J. Rudek for help assembling the review and 30 experts who reviewed some or all of those data and protocol summaries (Supplementary Data). S.M. was supported by a cooperative agreement between the National Science Foundation and Battelle that sponsors the National Ecological Observatory Network programme.
Author information
Authors and Affiliations
Contributions
D.R.G. and B.B. conceived of and executed the study design. D.R.G., K.M.K., J.R.C., A.J.E., R.F., E.H., J.M.L., R.N.L., C.M., L.A.M., E.E.O., J.P., A.M.R., N.A.R., C.S. and N.U.A. coordinated and conducted the literature review. G.M. and B.B. primarily designed the survey. A. Bartuska, A. Bidlack, B.B., J.N.S., K.N., P.E., P.F., R.D. and S.M. contributed to the elicitation. B.B. conducted the analysis and coding. S.P.H. coordinated funding. B.B. and D.R.G. were primary writers; all authors were invited to contribute to the initial drafting.
Corresponding author
Ethics declarations
Competing interests
The authors declare no competing interests. In the interest of full transparency, we note that while B.B., D.R.G., K.M.K., A.B., J.R.C., A.J.E., R.F., E.H., J.M.L., R.N.L., C.M., L.A.M., E.E.O., J.P., A.M.R., N.A.R., C.S., N.U.A., S.P.H. and P.E. are employed by organizations that have taken positions on specific NbCS frameworks or carbon crediting pathways (not the focus of this work), none have financial or other competing interest in any of the pathways and all relied on independent science in their contributions to the work.
Peer review
Peer review information
Nature Climate Change thanks Camila Donatti, Connor Nolan and the other, anonymous, reviewer(s) for their contribution to the peer review of this work.
Additional information
Publisher’s note Springer Nature remains neutral with regard to jurisdictional claims in published maps and institutional affiliations.
Supplementary information
Supplementary Information
Supplementary Tables 1–4, Figs. 1–3 and survey instrument.
Supplementary Data
Literature review and list of reviewers.
Rights and permissions
Open Access This article is licensed under a Creative Commons Attribution 4.0 International License, which permits use, sharing, adaptation, distribution and reproduction in any medium or format, as long as you give appropriate credit to the original author(s) and the source, provide a link to the Creative Commons licence, and indicate if changes were made. The images or other third party material in this article are included in the article’s Creative Commons licence, unless indicated otherwise in a credit line to the material. If material is not included in the article’s Creative Commons licence and your intended use is not permitted by statutory regulation or exceeds the permitted use, you will need to obtain permission directly from the copyright holder. To view a copy of this licence, visit http://creativecommons.org/licenses/by/4.0/.
About this article

Cite this article
Buma, B., Gordon, D.R., Kleisner, K.M. et al. Expert review of the science underlying nature-based climate solutions. Nat. Clim. Chang. 14, 402–406 (2024). https://doi.org/10.1038/s41558-024-01960-0
Received:
Accepted:
Published:
Issue Date:
DOI: https://doi.org/10.1038/s41558-024-01960-0
