Abstract
Background:
The pro-inflammatory cytokine interleukin-6 (IL6) promotes colorectal cancer (CRC) development. It is also known to regulate cytochrome P450 (CYP450) enzymes, which are involved in CRC tumour initiation and promotion via activation of chemical carcinogens. Here, IL6 regulation of CYP450 expression was investigated in CRC.
Methods:
The effect of IL6 on CYP 1A1, 1B1 and 2E1 expression was determined in vitro using CRC cell lines HCT116 and SW480, and CYP450 expression was determined by immunohistochemistry in CRC tissues previously shown to have increased levels of IL6.
Results:
In mechanistic studies, IL6 treatment significantly induced CYP1B1 and CYP2E1, but not CYP1A1, gene expression in HCT116 and SW480 cells. CYP2E1 expression regulation occurred via a transcriptional mechanism involving STAT3. For CYP1B1 regulation, IL6 downregulated the CYP1B1-targeting microRNA miR27b through a mechanism involving DNA methylation. In clinical samples, the expression of CYP1B1 and CYP2E1, but not CYP1A1, was significantly increased in malignant tissue overexpressing IL6 compared with matched adjacent normal tissue.
Conclusions:
Colonic inflammation with the presence of IL6 associated with neoplastic tissue can alter metabolic competency of epithelial cells by manipulating CYP2E1 and CYP1B1 expression through transcriptional and epigenetic mechanisms. This can lead to increased activation of dietary carcinogens and DNA damage, thus promoting colorectal carcinogenesis.
Main
Colorectal cancer (CRC) is one of the most common malignancies in the Western world where it is the second highest cause of cancer-related mortality (Tenesa and Dunlop, 2009). Despite multiple advances in treating the disease, 5-year survival rates have not significantly improved in the last 20 years highlighting the need for new diagnosis strategies.
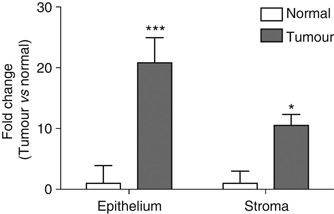
Local inflammation in the colon is a known risk for CRC development and progression (Feagins et al, 2009). We have previously reported increased expression of a number of inflammatory markers including pro-inflammatory cytokine interleukin-6 (IL6), a key regulator of inflammation, in colon tumour tissue and stroma (Figure 1) (Maihofner et al, 2003; Charalambous et al, 2003; Charalambous et al, 2009). Indeed, stromal cells including tumour-associated immune cells and fibroblasts release high levels of IL6 (up to 6000 pg ml−1) in the colorectal tumour microenvironment (Nagasaki et al, 2014). Furthermore, elevated serum levels of IL6 are associated with poor disease outcome and non-steroidal anti-inflammatory drugs are known to reduce CRC risk by lowering levels of inflammation (Williams et al, 1997; Smalley et al, 1999).
IL6 expression is increased in epithelial cells and stroma of colorectal tumour samples. Data are adapted from our previous publication (Maihofner et al, 2003) and are shown as fold change of immunohistochemistry score relative to control. Significant differences from normal tissue were calculated using Wilcoxon’s signed-rank test (*P<0.05, ***P<0.001).
Interleukin-6 is also known to regulate CYP enzyme expression. Studies in hepatocytes have generally shown that IL6 inhibits CYP450 expression including CYP 1A1, 1A2, 3A4 and 2E1 (Abdel-Razzak et al, 1993; Jover et al, 2002; Hakkola et al, 2003). However, conflicting results have been reported; IL6 has also been shown to induce CYP2E1 in astrocytes (Tindberg et al, 1996), suggesting that the effects of IL6 on CYP450 expression vary depending on tissue type and the relation between IL6 and CYP450 expression has not yet been defined in the colon. CYP1B1 is known to be overexpressed in a number of tumour types including lung, colon and breast (Murray et al, 1997). A recent study in human hepatocellular carcinoma cells has reported that IL6 treatment induced CYP1B1 gene and protein expression (Kurzawski et al, 2012), suggesting that IL6 is able to regulate CYP1B1. However, there have been very few other studies to confirm this effect of IL6 on CYP1B1. Furthermore, despite these numerous reports of IL6 regulating CYP450s, the specific molecular mechanisms underlying the effects are not yet well understood.
MicroRNAs (miRNAs) are small, ∼22 nucleotide long non-coding gene-regulating RNAs; they silence gene expression by binding to target mRNAs. MicroRNAs only require partial base complementarity to bind to their targets and can thus target a number of different mRNAs. Recent studies have found that miRNAs can modulate CYP450 expression. For instance, miR27b and miR378 have been reported to directly regulate CYP1B1 and CYP2E1 expression, respectively (Tsuchiya et al, 2006; Mohri et al, 2010). Furthermore, emerging evidence suggests that epigenetic events including DNA methylation and miRNA expression are involved in CRC initiation and progression (Suzuki et al, 2012). Interestingly, IL6 has been shown to alter miRNA expression profiles (Yang et al, 2010) and to induce genome-wide methylation of promoter regions (Webbe et al, 2006) resulting in gene silencing, thus epigenetic mechanisms may be involved in IL6-mediated regulation of CYP450s.
To investigate the relationship between IL6 and CYP450 expression in the neoplastic colon, we first determined the expression of the CYP450 enzymes CYP 1A1, 1B1 and 2E1 in the human CRC cell lines HCT116 and SW480 with subsequent mechanistic studies to confirm increased levels of IL6 could alter CYP450 expression and propose underlying mechanisms. Here to extend the in vitro results, we measured the expression of the same CYP450s in malignant tissues resected from CRC patients that have increased expression of IL6 in the epithelium and stroma (Figure 1; Maihofner et al, 2003), and compared expression with that in adjacent normal tissues.
Materials and methods
Cell culture
The human colorectal adenocarcinoma cell lines HCT116 and SW480 were obtained from ATCC (LGC Prochem, Middlesex, UK) and were routinely cultured in RPMI-1640 medium (GIBCO, Life Technologies, Paisley, UK) supplemented with 10% fetal bovine serum (FBS), 100 units ml−1 penicillin, 100 μg ml−1 streptomycin and 2 mM L-glutamine (GIBCO, Life Technologies). All cells were incubated at 37 °C in a humidified incubator (5% CO2). Cells between passages 3 and 7 were used in the experiments.
IL6 treatment and demethylation/STAT3 inhibition
Before treatment, HCT116 and SW480 were maintained in culture medium supplemented with 5% dextran-coated charcoal-stripped FBS for at least 72 h. Cells were seeded at a density of 1 × 10⁵ cells per well of a 6-well plate. HCT116 and SW480 do not express IL6; cells were treated for 24 and 48 h with recombinant human IL6 (HumanKine, Sigma-Aldrich, Dorset, UK) dissolved in phosphate-buffered saline (PBS) containing 0.1% human serum albumin (Sigma-Aldrich) at doses of 0, 100 and 1000 pg ml−1 (chosen within the range secreted by stromal cells in colon tumour microenvironment). For demethylation/STAT3 inhibition, cells were co-treated for 24 and/or 48 h with 1000 pg ml−1 IL6 and either 4 μM 5-aza-2′-deoxycytidine (Sigma-Aldrich) or 25 μM STAT3 inhibitor (STAT3 inhibitor VIII 5,15-diphenylporphyrin, Millipore, Feltham, UK), respectively. STAT3 inhibitor and 5-aza-2′-deoxycytidine were dissolved in DMSO (final vehicle control concentration of 0.1%).
RNA extraction
Total RNA was isolated from cells using TRIzol reagent (Invitrogen, Life Technologies) according to the manufacturer’s protocol. RNA extracts were quantified by UV spectroscopy (UV–vis Spectrophotometer, Implen, Essex, UK) with purity assessed from 260/280 nm and 260/230 nm ratios. Extracts were stored at −80 °C until used.
Reverse transcription and quantitative PCR
For mRNA reverse transcription, RNA extracts (100–500 ng) from each sample were added to 300 ng of random primers, heated for 5 min at 65 °C and then immediately placed on ice. Each sample was incubated with 0.5 mM dNTPs, 1 × first strand buffer, 8 μM dithiothreitol and 100 units of Superscript II reverse transcriptase (Invitrogen, Paisley, UK) for 10 min at 25 °C, 90 min at 42 °C and 15 min at 70 °C on a thermocycler (Peltier Thermal Cycler PTC-200, MJ Research, Waltham, MA, USA). An miRNA reverse transcription kit was used for miRNA expression according to the manufacturer’s protocol (Taqman, Applied Biosystems, Life Technologies, Paisley, UK). Quantitative PCR was performed using pre-designed gene expression assays and FAST PCR master mix (Taqman, Applied Biosystems, Life Technologies), and measured in a StepOnePlus fast real-time PCR system (Applied Biosystems, Life Technologies) according to the manufacturer’s protocol. Gene expression was quantified using the delta-Ct method.
Chromatin immunoprecipitation-quantitative PCR
SW480 cells were treated with 1000 pg ml−1 IL6 and 25 μ M STAT3 inhibitor for 60 min before collecting the cells. Chromatin immunoprecipitation (ChIP) assay was performed using a magnetic ChIP kit (Thermo Fisher Scientific, Cramlington, UK) as per manufacturer’s protocol with an anti-STAT3 antibody (sc-482X, Santa Cruz Biotechnology, Heidelberg, Germany). Rabbit IgG was used as a negative control for non-specific binding. Binding was calculated as a percentage of the total input chromatin. Sequences of the primers used were as follows:
CYP2E1 site 1 forward: 5′-TGAATTTTCCTTCTGGCCCCAT-3′,
reverse 5′-TGATGAGGAGGTTTGTCTGAGC-3′;
CYP2E1 site 2 forward: 5′-CTCCATCCTCACCAGGTCAC-3′,
reverse: 5′-CCAACCAATGCCCTCTTGCT-3′.
Patients
The study adhered to the tenets of the Declaration of Helsinki. Surgical specimens of primary tumours and adjacent normal colon were obtained with informed consent from 40 patients (28 men and 12 women; aged 49–80 years, mean age 64.7 years±8.1 s.e.m.), with histologically verified colorectal cancer, treated at the Department of Surgery, York District Hospital, York, UK. Ethical approval for the study was obtained from the Human Research Ethics Committee at York District Hospital. Nineteen patients had colon cancer and twenty-one rectal cancers. Tumours were classified according to Duke’s classification (Table 1). The entire study was carried out blind using coded tissue sections. Eligibility criteria for patients recruited to the study included Caucasian origin, 45–80 years of age and no history of previous gastrointestinal disease or any form of cancer, including familial adenomatous polyposis.
Tissue specimens
Tissue samples taken at operation for histopathological confirmation of disease were fixed in 4% buffered formaldehyde and embedded in paraffin wax; sections surplus to pathology requirements were made available for the study. For all 40 patients, tissue sections of both malignant and normal (taken outside the tumour margin) colon or rectum were provided.
Antibodies and reagents
Specific anti-peptide antibodies raised against individual CYP450 enzymes and the corresponding pre-immune sera have been previously described (Edwards et al, 1998; Kapucuoglu et al, 2003). These antibodies have previously been used to detect human CYP450 protein expression (Piipari et al, 2000, Rodriguez-Antona et al, 2002). Biotin labelled secondary antibodies and streptavidin/HRP complex were obtained from DAKO Ltd (Ely, UK). All other chemicals were supplied by either Sigma-Aldrich or Merck (Nottingham, UK) unless otherwise specified.
Immunohistochemistry
The levels of expression and localisation of CYPs 1A1, 1B1 and 2E1 in malignant and adjacent normal colorectal tissue were determined using a modified avidin/biotin immunohistochemistry procedure (Goggi et al, 1986). In preliminary experiments, each of the immunohistochemistry assays was optimised using a range of antisera dilutions (1/200 to 1/8000). For each assay, the negative control antisera (pre-immune sera) were confirmed negative for staining at the dilution optimised for the primary antibody and blocking peptides confirmed specificity. The dilutions used were 1/5000 for the anti-CYP1A1 antibody, and 1/1000 for the anti-CYP1B1 and anti-CYP2E1 antibodies. The sections were deparaffinised and rehydrated through xylene and a series of graded alcohol solutions. Endogenous peroxidase activity was blocked by immersing the sections into a solution of 3% hydrogen peroxide in distilled water for 30 min at room temperature, and then rinsed in cold running tap water for 10 min. Incubating the sections with 5% normal swine serum for 30 min at room temperature reduced non-specific background staining. Sections were then washed twice with PBS and either the primary antibody or the normal goat or rabbit IgGs (negative control) was applied to each section and left at 4 °C overnight. The next day, the slides were washed twice with PBS, and then incubated with the secondary antibody solution (Biotinylated swine anti-goat, mouse, rabbit immunoglobulin; 1/150 dilution), for 1 h at room temperature. After being washed twice with PBS, they were incubated with the StrepABComplex solution for 1 h at room temperature, washed twice with PBS and immersed into the substrate (300 ml PBS, 90 μl hydrogen peroxide and 2.5 ml 3,3-diaminobenzidine) for 3 min, and then rinsed with PBS and cold running tap water. Sections were then successively immersed into haematoxylin, acid alcohol and Scott’s tap water to counterstain. Finally, the sections were dehydrated by successive immersion into 70% ethanol, 100% ethanol twice and xylene twice and mounted.
Immunohistochemical evaluation
Processed specimens were scored under the light microscope and the intensity and localisation of staining with CYPs 1A1, 1B1 and 2E1 antibodies graded blind using coded slides. To assess and grade intensity and distribution of immunoreactivity in the epithelial cells, a previously described method of scoring the sections was used (Maihofner et al, 2003, Charalambous et al, 2003, 2009). The distribution was scored according to the number of positive cells; none (not stained), 0; focal (<1/3 of cells stained), 1; multi-focal (1/3 to 2/3 of cells stained), 2; and diffuse (>2/3 stained), 3; staining intensity was scored as: none (not stained), 0; lightly stained, 1; and strong staining, 2. The distribution and intensity scores were added to produce the grade of staining. Sections treated with the normal goat or rabbit IgGs (negative controls) or omitting the primary antibody were devoid of staining. Positive staining controls included sections of kidney, duodenum and liver.
Statistical analysis
The Wilcoxon’s signed-rank test was used to compare the scoring of the respective immunoreactivity for CYP 1A1, 1B1 and 2E1 between tumour and adjacent normal tissues (Stata Statistical Software 9, StataCorp LP, College Station, TX, USA). Gene expression data were obtained from measurements made in at least three biological replicates and presented as a mean±standard error. Significant differences (P<0.05) were determined using Student’s t-test and one-way analysis of variance (ANOVA) followed by a Dunnett post-test or a linear trend analysis (GraphPad Prism 5, GraphPad Software Inc., La Jolla, CA, USA). Pearson’s product-moment correlation coefficient test was used for correlation analysis (GraphPad Prism 5).
Results
Can IL6 regulate CYP450 expression in CRC cells?
To determine whether IL6 can regulate CYP450s in colon cancer cells, we performed mechanistic studies in in vitro models (human CRC cell lines HCT116 and SW480) to examine the effect of IL6 treatment on CYP 1A1, 1B1 and 2E1 gene expression at various time points using quantitative PCR.
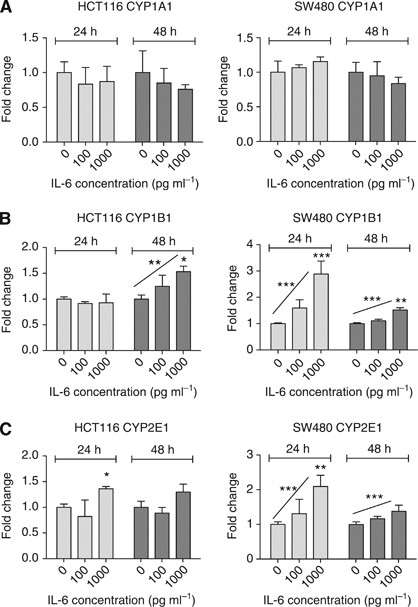
CYP1A1 gene expression was detected but not significantly changed in either cell line following 24- and 48-h IL6 treatment (Figure 2A). However, CYP1B1 and CYP2E1 mRNA expression was regulated dose dependently by IL6 as determined by positive trend analyses and was significantly increased at the highest dose of 1000 pg ml−1 IL6 in both cell lines (Figure 2B and C). To the best of our knowledge, this is the first account of CYP1B1 and CYP2E1 being upregulated by IL6 in colon tumour-derived epithelial cells.
IL6 effect on CYP450 gene expression. HCT116 and SW480 cells were treated with 0, 100 and 1000 pg ml−1 IL6 for 24 and 48 h. CYP1A1 (A), CYP1B1 (B) and CYP2E1 (C) expression was measured by RT-qPCR. Data were normalised to expression of GAPDH housekeeping gene and are shown relative to control. Significance was calculated using one-way ANOVA with a Dunnett post-test comparing treated groups with vehicle control and linear trend analysis (*P<0.05, **P<0.01, ***P<0.001). Data are presented as a mean of at least three biological replicates. Error bars represent the s.e.m.
What are the mechanisms involved in IL6-mediated upregulation of CYP2E1 and CYP1B1?
IL6 regulates CYP2E1 expression through STAT3 transcription factor
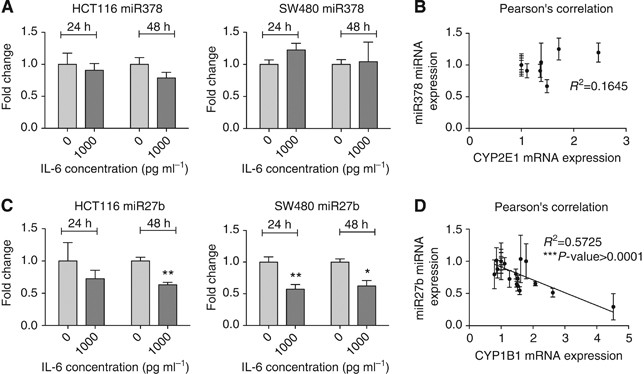
To understand the mechanism underlying IL6 induction of CYP2E1 expression, we examined the different pathways involved in CYP2E1 regulation. CYP2E1 is regulated at various stages of its synthesis and includes transcriptional and post-transcriptional mechanisms. We looked at miRNA-mediated regulation of CYP2E1 mRNA by determining miR378 expression, a miRNA reported to target CYP2E1 (Mohri et al, 2010). However, no change in miR378 expression by IL6 was observed (Figure 3A) and we found no correlation between CYP2E1 and miR378 expression in our model (Figure 3B).
MiRNA involvement in IL6-mediated regulation of CYP1B1 and CYP2E1 gene expression. (A–D) HCT116 and SW480 cells were treated with 0 and 1000 pg ml−1 IL6 for 24 and 48 h. MiR378 (A) and miR27b (C) expression was measured by RT-qPCR. Fold-change expression of miR378 was correlated with fold-change expression of CYP2E1 (B) and fold-change expression of miR27b with fold-change CYP1B1 expression (D). Data were normalised to expression of U6 RNA and are shown relative to control. Significance was calculated using Student’s t-test; Pearson’s product-moment correlation coefficient test was used for correlation analysis (*P<0.05, **P<0.01). Data are presented as a mean of at least three biological replicates. Error bars represent the s.e.m.
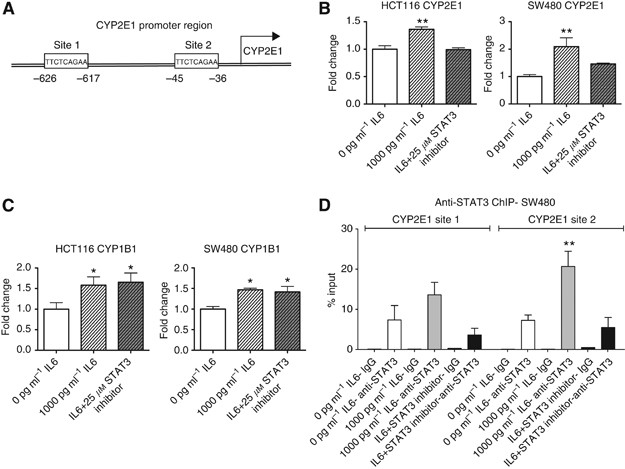
IL6 is a potent inducer of the JAK/STAT3 pathway. An analysis of the CYP2E1 promoter region revealed multiple potential STAT binding sites (Figure 4A; TFSEARCH ver1.3; Heinemeyer et al, 1998). We thus studied involvement of STAT3 in regulating IL6-mediated CYP2E1 induction using a STAT3 inhibitor, STAT3 inhibitor VIII 5,15-diphenylporphyrin. Treatment with the inhibitor prevented IL6-mediated CYP2E1 induction after 24 h in both HCT116 and SW480 cell lines (Figure 4B). Furthermore, a ChIP analysis in SW480 cells revealed that STAT3 does bind to the CYP2E1 promoter region following IL-6 treatment (Figure 4D), compatible with a STAT3-mediated mechanism for induction of CYP2E1 expression by IL6.
STAT3 involvement in IL6-mediated regulation of CYP1B1 and CYP2E1 gene expression. (A) Potential STAT3 binding sites in the CYP2E1 promoter region (1000 bp upstream of the CYP2E1 start site) predicted using TFSEARCH ver1.3 (Heinemeyer et al, 1998) (B, C) HCT116 and SW480 were treated with 1000 pg ml−1 IL6 or a combination of IL6 and 25 μM STAT3 inhibitor VII 5,15-diphenylporphyrin for 24 h (B) and 48 h (C). CYP2E1 (B) and CYP1B1 (C) expression was measured by RT-qPCR. Data were normalised to expression of GAPDH housekeeping gene and are shown relative to control. (D) SW480 cells were treated with 1000 pg ml−1 IL6 or a combination of IL6 and 25 μM STAT3 inhibitor VII 5,15-diphenylporphyrin for 60 min before being fixed and STAT3 binding to predicted sites in the CYP2E1 promoter region was measured by ChIP-qPCR using an anti-STAT3 antibody. Data are presented as a mean of at least three biological replicates for gene expression and STAT3 ChIP experiments and error bars represent the s.e.m. Significance was calculated using two-way ANOVA with a Bonferroni post-test comparing treated groups with vehicle control (**P<0.01). ChIP experiments were repeated using IgG antibody to control for non-specific binding and performed in duplicate.
IL6 regulates CYP1B1 expression through repression of miR27b
We next examined the mechanisms underlying IL6-mediated induction of CYP1B1 expression. The aryl hydrocarbon receptor (AhR) pathway is a well-known transcriptional regulator of CYP1B1 and CYP1A1 expression. However, CYP1A1 mRNA expression was not induced upon IL6 treatment (Figure 2A), thus the AhR pathway is unlikely to be involved in IL6-mediated induction of CYP1B1. Furthermore, we determined that STAT3 was not involved in regulating IL6-mediated CYP1B1 induction, as treatment with the STAT3 inhibitor did not affect IL6-mediated induction of CYP1B1 (Figure 4C).
MiR27b has been reported to directly target CYP1B1 mRNA by binding to its 3’UTR to regulate its expression (Tsuchiya et al, 2006). IL6 significantly downregulated miR27b expression in both cell lines in the current study (Figure 3C). Furthermore, there was a significant inverse correlation between miR27b expression and CYP1B1 expression (Figure 3D), suggesting that downregulation of miR27b could be responsible for the increase in CYP1B1 mRNA observed. To our knowledge, this is the first account of IL6 modulating miR27b expression, thus providing a potential post-transcriptional mechanism by which CYP1B1 is regulated by IL6.
How does IL6 cause miR27b downregulation?
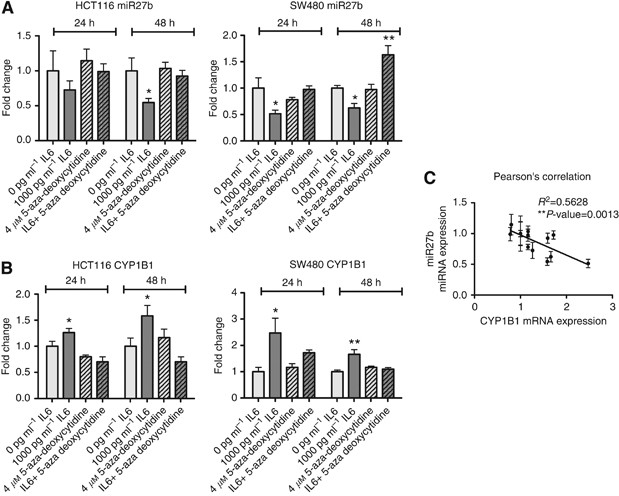
We next determined the mechanism underlying miR27b regulation by IL6. MiR27b is an intragenic miRNA located within the C9orf3 gene on chromosome 9. Previous reports have shown that an intragenic CpG island (chr9: 96 887 100–96 887 300) located close to miR27b can be methylated in colon cancer cells and regulates miR27b expression (Yan et al, 2011). Interleukin-6 is known to induce genome-wide DNA methylation through phosphorylation of DNMT1 by activated AKT, which increases DNMT1 nuclear translocation and activity (Hodge et al, 2007); therefore, we examined the role of DNA methylation in IL6 regulation of miR27b expression by inhibiting DNA methylation using 5-aza-2′-deoxycytidine treatment. We observed that by inhibiting DNA methylation, we were able to prevent miR27b downregulation by IL6 in both cell lines (Figure 5A), implying that DNA methylation has a role in regulating miR27b expression. Again, these changes inversely correlated with CYP1B1 expression (Figure 5B and C). These mechanistic data suggest that IL6-mediated upregulation of CYP1B1 involves downregulation of miR27b via DNA methylation.
IL6-induced downregulation of miR27b is mediated by DNA methylation. HCT116 and SW480 cells were treated with 1000 pg ml−1 IL6, 4 μM 5-aza-2′-deoxycytidine or a combination of IL6 and 5-aza-2′-deoxycytidine for 24 and 48 h. (A) MiR27b expression was measured by RT-qPCR. Data were normalised to expression of U6 RNA and are shown relative to control. (B) CYP1B1 expression was measured by RT-qPCR. Data were normalised to expression of GAPDH housekeeping gene and are shown relative to control. (C) Fold-change expression of miR27b was correlated with fold-change expression of CYP1B1. Significance was calculated using Student’s t-test and one-way ANOVA with a Dunnett post-test comparing treated groups with vehicle control; Pearson’s product-moment correlation coefficient test was used for correlation analysis (*P<0.05, **P<0.01). Data are presented as a mean of at least three biological replicates. Error bars represent the s.e.m.
Is CYP450 expression altered in malignant colorectal tissues that overexpress IL6?
Having shown that IL-6 regulates expression of CYP1B1 and 2E1, but did not alter expression of CYP1A1 in CRC cells, to confirm whether this may be relevant in vivo, we measured the expression of these CYP450s by immunohistochemistry (Figure 6) in tissue sections of malignant and normal bowel from colorectal cancer patients, in which IL6 expression has previously been determined (Figure 1; Maihofner et al, 2003).
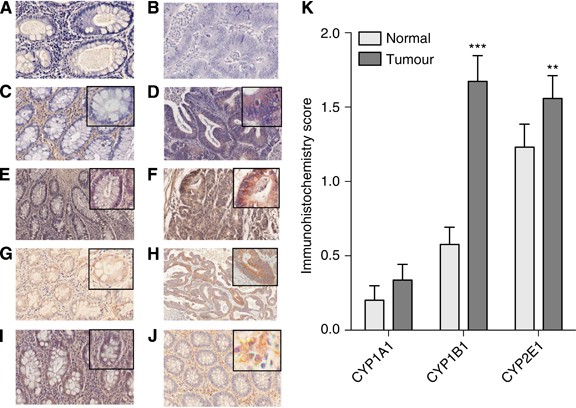
Immunohistochemical localisation of CYP450s in normal and adjacent malignant colonic epithelia. The presence of the immunoreactive protein is indicated by brown staining. Normal (A) and tumour (B) tissues treated with pre-immune serum as primary antibody (negative control); normal (C) and tumour (D) tissues treated with anti-CYP1A1 primary antibody; normal (E) and tumour (F) tissues treated with anti-CYP1B1 primary antibody; normal (G) and tumour (H) tissues treated with anti-CYP2E1 primary antibody. (I) Expression of CYP1B1 in non-malignant colonic epithelial cells lying adjacent to tumour cells. (J) CYP2E1 expression in plasma cells. All sections are shown at × 200 or × 400 (inset) magnification. (K) Expression of CYP450s in matched normal and adjacent malignant colonic epithelia from 40 patients. Significant differences from normal tissue were calculated using Wilcoxon’s signed-rank test (**P<0.01, ***P<0.001).
In most cases, we observed immunostaining only in epithelial cells. Expression of CYP was generally greatest in luminal enterocytes with involvement of the upper third of the crypts in some individuals. We did not observe any expression in the base of crypts. Within the cells, we noted the expression was cytoplasmic with the intensity of expression greatest in perinuclear regions, suggesting localisation within the endoplasmic reticulum. No expression was observed in the mucous inclusions of goblet cells. In tumour tissue, staining was confined to epithelial cells and there was no significant intratumour heterogeneity in enzyme expression.
The CYP1A1 expression was observed in epithelial cells of normal colorectal tissue in 7 out of 40 patients, while 11 out of 40 patients expressed CYP1A1 in malignant epithelial cells (Figure 6C and D). Using our previously described immunohistochemistry scoring procedures (Maihofner et al, 2003; Charalambous et al, 2003, 2009), we found that this did not translate into a significant difference (Figure 6K). Expression of CYP1B1 in normal colorectal tissue was detected in 18 out of 40 patients (Figure 6E), while the majority of patients expressed CYP1B1 in malignant tissue (35 out of 40 patients; Figure 6F). CYP1B1 was also expressed relatively intensely in histologically normal crypts that were immediately adjacent to tumour cells (Figure 6I). CYP2E1 was expressed in both normal and tumour tissues, although expression was more intense in malignant tissue (Figure 6G and H). In addition to epithelial cells, plasma cells (found in the lamina propria) also expressed CYP2E1 intensely (Figure 6J, inset).
We compared these CYP450 expression levels with patient demographics and found no significant correlation between alcohol, age, sex or tumour stage (data not shown).
More importantly, in line with our in vitro data, CYP1B1 and CYP2E1 expression was significantly increased in tumour samples compared with adjacent normal tissue while the CYP1A1 expression levels were not significantly changed (Figure 6K). We have previously reported increased expression of inflammatory cytokine IL6 in these same tumour tissue samples (Figure 1; Maihofner et al, 2003). Furthermore, CYP1B1 and CYP2E1 gene expression was also the only CYP450s to be induced by IL6 in our in vitro mechanistic models and as CYP450 mRNA levels in human cell culture have been reported to correlate well with protein expression (Rodriguez-Antona et al, 2002), we therefore propose that IL6 may be involved in the increased expression of these proteins in tumour tissue.
Discussion
The effect of IL6 on CYP450 expression in colorectal cancer has not been widely investigated. Furthermore, only a few studies have attempted to characterise the expression of individual CYP isozymes using immunohistochemistry (Kumarakulasingham et al, 2005; Androutsopoulos et al, 2013). Certain members of the CYP450 family, including CYP1A1 and 1B1, can activate dietary pro-carcinogens such as heterocyclic amines and polycyclic aromatic hydrocarbons, which have been associated with colorectal cancer (Ito et al, 1991; Crofts et al, 1997; Barrett et al, 2003; Boyce et al, 2004; Sinha et al, 2005; Nothlings et al, 2009), and the expression of CYP450 enzymes in tissues that are targets for xenobiotic genotoxicity implies a potential for in situ activation. CYP450s, in particular CYP2E1, can also metabolise several drugs resulting in either inhibition or activation, and thus have an important role in drug bioavailability (Koop, 1992). CYP450 enzymes have significant roles in xenobiotic activation, tumour initiation and promotion (Murray et al, 1997; Gooderham et al, 2007; Braeuning et al, 2011; Kasai et al, 2013; Rodriguez and Potter, 2013), hence, characterisation of CYP450 enzyme profiles in colon tissue and understanding the mechanisms involved in their regulation can be important for diagnosis, prognosis and treatment of disease.
Interleukin-6 has been reported to regulate CYP enzyme expression (Abdel-Razzak et al, 1993; Tindberg et al, 1996; Jover et al, 2002; Hokkola et al, 2003; Kurzawski et al, 2012) and is also thought to be involved in colon cancer initiation and progression (Feagins et al, 2009). We have previously shown IL6 expression is present at higher levels in the neoplastic colon (Maihofner et al, 2003) and the current study extends these observations and provides evidence for the localisation of several CYP450 enzymes in colon tissue from the same patient cohort and we demonstrate that CYP1B1 and CYP2E1 expression is significantly upregulated in these tumour tissue samples. Moreover, we have conducted mechanistic studies that give an insight into some of the regulatory mechanisms involving IL6 that underlie CYP1B1 and 2E1 enzyme expression in the colon.
Regarding CYP2E1, we found that IL6 induced CYP2E1 expression in human colon tumour-derived cell lines and in support, we showed CYP2E1 levels were increased in tumour tissue expressing higher levels of IL6 than matched normal tissue. It is commonly thought that IL6 as well as other pro-inflammatory cytokines repress CYP450 expression (Abdel-Razzak et al, 1993; Jover et al, 2002) and CYP2E1 gene expression was previously shown to be downregulated by IL6 in hepatic tissue (Hakkola et al, 2003), which is in contrast to our data. However, a study published by Tindberg et al (1996) reported that inflammation induced CYP2E1 gene expression in astrocytes. Taken together, these data suggest that the effect of inflammation on CYP2E1 expression is dependent on tissue type. We identified that IL6-mediated induction of CYP2E1 in vitro was through a mechanism involving direct binding of STAT3 to the CYP2E1 promoter. This is the first account of a direct involvement of IL6 and STAT3 in CYP2E1 expression in colonic cells. It has previously been shown that both STAT3 activation and CYP2E1 overexpression are linked to alcohol consumption (Roberts et al, 1995; Norkina et al, 2007). Epidemiological and animal studies have identified an association between excessive alcohol intake and increased risk of colorectal cancer (Pollack et al, 1984; Seitz et al, 1984; Kune et al, 1987; Kato et al, 1990). More recently, a study published by Morita et al (2009) demonstrated a correlation between CYP2E1 activity, alcohol intake, meat consumption and the development of colorectal cancer. Our findings provide a potential inflammatory STAT3-mediated mechanism by which CYP2E1 expression could be regulated by alcohol in the colon.
CYP1B1 has been suggested to be a tumour specific enzyme as it is rarely found in healthy tissue (Murray et al, 1997). As expected, there was a significant increase in CYP1B1 expression in tumour tissue when compared with matched normal tissue in the current study. These results are in agreement with previous studies, which have shown increased CYP1B1 expression in colon cancer (Murray et al, 1997; Gibson et al, 2003; Kumarakulasingham et al, 2005; Chang et al, 2005; Androutsopoulos et al, 2013). Moreover, in mechanistic studies we found that IL6 induced CYP1B1 gene expression in colon tumour-derived epithelial cells. The relationship between inflammation and CYP1B1 is not as well studied as other CYP450 enzymes, despite both of these factors being of significant interest in tumour development. However, inflammation was previously shown to increase CYP1B1 expression in brain cells (Malaplate-Armand et al, 2003). In a recent study, IL6 was shown to induce CYP1B1 but not CYP1A1 gene expression in human hepatocellular carcinoma cell line HepG2 in an AhR-independent manner (Kurzawski et al, 2012). This is in line with our results, where IL6 induced CYP1B1 but not CYP1A1 in CRC cells and only CYP1B1 levels were significantly elevated in tumour tissue where IL6 expression was also increased. While Kurzawski et al (2012) did not establish a specific mechanism for the induction of CYP1B1 by IL6, here we show that CYP1B1 is post-transcriptionally regulated by IL6 through miR27b, an miRNA reported to directly target CYP1B1 mRNA (Tsuchiya et al, 2006). Furthermore, our data suggest that DNA methylation has a role in IL6-mediated downregulation of miR27b. Yan et al (2011) reported a CpG island located near miR27b that is methylated in CRC cells and can regulate miR27b expression, thus supporting our findings. MiR27b has been shown to have various roles in the inflammatory process. In neuroblastoma cells, inhibition of miR27b activated NFκB signalling leading to increased expression of IL6 (Lee et al, 2011), whereas the opposite has been found in breast cancer cells (Jin et al, 2013). Despite these conflicting reports, miR27b and IL6 appear to be involved in the same pathways and this is the first account of IL6 directly regulating miR27b expression.
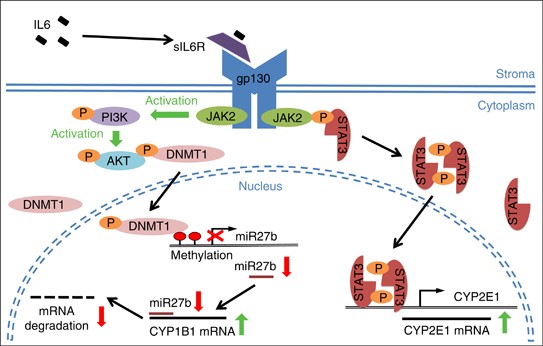
In summary, this study has shown that CYP450 enzymes expressed in colon tissue are significantly influenced by disease as evidenced by the increased expression of CYP2E1 and CYP1B1 in tumour tissue samples. However, it is important to note that a sample size of 40 patients was used in this study, and while our data are in agreement with previous reports of increased CYP1B1 expression, studies with larger patient numbers are needed to validate these findings, in particular for CYP2E1 expression. Furthermore, we noted the changes in CYP450 expression observed in malignant tissue did not correlate with sex or age. Interestingly, CYP450 expression was also not associated with tumour grade, suggesting that these changes occur at an early disease stage. We have previously shown these same colorectal tumours (from the same patient cohort) have increased levels of IL6 compared with adjacent normal tissues (Maihofner et al, 2003) and here we demonstrate for the first time that addition of IL6 can regulate CYP1B1 and CYP2E1 in colon tumour-derived cell lines. We describe a transcriptional mechanism for IL6-mediated CYP2E1 induction via STAT3 (Figure 7). We also demonstrate an epigenetic mechanism by which IL6 represses miR27b expression involving DNA methylation resulting in CYP1B1 upregulation (Figure 7). Taken together, our study provides further insight into the mechanisms by which IL6 promotes tumour development and progression. While altering CYP450 expression is only one of the mechanisms by which IL6 exerts its pro-tumourigenic effects, this pathway is of particular importance when it comes to designing therapies. New CRC treatment strategies could exploit this novel pathway potentially through the use of drugs that can only be activated by CYP2E1 or CYP1B1, and avoiding treatments that may be deactivated by these CYP450s. These findings also suggest that preventive dietary measures are of particular importance for patients with inflammatory bowel conditions to reduce their risk of CRC. By manipulating CYP450 enzymes, IL6 can induce phenotypic changes in colon tumour cells possibly rendering them drug resistant, or encouraging the in situ metabolism of carcinogens, thus resulting in DNA damage and potentially tumour promotion.
Potential mechanism of IL6-mediated induction of CYP1B1 and CYP2E1 mRNA expression in colorectal cancer cells. IL6 secreted by stromal cells binds to the soluble IL6 receptor (sIL6R) in the stroma, which interacts with transmembrane protein gp130 at the cellular surface resulting in activation of JAK/STAT3 and PI3K/AKT pathways. Activated STAT3 forms a homodimer, translocates to the nucleus and binds to the CYP2E1 promoter region, thus inducing its transcription. Activated AKT phosphorylates DNMT1 leading to its nuclear translocation. Once in the nucleus, DNMT1 induces DNA methylation at a CpG island located near miR27b, thus preventing its expression. Lower expression of miR27b results in less binding to the CYP1B1 mRNA leading to less degradation and increased CYP1B1 mRNA expression.
Change history
09 December 2014
This paper was modified 12 months after initial publication to switch to Creative Commons licence terms, as noted at publication
References
Abdel-Razzak Z, Loyer P, Fautrel A, Gautier JC, Corcos L, Turlin B, Beaune P, Guillouzo A (1993) Cytokines down-regulate expression of major cytochrome P-450 enzymes in adult human hepatocytes in primary culture. Mol Pharmacol 44: 707–715.
Androutsopoulos VP, Spyrou I, Ploumidis A, Papalampros AE, Kyriakakis M, Delakas D, Spandidos DA, Tsatsakis AM (2013) Expression profile of CYP1A1 and CYP1B1 enzymes in colon and bladder tumours. PLoS One 8 (12): e82487.
Barrett JH, Smith G, Waxman R, Gooderham N, Lightfoot T, Garner RC, Augustsson K, Wolf CR, Bishop DT, Forman D Colorectal Cancer Study Group (2003) Investigation of interaction between N-acetyltransferase 2 and heterocyclic amines as potential risk factors for colorectal cancer. Carcinogenesis 24: 275–282.
Boyce A, Doehmer J, Gooderham NJ (2004) Phytoalexin resveratrol attenuates the mutagenicity of the heterocyclic amines 2-amino-1-methyl-6-phenylimidazo[4,5-b]pyridine and 2-amino-3,8-dimethylimidazo[4,5-f]quinoxaline. J Chromatogr B Analyt Technol Biomed Life Sci 802 (1): 217–223.
Braeuning A, Kohle C, Buchmann A, Schwarz M (2011) Coordinate regulation of cytochrome P450 1a1 expression in mouse liver by the aryl hydrocarbon receptor and the beta-catenin pathway. Toxicol Sci 122: 16–25.
Chang H, Su JM, Huang CC, Liu LC, Tsai CH, Chou MC, Lin P (2005) Using a combination of cytochrome P450 1B1 and beta-catenin for early diagnosis and prevention of colorectal cancer. Cancer Detect Prev 29 (6): 562–569.
Charalambous MP, Lightfoot T, Speirs V, Horgan K, Gooderham NJ (2009) Expression of COX-2, NF-kappaB-p65, NF-kappa-p50 and IKKalpha in malignant and adjacent normal human colorectal tissue. Br J Cancer 101 (1): 106–115.
Charalambous MP, Maihofner C, Bhambra U, Lightfoot T, Gooderham NJ and the colorectal cancer study group (2003) Upregulation of cyclooxygenase-2 is accompanied by increased expression of nuclear factor-kappa B and I kappa B kinase-alpha in human colorectal cancer epithelial cells. Br J Cancer 88 (10): 1598–1604.
Crofts FG, Strickland PT, Hayes CL, Sutter TR (1997) Metabolism of 2-amino-1-methyl-6-phenylimidazo[4,5-b]pyridine (PhIP) by human cytochrome P450 1B1. Carcinogenesis 18: 1793–1798.
Edwards RJ, Adams DA, Watts PS, Davies DS, Boobis AR (1998) Development of a comprehensive panel of antibodies against the major xenobiotic metabolising forms of cytochrome P450 in humans. Biochem Pharmacol 56: 377–387.
Feagins LA, Souza RF, Spechler SJ (2009) Carcinogenesis in IBD: potential targets for the prevention of colorectal cancer. Nat Rev Gastroenterol Hepatol 6: 297–305.
Gibson P, Gill JH, Khan PA, Seargent JM, Martin SW, Batman PA, Griffith J, Bradley C, Double JA, Bibby MC, Loadman PM (2003) Cytochrome P450 1B1 (CYP1B1) is overexpressed in human colon adenocarcinomas relative to normal colon: implications for drug development. Mol Cancer Ther 2 (6): 527–534.
Goggi G, Dell'Orto P, Viale G (1986) Immunohistochemistry. Modern Methods and Applications pp 54–70. Butterworth-Heinemann: London.
Gooderham NJ, Creton S, Lauber SN, Zhu H (2007) Mechanisms of action of the carcinogenic heterocyclic amine PhIP. Toxicol Lett 168 (3): 269–277.
Hakkola J, Hu Y, Ingelman-Sundberg M (2003) Mechanisms of down-regulation of CYP2E1 expression by inflammatory cytokines in rat hepatoma cells. J Pharm Exp Ther 304 (3): 1048–1054.
Heinemeyer T, Wingender E, Reuter I, Hermjakob H, Kel AE, Kel OV, Ignatieva EV, Ananko EA, Podkolodnaya OA, Kolpakov FA, Podkolodny NL, Kolchanov NA (1998) Databases on Transcriptional Regulation: TRANSFAC, TRRD, and COMPEL. Nucleic Acids Res 26: 364–370.
Hodge DR, Cho E, Copeland TR, Guszczynski T, Yang E, Seth AK, Farrar WL (2007) IL-6 enhances the nuclear translocation of DNA cytosine-5-methyltransferase (DNMT1) via phosphorylation of the nuclear localization sequence by AKT kinase. Cancer Genomics Proteomics 4: 387–398.
Ito N, Hasegawa R, Sano M, Tamano S, Esumi H, Takayama S, Sugimura T (1991) A new colon and mammary carcinogen in cooked food, 2-amino-1-methyl-6-phenylimidazo[4,5-b]pyridine (PhIP). Carcinogenesis 12: 1503–1506.
Jin L, Wessely O, Marcusson EG, Ivan C, Calin GA, Alahari SK (2013) Prooncogenic factors miR-23b and miR-27b are regulated by Her2/Neu, EGF, and TNFα in breast cancer. Cancer Res 73 (9): 2884–2896.
Jover R, Bort R, Gomez-Lechon MJ, Castell JV (2002) Down-regulation of human CYP3A4 by the inflammatory signal interleukin-6: molecular mechanism and transcription factors involved. FASEB J 16 (13): 1799–1801.
Kapucuoglu N, Coban T, Raunio H, Pelkonen O, Edwards RJ, Boobis AR, Iscan M (2003) Expression of CYP3A4 in human breast tumour and non-tumour tissues. Cancer Lett 202: 17–23.
Kasai S, Ishigaki T, Takumi R, Kamimura T, Kikuchi H (2013) Beta-catenin signaling induces CYP1A1 expression by disrupting adherent junctions in Caco-2 human colon carcinoma cells. Biochim Biophys Acta 1830: 2509–2516.
Kato S, Kawase T, Alderman J, Inatomi N, Lieber CS (1990) Role of xanthine oxidase in ethanol-induced lipid peroxidation in rats. Gastroenterology 98: 203–210.
Koop DR (1992) Oxidative and reductive metabolism of cytochrome P450 2E1. FASEB J 6 (2): 724–730.
Kumarakulasingham M, Rooney PH, Dundas SR, Telfer C, Melvin WT, Curran S, Murray GI (2005) Cytochrome p450 profile of colorectal cancer: identification of markers of prognosis. Clin Cancer Res 11 (10): 3758–3765.
Kune S, Kune GA, Watson LF (1987) Case-control study of alcoholic beverages as etiological factors: the Melbourne Colorectal Cancer Study. Nutr Cancer 9: 43–56.
Kurzawski M, Dziedziejko V, Post M, Wojcicki M, Urasinska E, Mietkiewski J, Drozdzik M (2012) Expression of genes involved in xenobiotic metabolism and transport in end-stage liver disease: up-regulation of ABCC4 and CYP1B1. Pharmacol Rep 64 (4): 927–939.
Lee J-J, Drakaki A, Iliopoulos D, Struhl K (2011) MiR-27b targets PPARγ to inhibit growth, tumour progression, and the inflammatory response in neuroblastoma cells. Oncogene 31 (33): 3818–3825.
Maihofner C, Charalambous MP, Gooderham NJ and the colorectal cancer group (2003) Expression of cyclooxygenase-2 parallels expression of interleukin-1β, interleukin-6 and NF-kappaB in human colorectal cancer. Carcinogenesis 24 (4): 665–671.
Malaplate-Armand C, Ferrari L, Masson C, Siest G, Batt AM (2003) Astroglial CYP1B1 up-regulation in inflammatory/oxidative toxic conditions: IL-1β effect and protection by N-acetylcysteine. Toxicol Lett 138 (3): 243–251.
Mohri T, Nakajima M, Fukami T, Takamiya M, Aoki Y, Yokoi T (2010) Human CYP2E1 is regulated by miR-378. Biochem Pharmacol 79 (7): 1045–1052.
Morita M, Le Marchand L, Kono S, Yin G, Toyomura K, Nagano J, Mizoue T, Mibu R, Tanaka M, Kakeji Y, Maehara Y, Okamura T, Ikejiri K, Futami K, Maekawa T, Yasunami Y, Takenaka K, Ichimiya H, Imaizumi N (2009) Genetic polymorphisms of CYP2E1 and risk of colorectal cancer: the Fukuoka Colorectal Cancer Study. Cancer Epidemiol Biomarkers Prev 18: 235–241.
Murray GI, Taylor MC, McFadyen MCE, McKJay JA, Greenlee WF, Burke MD, Melvin WT (1997) Tumour-specific expression of cytochrome P450 CYP1B1. Cancer Res 57: 3026–3031.
Nagasaki T, Hara M, Nakanishi H, Takahashi H, Sato M, Takeyama H (2014) Interleukin-6 released by colon cancer-associated fibroblasts is critical for tumour angiogenesis: anti-interleukin-6 receptor antibody suppressed angiogenesis and inhibited tumour-stroma interaction. Br J Cancer 110: 469–478.
Norkina O, Dolganiuc A, Shapiro T, Kodys K, Mandrekar P, Szabo G (2007) Acute alcohol activates STAT3, AP-1 and Sp-1 transcription factors via the family of Src kinases to promote IL-10 production in human monocytes. J Leukoc Biol 82 (3): 752–762.
Nothlings U, Yamamoto JF, Wilkens LR, Murphy SP, Park SY, Henderson BE, Kolonel LN, Le Marchand L (2009) Meat and heterocyclic amine intake, smoking, NAT1 and NAT2 polymorphisms, and colorectal cancer risk in the multiethnic cohort study. Cancer Epidemiol Biomarkers Prev 18: 2098–2106.
Pollack ES, Nomura AM, Heilbrun LK, Stemmermann GN, Green SB (1984) Prospective study of alcohol consumption and cancer. N Engl J Med 310: 617–621.
Piipari R, Savela K, Nurminen T, Hukkanen J, Raunio H, Hakkola J, Mantyla T, Beaune P, Edwards RJ, Boobis AR, Anttila S (2000) Expression of CYP1A1, CYP1B1 and CYP3A, and polycyclic aromatic hydrocarbon-DNA adduct formation in bronchoalveolar macrophages of smokers and non-smokers. Int J Cancer 86 (5): 610–616.
Roberts BJ, Song B-J, Soh Y, Park SS, Shoaf SE (1995) Ethanol induces CYP2E1 by protein stabilization. J Biol Chem 270: 29632–29635.
Rodriguez-Antona C, Donato MT, Boobis AR, Edwards RJ, Watts PS, Vicente Castell J, Gomez-Lechon MJ (2002) Cytochrome P450 expression in human hepatocytes and hepatoma cell lines: molecular mechanisms that determine lower expression in cultured cells. Xenobiotica 32 (6): 505–520.
Rodriguez M, Potter DA (2013) CYP1A1 regulates breast cancer proliferation and survival. Mol Cancer Res 11 (7): 780–792.
Seitz HK, Czygan P, Waldherr R, Veith S, Raedsch R, Kassmodel H, Kommerell B (1984) Enhancement of 1,2-dimethylhydrazine-induced rectal carcinogenesis following chronic ethanol consumption in the rat. Gastroenterology 86: 886–891.
Sinha R, Peters U, Cross AJ, Kulldorf M, Weissfeld JL, Pinsky PF, Rothman N, Hayes RB (2005) Meat, meat cooking methods and preservation, and risk for colorectal adenoma. Cancer Res 65: 8034–8041.
Smalley W, Ray WA, Daugherty J, Griffin MR (1999) Use of nonsteroidal anti-inflammatory drugs and incidence of colorectal cancer: a population-based study. Arch Int Med 159: 161–166.
Suzuki H, Maruyama R, Yamamoto E, Kai M (2012) DNA methylation and microRNA dysregulation in cancer. Mol Oncol 6 (6): 567–578.
Tenesa A, Dunlop MG (2009) New insights into the aetiology of colorectal cancer from genome-wide association studies. Nat Rev Genet 10: 353–358.
Tindberg N, Baldwin HA, Cross AJ, Ingelman-Sundberg M (1996) Induction of cytochrome P450 2E1 expression in rat and gerbil astrocytes by inflammatory factors and ischemic injury. Mol Pharmacol 50 (5): 1065–1072.
Tsuchiya Y, Nakajima M, Takagi S, Taniya T, Yokoi T (2006) MicroRNA regulates the expression of human cytochrome P450 1B1. Cancer Res 66 (18): 9090–9098.
Wehbe H, Henson R, Meng F, Mize-Berge J, Patel T (2006) Experimental therapeutics, molecular targets, and chemical biology: interleukin-6 contributes to growth in cholangiocarcinoma cells by aberrant promoter methylation and gene expression. Cancer Res 66: 10517–10524.
Williams CS, Smalley W, DuBois RN (1997) Aspirin use and potential mechanisms for colorectal cancer prevention. J Clin Invest 100: 1325–1329.
Yan H, Choi A, Lee BH, Ting AH (2011) Identification and functional analysis of epigenetically silenced in colorectal cancer cells. PLoS One 6 (6): e20628.
Yang CH, Yue J, Fan M, Pfeffer LM (2010) IFN induces miR-21 through a signal transducer and activator of transcription 3-dependent pathway as a suppressive negative feedback on IFN-induced apoptosis. Cancer Res 70 (20): 8108–8116.
Acknowledgements
The work was supported by funding from the United Kingdom Food Standards Agency and Medical Research Council.
Author information
Authors and Affiliations
Corresponding author
Additional information
This work is published under the standard license to publish agreement. After 12 months the work will become freely available and the license terms will switch to a Creative Commons Attribution-NonCommercial-Share Alike 3.0 Unported License.
Rights and permissions
From twelve months after its original publication, this work is licensed under the Creative Commons Attribution-NonCommercial-Share Alike 3.0 Unported License. To view a copy of this license, visit http://creativecommons.org/licenses/by-nc-sa/3.0/
About this article
Cite this article
Patel, S., Bhambra, U., Charalambous, M. et al. Interleukin-6 mediated upregulation of CYP1B1 and CYP2E1 in colorectal cancer involves DNA methylation, miR27b and STAT3. Br J Cancer 111, 2287–2296 (2014). https://doi.org/10.1038/bjc.2014.540
Revised:
Accepted:
Published:
Issue Date:
DOI: https://doi.org/10.1038/bjc.2014.540
Keywords
This article is cited by
-
Stat4 rs7574865 polymorphism promotes the occurrence and progression of hepatocellular carcinoma via the Stat4/CYP2E1/FGL2 pathway
Cell Death & Disease (2022)
-
Neuronally-enriched exosomal microRNA-27b mediates acute effects of ibuprofen on reward-related brain activity in healthy adults: a randomized, placebo-controlled, double-blind trial
Scientific Reports (2022)
-
Biological roles of cytochrome P450 1A1, 1A2, and 1B1 enzymes
Archives of Pharmacal Research (2021)
-
Interleukin-6 selectively induces drug metabolism to potentiate the genotoxicity of dietary carcinogens in mammary cells
Archives of Toxicology (2019)
-
IL-32 gamma reduces lung tumor development through upregulation of TIMP-3 overexpression and hypomethylation
Cell Death & Disease (2018)


