
Abstract
Audiovisual news is a critical cultural phenomenon that has been influencing audience worldviews for more than a hundred years. To understand historical trends in multimodal audiovisual news, we need to explore them longitudinally using large sets of data. Despite promising developments in film history, computational video analysis, and other relevant fields, current research streams have limitations related to the scope of data used, the systematism of analysis, and the modalities and elements to be studied in audiovisual material and its metadata. Simultaneously, each disciplinary approach contributes significant input to research reducing these limitations. We therefore advocate for combining the strengths of several disciplines. Here we propose a multidisciplinary framework for systematically studying large collections of historical audiovisual news to gain a coherent picture of their temporal dynamics, cultural diversity, and potential societal effects across several quantitative and qualitative dimensions of analysis. By using newsreels as an example of such complex historically formed data, we combine the context crucial to qualitative approaches with the systematicity and ability to cover large amounts of data from quantitative methods. The framework template for historical newsreels is exemplified by a case study of the “News of the Day” newsreel series produced in the Soviet Union during 1944–1992. The proposed framework enables a more nuanced analysis of longitudinal collections of audiovisual news, expanding our understanding of the dynamics of global knowledge cultures.
Introduction
Audiovisual news has affected the global knowledge landscape for over a century. As a media format, audiovisual is impactful, and news as a genre is particularly effective for forming knowledge about the world. Although what counts as news is debatable (Tworek, 2019), labelling a story as ‘news’ suggests that the offered content has contemporary relevance and that it provides truthful information on the surrounding world—even if we know that this is not always the case (Winston, 2018; Lazer et al., 2018). Understanding audiovisual news content is crucial because news, taking part in creating the ‘media reality’ (Morgan, 2008), steers our gaze to the world, affects our opinions, and shapes our identities (Imesch et al., 2016; Hoffmann, 2018; Werenskjold, 2018). Even if some audiences may disagree with the content (Sampaio, 2022), news sets the agenda for societal discussions and contributes to what we consider worth knowing.
To fully understand the functions of audiovisual news content, production, and dissemination, exploring them through large and consistent sets of data, covering a long time span, can be helpful. Examining a consistent set of data that, for example, covers all the issues of a newsreel series, gives an understanding of the variety of individual findings and contextualises them. Detecting long-term continuities, and short-term trends helps us better understand the past information culture, alongside what is perhaps specific to our time or area. However, so far, studying audiovisual news via large quantities of data or across a long time span systematically in ways that would take into account their complexity has been hampered by availability of data and integration of methods across disciplines. Here we work towards a unified approach to study audiovisual news that enables the comparison of data coming from different sources to reveal the cultural and temporal variations of the global news scene.
Newsreels were the first widely spread form of audiovisual news. Starting in France in 1909, these approximately ten-minute-long news films, shown in the weekly changing series in cinemas, informed audiences about the latest political events, innovations, sports competitions, and fashion trends. Each newsreel issue contained around five to twelve short news stories, often showing the ‘more serious’ ones first and ending with entertaining topics. Until the mid-1950s, newsreels were the main source of audiovisual news for audiences globally that also conveyed both political propaganda and commercial interests. Their production continued in some countries under state support until the 1990s (Chambers et al., 2018; Pozharliev and Gallo González, 2018; Fielding, 2009).
Like other audiovisual products, newsreels are multifaceted. They are multimodal combinations of moving images, sounds, music, and of spoken and written language, gestures, iconographies, and signs as deeply rooted in the surrounding societies. The meanings created are interrelated across modalities with an individual news story gaining additional meaning, depending on its embedding and temporal position in a newsreel issue. In fact, one may argue, the meaning of a newsreel issue can be understood only when looking at the contents of the other issues of the newsreel series. Therefore, in order to understand the messages and role of individual news stories in a society, it is necessary to study newsreels as a whole (Hickethier, 2016) and comparatively, systematically analysing larger collections through the interconnections of small-scale units. This, we argue, has to transcend the debate of a single community of practice, such as media studies or communication, which is why this paper brings forth the expertise from a broad range of research streams—including film history, computational video analysis, film studies, and the so-called New Cinema History—to study film and video in a comprehensive way.
Lately, many newsreel series have been digitised, and several national film archives as well as transnational collections, such as Europeana, the Internet Archive, and Wikimedia Commons, all increasingly provide access to newsreels in digital form. This has opened new possibilities for studying long-term patterns of audiovisual news. However, despite promising developments in various disciplines, current approaches to newsreels, as discussed below, do not allow us to fully grasp these complex cultural products. Many established research fields are relevant to the longitudinal study of historical newsreels and audiovisual news in general. However, if the current approaches from each research stream are used separately, they produce considerable gaps in the nuanced understanding of newsreels in a long temporal continuum. The available approaches are either qualitative and do not allow a systematic analysis of large-scale data, or quantitative and reveal only one aspect of the multimodal newsreel data. Table 1 summarises the related research streams and their gaps, ranging from the scope of data used, comparability of analysis, the modalities taken into account, and the elements creating meaning in audiovisual material. Simultaneously, each research stream offers a contribution that helps fill the gaps in other fields. In the following paragraphs, we elaborate further on the gaps in each of these research streams together with the beneficial contributions that they may bring.
Qualitative film history
Qualitative film historical studies on newsreels have been demonstrating the variety of production conditions, core messages, and distribution channels in a number of countries and at different times (Chambers et al., 2018; Garrett Cooper et al., 2018; Imesch et al., 2016). Their strength is that they take into account the interplay of multiple modalities in the film material and produce nuanced analyses of the messages they have conveyed to the audiences. Simultaneously, however, they focus on temporally restricted segments of data, use analysis methods that are hard to apply to a large quantities of data, and do not usually utilise categories that would allow systematic comparisons between different studies (Chambers, 2018, Pozharliev and Gallo González, 2018, Bergström and Jönsson, 2018, Vande Winkel and Biltereyst, 2018; Pozdorovkin, 2012, Veldi et al., 2019). The main limitation of qualitative enquiry is its incomplete ability to offer an understanding of what is prevailing and what is marginal in wider terms in the data, which makes it difficult to see the bigger picture and contextualise the findings. As van Noord (2022) notes, exploring recurring motifs or patterns in cultural data is crucial for a deeper understanding. Although an experienced qualitative scholar is usually able to point out some of the repeating patterns based on their accumulated knowledge of the field, computational methods can back that up, measure the prevalence of the pattern in the collection, and detect also other, possibly unnoticed patterns.
Computational video analysis
Computational video analysis focuses on the systematic study of large collections of data, while typically addressing a single modality rather than aggregates of contextual and temporal factors. Examples include increasingly accurate and effective methods for recognising shot and scene boundaries (Hanjalic, 2002; Rasheed and Shah, 2003), persons (Wang and Zhang, 2022), objects (Brasó et al., 2022), human poses (Broadwell and Tangherlini, 2021), number of individuals in a crowd (Zhang and Chan, 2022), events (Wan et al., 2021), sounds (Park et al., 2021), human and animal behaviour (Gulshad et al., 2023; Bain et al., 2021; Sommer et al., 2020) and to perform image segmentation (Hu et al., 2022). Different solutions for condensing audiovisual content have also been developed, either for creating video representations to enable efficient browsing (Zhao et al., 2021) or numerical fingerprints allowing comparisons of video content for retrieval and recommendation systems (Kordopatis-Zilos et al., 2022; Nazir et al., 2020). Deep Learning applications in computer vision have been used for various item recognition tasks in images and videos (Bhargav et al., 2019; Liu et al., 2020; Kong and Fu, 2022; Brissman et al., 2022; Kandukuri et al., 2022). While mainstream computational video content analysis has focused on images, other modalities, like sound, have been also gaining increased attention (Valverde et al., 2021; Yang et al., 2020; Senocak et al., 2018; Hasegawa and Kato, 2019; Hu et al., 2022; Ye and Kovashka, 2022; Sanguineti et al., 2022; Pérez et al., 2020), eventually feeding into multi-modal analysis (Mourchid et al., 2019; Ren et al., 2018). However, considering different modalities of audiovisual data, particularly within the historical focus of this paper, remains beyond mainstream in video analysis. In addition, there is a lack of discussion on how certain units of analysis, such as recognised objects or condensed forms of video content, can be credibly used to detect the ways audiovisual content creates and conveys meaning to audiences.
Computational film studies
Situated between the qualitative and quantitative study of audiovisual contents, computational film studies often combine the two approaches. This stream of literature started by using shot detection to analyse film dynamics and editing styles (Salt, 1974; Tsivian, 2009; Pustu-Iren et al., 2020). In addition to addressing dynamics as an important modality of audiovisual content, computational film scholars have also been combining different modalities, such as images and sound (Grósz et al., 2022), spoken texts (Carrive et al., 2021; van Noord et al., 2021), or shown locations (Olesen et al., 2016). Computational studies of newsreels more specifically have addressed the contents of news either on the level of textual descriptions of news story topics (Althaus et al., 2018; Althaus and Britzman, 2018) or at a more granular level combining different modalities by analysing the voice-over text and automatically recognising well-known individuals in the film material (Carrive et al., 2021).
An ongoing debate in computational film studies concerns how film creates meaning, what are the most important meaning-making units, and how they could be best extracted (Chávez Heras, 2024; Burghardt et al., 2020; Burges et al., 2021). A profound challenge is that many modalities of film, such as images, can be interpreted in divergent ways depending on the viewer and their context (van Noord, 2022; Arnold and Tilton, 2019; Pozdorovkin, 2012). Different modalities may also create juxtaposing messages (Pozharliev and Gallo González, 2018). David Bordwell (1991) has argued that films contain ‘cues’ on which the further comprehension and interpretation of their meaning is based. Although the spectators may have differing opinions on the profound message of a film, an important hypothesis is that they nevertheless usually agree upon what the meaning-making cues are (such as shown activities or spoken sentences). This means that the variety of “credible” interpretations of the message of the film is limited (Bordwell, 1991). A central premise of computational film studies is thus that it can be possible to detect these cues and reach for an aggregate meaning of films through them.
Lately, in pursuit of understanding the meanings carried by film, a number of scholars have been using recognition and annotation of pre-set categories or stylistic features, discussing whether human interpretation should be applied already at the event of recognising the items, or at a later stage of the analysis (Carrive et al., 2021; Bhargav et al., 2019; Heftberger, 2018; Burges et al., 2021; Williams and Bell, 2021; Hielscher, 2020; Cooper et al., 2021; Bakels et al., 2020; authors discussing this issue: Burghardt et al., 2020; Arnold et al., 2021; Masson et al., 2020). There are also scholars further problematising object recognition by stating that in addition to recognising an object we should know how it is portrayed in order to understand its meaning (Hielscher, 2020) and calling for more thorough thinking of which measures can be used to analyse film contents (Olesen and Kisjes, 2018). This discussion connects with the wider question if there are cues in film that create meaning, how to find them, how to decide what to measure, and how to make sure that what is being measured gives responses to salient research questions. Although computational studies of historical newsreels use elaborate methods (Carrive et al., 2021; Althaus et al., 2018; Althaus and Britzman, 2018) including more explicit discussion on the connection of the research question and the variables can be an important methodological amendment to research.
New cinema history
New Cinema History (Maltby et al., 2011) stresses the importance of societal and temporal context in recent studies on film production (Dang, 2020), circulation (Clariana-Rodagut and Hagener, 2023; van Oort et al., 2020; Verhoeven et al., 2019; Navitski and Poppe, 2017), and reception (Treveri Gennari and Sedgwick, 2022). The premise of this discipline is that alongside the content, the surrounding context and its change over time are crucial factors in creating the meaning of film (as also pointed out by van Noord et al., 2022). Focusing on the contextual factors, this research stream has dealt less with content, yet because the meaning of cultural artefacts relies on both, these aspects need to be combined to reach a more nuanced understanding of newsreels or their aggregated meaning.
Digital hermeneutics
Examining historical material adds its particularities to a study. Current digital historical research has used the concept of ‘digital hermeneutics’ to call for epistemological data aka source criticism and method criticism (Fickers et al., 2022; Oberbichler et al., 2022; Salmi, 2020; Paju et al., 2020). It is crucial to understand how the data was formed and by whom, and what kinds of activities and worldviews it reflects. Firstly, the temporal meaning change of the formally similar units has to be taken into account. For example, showing a horse in a newsreel in 1910 and 1990 most likely creates very different interpretations. Secondly, digitised data are no longer in their original format (Fickers, 2021), and may contain traces left by the production, storage, archiving, digitising, and acquisition processes. For instance, textual descriptions of newsreel content are often added during the digitisation of the material and thus might reflect the perceptions or diligence of the digitisers rather than the activities of the original newsreel authors (Elo, 2020; see also Althaus and Britzman, 2018). As our case study shows in Section III, heavily censored data can also offer relevant results, when interpreted with an understanding that it provides the view of the authorities. Gaps in the data can produce meaningful insights. Therefore, it is important to account for which activities and to whom the traces that are being analysed belong. Furthermore, off-the-shelf computational analysis methods are often trained on contemporary materials and may not work similarly well with historical materials without adaptation (Grósz et al., 2022; Bhargav et al., 2019; Wevers, 2021; Wevers and Smits, 2020). Finally, the quality of cultural heritage materials can vary greatly, which poses additional challenges when studying long-term developments of audiovisual news.
Towards a unified approach
To summarise, while computational video analysis customarily assumes meaning to be contained in the artefact (i.e. the video), qualitative research and New Cinema History argue that meaning only arises when the artefact comes into contact with its audience and can be perceived as having different meanings. Simultaneously, an analysis that ignores inter-subjective contingency is blind to context; an interpretive framework that ignores inter-objective dependency is blind to structure. Both the content and the context should be taken into account, and, we argue, substantial advances in audiovisual (news) studies can be made by coupling these two positions.
The analysis framework for audiovisual newsreel corpora, as outlined in this paper was co-designed within a research process that started with experimental explorations of newsreel data, while negotiating and integrating methods from a spectrum of disciplines as brought together in the CUDAN ERA Chair project for Cultural Data Analytics at Tallinn University. Oscillating between joint reflections in collaborative group work, including two three-day hackathons, and more concentrated work on individual aspects, eventually led to the proposed generalisation of multidisciplinary collaboration in a systematic research process to make sense of historical newsreels at corpus scale. Following C.P. Snow’s call regarding the necessity to bridge the so-called “two worlds” of scholarly enquiry (Snow, 2001 [1959]), our starting point was that multidisciplinary integration brings forth more than a sum of its components. The specific stages of the proposed framework, explained in more detail below, were discovered by combining the established research processes of cultural data analytics and digital history, while experimenting with different ways of integrating quantitative and qualitative approaches, including expertise that is usually found in computation and the natural sciences
The objective of the framework is to exemplify how qualitative and quantitative approaches can be successfully brought together into a joint research pipeline. Towards this purpose, we combine the strengths of qualitative film history, computational video analysis, computational film studies, and New Cinema History listed in Table 1, while closing their mutual and common gaps. In sum, we present a framework for systematically studying large collections of historical newsreels covering several decades in the context of their temporal and cultural dynamics, diversity, and functions. We propose bringing together a comprehensive set of aspects for a nuanced understanding of newsreels as an interplay of different modalities and contextual factors. The framework includes both qualitative and quantitative research feeding into a systematic approach and ability to cover large quantities of data. The framework, which we discuss in Section II, constitutes a schematic template for research projects combining quantitative and qualitative approaches (see Fig. 1). In Section III, we exemplify the framework using a dataset of “News of the Day” newsreel series produced in the Soviet Union in 1944–1992. Finally, Section IV contains the discussion and concludes the article.

The newsreel framework combines qualitative and quantitative approaches into a research pipeline. It contains (a) pairing meaning-making units with variables, (b) digital data (source) and method criticism, and (c) combining quantitative analysis with qualitative conclusions.
Newsreel Framework
Our framework essentially centres around a workflow pipeline configuration (Oberbichler et al., 2022) that includes qualitative and quantitative enquiry (Fig. 1). There are three important stages in the pipeline: detecting and pairing the meaning-making units and variables, digital data (source) and methods criticism, plus merging and explaining analysis visualisations of different dimensions of the data (Fig. 1a–c). The study of newsreels begins with identifying meaningful research questions and data, in relation to preceding research. Perhaps more explicit than in established qualitative approaches, we propose to identify relevant meaning-making units arising from preceding research and qualitative enquiry, and pair them with available variables at the first stage (Fig. 1a). In the second stage, we account for different temporal layers embedded in digitised heritage data to gain a better understanding of how the variables connect with the meaning-making units and the final conclusions of the study (Fig. 1b). After this, appropriate analysis methods are selected, keeping in mind the available variables and research questions, followed by computational analysis. In the third stage the selected variables are studied quantitatively, feeding into an examination of the resulting dimensions of analysis to jointly produce final qualitative conclusions (Fig. 1c). This stage brings the dimensions of analysis together, critically evaluates what the findings jointly report, contextualises them, and responds to the research questions. Adding these three stages to the research pipeline ensures that newsreels are analysed systematically by considering the multidimensional nature of meaning of cultural data (Schich, 2017; Cassirer, 1927), focusing on variables relevant to the research questions, and accounting for multimodality in the final results. The framework is modular, which means that it allows selecting methods that suit the particular research question or using multiple methods comparatively, while dealing with particular meaning-making units and variables. Qualitative and quantitative enquiry are firmly intermingled and mutually dependent in this research process, as exemplified in our case study below. Importantly, different parts of the research project are continuously adjusted in relation to each other (Schich, 2017; Gadamer, 2013 (1960).
While meaning-making units are the elements related to human understanding of what the phenomenon under study is composed of, the variables are the metadata entries or other features of the data that can be directly analysed computationally (cf. the distinction of elements and features in GIS; Zeiler, 1999). Detection and pairing of the meaning-making units with the available or traceable variables (Fig. 1a, see also Fig. 2) improve critical evaluation of meaning and comparability identified as gaps in preceding research (see Table 1). Furthermore, it establishes an explicit connection between the analysed variables and the phenomenon under study, enabling critical evaluation. The preceding literature uses the term ‘cue’ both when referring to what we call here the meaning-making units and variables (e.g. Bordwell, 1991; Ren et al., 2018), which complicates differentiating between the two. The meaning-making units come from the initial idea of the study, the research question, and the preceding literature, while variables are concretely present in the data. While they arise from different roots, the successful pairing of the two concepts is crucial for a fruitful study.
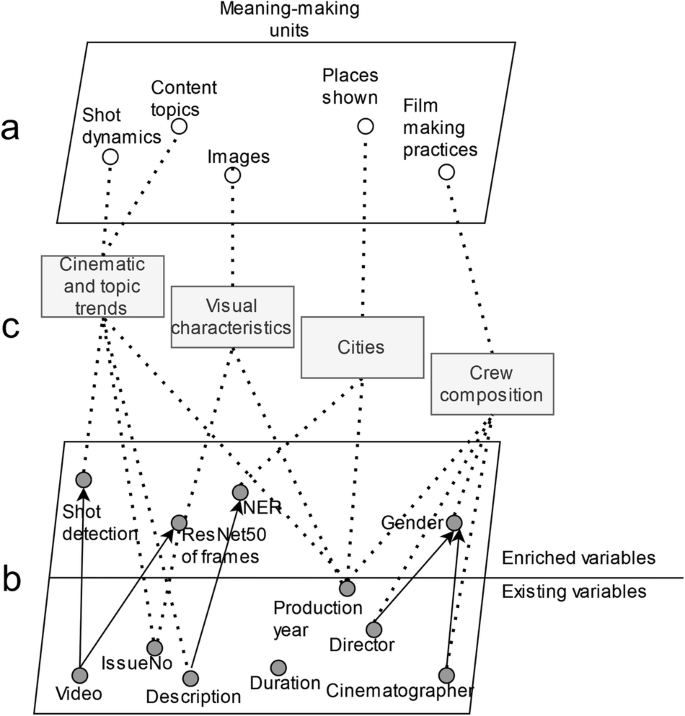
a Meaning-making units selected from Supplementary Table 1 for further analysis. b Existing and enriched variables of the News of the Day data. Arrows signify data enrichment based on the original data. c Resulting dimensions of analysis that interconnect the meaning-making units and variables.
The meaning-making units are elements that make up the phenomenon under scrutiny. Examples of meaning-making units, as relevant for newsreel research and broadly agreed in literature, include images, voice-over narration, acoustic motifs, the persons, activities, or locations shown, and content topics (Supplementary Table 1). Contextual factors are also important, including the socio-political circumstances, other concurrently available mass-communication media, and agency-related issues, like funding and the role of audiences. Relevant meaning-making units can be identified via an extensive literature review of qualitative studies on the topic to see what elements are often suggested and by critically evaluating the gaps. Of course, they may also emerge from analysis itself, in which case the research is firmly going beyond the state of the art.
In addition to the existing feature variables, others can be added, by either manually or algorithmically enriching the data, or adding additional data sources. As Table 2 shows, the most frequent metadata entries in the largest openly available collections of digitised newsreels contain information on production year, newsreel series title, duration, and content annotations either as text or keywords. The metadata entries, together with the available newsreel videos, form the basis for extracting variables. They can be further enriched with information concerning the newsreel authors, distribution, audience reactions, etc. To obtain well-selected units for computational analysis it is crucial to critically evaluate and pair the meaning-making units necessary for responding to research questions with variables that are available or traceable via enrichment. Notably, some variables might reveal meaning-making units indirectly (e.g. the number of people working on newsreels can be indicative of funding and the societal importance of newsreels).
The second stage we propose for the analysis part of the pipeline is to incorporate digital data (source) criticism by taking into account the historical multidimensionality of heritage data, as well as the temporal change affecting the meaning-making units and variables into the study (Fig. 1b). This stage includes qualitative historical reflection, complementing the two other stages of the framework (Fig. 1a, c). At this stage, firstly, the researchers scrutinise how the historical traces of the data, coming from production, storage, archiving, or digitising, are present in the data, affecting which variables should be selected for further analysis. The variable can be connected with the different meaning-making units, depending on the point in time and by whom it was created. For example, if a textual description of the contents was created as a newspaper advertisement or censorship card at the time of producing the newsreels (Werenskjold, 2018; Althaus and Britzman, 2018), the variable connects to the distribution and competition within the cinema market or the political context. If it was created within the digitisation process at a later stage, it should be combined with the interpretations of the later generations of what is noticeable in the contents. Secondly, the researchers will return to this stage after completing computational analysis of the variables to weight the effect of temporal change to the analysis results. As an example, they might reflect upon whether an increasing number of cars detected is due to an explicit choice of the filmmakers, the overall increase of the amount of cars in the society, the fact that the used algorithm detects better new car models than the old ones, or some other reason. Some results may also be absent due to conscious selections in data handling. For example, as our case study in Section III demonstrates, the qualitatively observed absence of footage portraying Stalin before his death in 1953 is most likely a result of de-selection of this material from the data (Fig. 3a). With the twofold reflections concerning the content and method dependency, this stage addresses the lack of historical contextualisation identified in the preceding literature (see Table 1) by proposing to take into consideration the temporal aspects of data both when selecting the variables and when performing the final analysis.

a All News of the Day issues (scatter plot): x-axis publication years, y-axis issue number; the total number of news stories per year based on textual outlines; b number of shots per issue over time; c mean shot length per issue; d shares of news story topics per year classified based on textual descriptions of newsreels using an instructable zero-shot classifier. Each news story is classified with a single class. e A UMAP projection of story embeddings, coloured by the content predictions in (e) and (f); f annual news story topic distribution averaged over years.
The third stage is that selected variables are computationally examined and visualised as different dimensions of analysis (Fig. 1c). Evidently, the used research methods should be selected so that they respond to the research questions when applied to the available variables (for method selection and comparison cf. for e.g. Opoku et al., 2016; Gentles et al., 2016). This stage addresses the lack of multimodality identified in preceding literature (see Table 1), and allows to combine newsreel contents with the contexts in a more streamlined manner. These dimensions, focusing, for example, on newsreel production conditions, or visual and content dynamics of newsreels, are further combined thematically or temporally into preliminary findings. Ideally, the dimensions of analysis represent different parts of the newsreel production, content, and distribution process to reach for a more comprehensive understanding of them. The findings are merged with the wider contextual information from the preceding literature.
The approach proposed here arises from discussions within the field of Cultural Data Analytics (Arnold and Tilton, 2023; van Noord et al., 2022; van Noord, 2022; Manovich, 2020; Arnold and Tilton, 2019; Schich, 2017; CUDAN, 2020–2024). The starting points of this multidisciplinary approach are that cultural phenomena are inherently multi-scale and vary through time and space, that the interactions of particularity and universality are important, and that the meaning of cultural phenomena lies in the multidimensional relations of entities. When reaching for a bigger picture through longitudinal exploration, the main challenge is in maintaining the multitude of the phenomenon under study and simultaneously tracking the dynamics of selected variables. In this circumstance, recognising plurality and multidimensionality is crucial for understanding cultural phenomena, and we should be careful when reducing this multitude into means or homogenous groups (van Noord et al., 2022; van Noord, 2022; Manovich, 2020).
The design of our newsreel framework supports maintaining the multitude of cultural data while tracking its dynamics in a manner that allows comparisons across time and datasets. The following section exemplifies the application of the proposed framework to the analysis of the “News of the Day” newsreel series, published weekly in the Soviet Union from 1944 to 1992.
Case study: production and worldviews of news of the day (1944–1992)
Our case study exemplifies and provides a proof of concept of our proposed analysis framework for historical newsreels by focusing on the Soviet ‘News of the Day’ (Новости дня) newsreel series (1944–1992). In the centralised Soviet media system (Roth-Ey, 2011) this series, produced by the Central Documentary Film Studios in Moscow, was the main newsreel series conveying the Soviet leadership’s messages throughout the country. The case study focuses on worldviews conveyed, the compositions of crews producing them, and how they changed over time. We focused on salient meaning-making units of images, shot dynamics, content topics, places shown, and filmmaking practices (Fig. 2a) because they corresponded with the suggestions of the preceding literature that relate to our research questions about production and contents of newsreels (Supplementary Table 1). The available variables of the News of the Day data are the newsreel issue videos in mp4 format accompanied by the metadata containing the production year, issue number, newsreel duration, brief textual description of the newsreel content, and information on directors and cinematographers who worked on newsreels. We further enriched the data (Fig. 2b; for more details see Materials and Methods) to extend the analysis of newsreel content dynamics with their geographical scope, production conditions (crew gender balance), and to analyse the visual characteristics of newsreels.
We selected for further enquiry variables that corresponded with the following dimensions of analysis: newsreels’ cinematic and topic trends, visual characteristics, dynamics of cities mentioned, and temporal dynamics of crew composition (Fig. 2c). While we acknowledge that distribution, exhibition, and reception also serve as important stages of the newsreel value chain discussed in multiple previous studies (Treveri Gennari and Sedgwick, 2022; Dang, 2020; Chapman et al., 2007), they remain beyond our case studies due to the lack of available data for the News of the Day series. In the following subsections we describe the materials and methods including data, the results relating to different dimensions of analysis, and how we merged them.
Materials and Methods
The data used in the case study is a collection of 1747 issues of the Russian-language Soviet newsreel journal News of the Day digitised by Net-Film company covering the years 1944–1992. We scraped the video files of newsreels with metadata containing information on the production year, issue number, authors and brief content descriptions in Russian and English with the permission of the data provider, the Net-Film company. The data is incomplete in many ways: the collection lacks some newsreel issues; the image and audio quality of the videos is low; and the metadata is imperfect. When working with digitised historical data and analysing the results it provides, incompleteness of the data is a common feature that needs to be taken into account (Carrive et al., 2021). Simultaneously, as our case study shows below, systematic holes in data can reveal crucial source-critical aspects of the data, informing the whole research. It is part of a historians’ skillset to be able to work with incomplete data, and to decide how far conclusions can be drawn from it (Howell and Prevenier, 2001).
The methodology of our case study followed the above proposed phenomenon categorisation by defining the central meaning-making units, and organisation and enrichment of the data to receive corresponding variables. We selected the methods used for analysing the resulting variables based on the team members’ domain expertise and their evaluations on the methods that would best respond to the research question of how the world was depicted in the News of the Day and by what kinds of groups of individuals involved in newsreel production. As the more detailed description of the methods below shows, all the steps of the research process involved intermingled qualitative, quantitative, computational, and human-made processes.
Meaning-making units
The table containing the meaning-making units of newsreels (Supplementary Table 1) was prepared by extensive reading of the preceding qualitative literature on newsreels. Identifying meaning-making units in qualitative research was purposeful because qualitative analysis takes a more holistic view to the phenomenon under scrutiny that quantitative approaches. We collected all the meaning-making units mentioned also in passing in the studies. Because scholars use varying terminology, we homogenised and aggregated the labels of the units. In addition to giving a general view, it also helps to pinpoint groups of studies that have different emphases, for example, on more abstract motifs, or those ones emphasising the contextual and agency-related meaning-making units instead of contents.
Variables
The matrix of the most frequent variables in the largest openly accessible collections of digitised newsreels (Table 2) lists the most commonly used metadata fields and their presence in some of the most well-known digitised newsreel collections. For the purpose of mapping the variety and prevalence of the metadata fields, the matrix lists the metadata entries using a common description, and not the specific entry titles each individual collection uses. Different digitising and archiving projects may use different types of metadata in variable formats, which may necessitate harmonising data in projects using several collections (see also Beals and Bell, 2020). In addition to the listed metadata entries, many collections also contain other data. For this mapping, we did not study how well the metadata entries have been filled or the consistency of the data. We have marked with “x” those entries that already exist, and with “i” those entries that can be extracted from the data. When selecting the variables for a study, qualitative evaluation of the historical dimensions of the data is essential.
Data enrichment
We amended the data by explicating further information both from the newsreel videos and metadata. For the videos, we ran shot boundary detection analysis (SBD), extracted the middle frames of each shot, and produced a ResNet50 (He et al., 2015) embedding for those frames. From the textual descriptions of newsreel contents in the metadata, we identified places mentioned using Named Entity Recognition (NER), and further geocoded the recognised location by adding lat/long coordinates. We also applied automatic detection of the assumed gender of newsreel directors and other crew members based on the surnames, which are grammatically gendered in Russian (Fig. 2b). All automated steps involved qualitative and manual validation and correction of the processed results with human expertise in the loop.
News story categories
Each News of the Day issue is split into individual stories (12,707 across the 1747 reels), which have synopsis-like descriptions in the metadata. We also corrected small numbering and consistency issues in a minority of them by hand. We then applied two types of automatic content categorisation to the stories, topic modelling and content classification. Topic modelling (often using Latent Dirichlet Allocation, a form of “soft” clustering) is a common approach in digital humanities and other fields dealing with large text collections. For topics, we use the pretrained model driven approach (Angelov, 2020, Grootendorst, 2022) where texts are first embedded using a word or sentence embedding (we use fasttext; Bojanowski et al., 2017) and then clustered, with cluster keywords derived via grouped term-frequency inverse-document-frequency (TF-IDF) scaling. The upside of topic modelling as an explorative approach is that the topics need not be known in advance. The downside is that the clusters may be hard to interpret or even meaningless, and the number of clusters must still be defined in advance. We therefore also experimented with another classification approach.
While in the recent past classifying content or topics would have required purpose-trained supervised classifiers, the advent of instructable large language models (LLMs, such as ChatGPT) makes it possible to predict topic or class prevalence in a “zero-shot” manner. Instead of training or tuning a classifier in a supervised manner on annotated examples, generative LLMs can be simply prompted (instructed) to output relevant text, including topic tags given an input example accompanied with the prompt. The simplest example would be along the lines of “Tag this sentence as being of topic X or Y. Example: [text]”, but we find more verbose prompts with topic definitions yield more accurate results. We defined eight topics of interest based on previous qualitative literature and Soviet history: USSR politics, sports, military (defence, wars), scientific and industrial progress (includes innovation, construction projects, space and aviation), USSR economy and industry, USSR agriculture (excludes other economy topics), natural disasters, social issues and lifestyle (includes education, family, health, leisure, culture, religion topics), and a “misc” topic meant to cover everything else (for the prompts, see the Supplementary material). We tested the zero-shot classification accuracy of two models, OpenAI’s generative pre-trained transformer (GPT) models gpt-3.5-turbo-0301 and gpt-4-0301 (OpenAI, 2023). These achieved 88 and 84% accuracy respectively on a hand-annotated 100-story test set. We therefore applied the 3.5 model to the rest of the story synopses, as illustrated in the Results section.
Visual characteristics
We extracted 117 shots on average (ranging from 20 to 247) per newsreel video, with 126 frames (5 s) per shot on average (ranging from 4 to 4508 frames or 0.2 to 180 s). Representing each shot with one frame, the corpus consists of 205.678 frames in total. We used a pre-trained ResNet Convolutional Neural Network (CNN), to embed the extracted video frames in high-dimensional feature space. The original training set for the ResNet50 is ImageNet (Deng et al., 2009), a standard collection of contemporary images, and here we apply it to a collection of low-resolution mostly grayscale images. To identify clusters of visually similar frames and detect common themes across reels we projected the embedding space in 2D using common dimension reduction methods such as t-SNE (van der Maaten and Hinton, 2008) and UMAP (McInnes et al., 2020). Using the Collection Space Navigator (Ohm et al., 2023), an interactive open source tool for exploring image collections, was instrumental in exploring the large-scale visual data and gaining new insights to it. We also visualised all the newsreels by sequencing one frame per shot next to one another, effectively in this way creating a storyboard covering all the examined newsreels. In this part we used standard methods with known biases (see, for example Studer et al., 2019).
Cities
From the results of the Named Entity Recognition (NER) we extracted mentions of cities. We used Wiktionary and authors’ knowledge of Russian grammar to extract additional name-derivative words related to cities. Using this list, we counted mentions of cities in the story descriptions. We qualitatively distinguish five types of city mentions: a) city itself and city dwellers; b) organisations located in the city and named after it; c) names of a region named after the capital (for example ‘Leningrad oblast’) and organisations located there; d) toponyms named after the city which are not located there or in its vicinity including entities, treatises, and historical events (for example ‘Warsaw Pact’); e) not a mention (coincidences and homonyms). We added geo-coordinates taken from Wikipedia to the list of cities to visualise them on a map.
Crew composition
We used newsreel crew metadata to construct a directed graph of co-working relations (Verhoeven et al., 2020) where directors and other crew members act as nodes, and edges indicate collaboration on a newsreel issue. The edge direction is drawn from the director to all other crew members and signifies hiring and supervisory relationships. We utilised Levenshtein distance (Levenshtein, 1965, see also Navarro, 2001) to detect potentially misspelt duplicate names and manually checked the need to merge nodes. The crew dataset contains information about 1251 people who worked on 1730 newsreel productions during 1954–1991 across different positions: director (1740 roles by 104 persons), cinematographer (15,145 roles by 1132 persons) and other crew (editors, sounds designers, etc.; 158 roles by 45 persons). Notably, a small portion of staff work across different roles. The dataset results in a network with 1251 unique person nodes and 15,425 person-to-person links. The first nine years of the data collection period were omitted from network analysis due to inconsistent data.
Cinematic and topic trends
The cinematic and topic trends of the News of the Day data show that newsreel production and release as measured by the number of newsreel issues appears to be stable over fifty years (Fig. 3a) with consistent content shares dedicated to different topics (Fig. 3e). The first and last few years (1945–1953 and 1990–1992) look somewhat different, but they have much less data than the rest of the period (Fig. 3a). Newsreel issue numbers recorded, leased, and preserved in the sparse available data before 1954 seem to indicate that newsreels were produced more or less weekly during that period, but only a tiny fragment has been stored and/or digitised (Fig. 3a). The absence of data before 1954 most likely relates to the ‘de-Stalinization’ of film materials after Stalin’s death in 1953, which included the confiscation of materials with excessive references to the former leader (Heftberger, 2018). During 1954–1986, the weekly production was stable, and newsreels were archived, kept, and later digitised systematically (apart from 1965 with missing data). From 1987, the annual number of produced newsreels decreased by half. The 1987 drop in newsreel production volumes coincides with the time of perestroika characterised by economic turbulence and the rethinking of the Soviet media ecosystem (Rodgers, 2014).
Topic-wise, the shares of political, economic, agricultural, and social news, classified using the zero-shot prediction approach, remained relatively stable until the mid-1980s when the social, and later political themes began to take more room of the preserved newsreels (Fig. 3f). The trend shows an annual rhythm (Fig. 3d), where social news topics usually increased around issue numbers 8–9, which coincided with International Women’s Day, and around issue numbers 48–52 coinciding with the New Year, both officially recognised celebrations in the Soviet Union. Also the topic of agriculture was more prominent around issues 30–40 published in August and September, which were the most important months of harvest.
With a closer look, it is possible to identify subtle changes across the observed period. Although the annual number of issues remained relatively stable during 1954–1986, the number of news stories per issue, determined based on the textual outlines in the metadata, decreased gradually during this time (Fig. 3a). Also the number of shots in a newsreel decreased over time (Fig. 3b), while the mean length of shots started to increase towards the end of the period (Fig. 3c). These results show a contrary trend to the findings of scholars studying Hollywood feature films that indicate shortening shot lengths towards the end of the 20th century (Cutting et al., 2011). The reasons for the ‘stagnating’ Soviet newsreel dynamics should be further explored, with candidates obviously including the availability of film material of extended length, and labour cost in post production, such as cutting and composition. While we provide preliminary exploratory results here, quantitative data like these also naturally allow for the testing of specific hypotheses.
Visual characteristics
Our examination of the central frames of each shot reveals recurring visual patterns that repeat during the whole studied period (Fig. 4). Laying out all the frames of every issue into a storyboard shows subtle length and darkness variation of the (digitised) film material, as well as the launch of colour film in the mid-1980s (Fig. 4a right). Placing the frames in the order of year, issue, and scene number allows for comparing the recurring patterns and changes of the newsreel series. For example, the closeup of the storyboard shows that the opening title frames were customarily followed by frames showing a city scene, indicating the place of the news story. This prelude was followed by scenes depicting activities, such as leaders meeting each other (Fig. 4a left). Using the ResNet50 CNN embedding to extract visual features from the central frame of each shot allows us to examine visual similarities across reels. A UMAP projection of the embedded frames reveals aspects of these similarities at least at a coarse-grain level (Fig. 4b). Consequently the UMAP allows for visual examination, grouping, and annotation of the most prominent image types in the collection, such as “Nature”, “Monumental gatherings”, “People in meetings”, “Closeups of people at work”, ”Industrial production”, “Title frames and other texts”, and “City views”.

a A storyboard of all newsreel issues, x-axis shot number, y-axis publication years and issue numbers in ascending order. The layout of all issues (4a right) shows the temporal variation of issue lengths and the closeup of the storyboard (a left) visualises the first scenes of issues 6–14 from 1970. b A UMAP projection of ResNet50 embedding of all central frames of each shot with seven most prominent image clusters named by the authors as (1) “Nature”; (2) “Monumental gatherings”; (3) “People in meetings”; (4) “Closeups of people at work”; (5) ”Industrial production”; (6) “Title frames and other texts”; and (7) “City views”. We used the Collection Space Navigator (Ohm et al., 2023), i.e. a flexible open-source user interface, for examining the frames and to produce the figure.
City mentions
Our examination of the cities mentioned in the textual descriptions of the newsreel metadata is summarised in Fig. 5. Spatially, it demonstrates a heavy emphasis on Europe, both within the Soviet Union and globally, while the Asian part of the Soviet Union in East of the Ural Mountains, was far less covered, matching its lower population rates (Fig. 5a, b). Outside the Soviet Union, the Warsaw Pact socialist countries are the most frequently covered (36% of all mentions despite being 3% of world population in 1970), as well as ‘neutral’ capitalist countries such as Austria and Finland (9% of all mentions despite being less than 0.4% of world population) (Fig. 5a, b, d). These findings match the consensus among historians studying Soviet history generally (Koivunen, 2016; Gilburd, 2013; Turoma and Waldstein, 2013). Timewise, the number of mentions per year trends downwards (Fig. 5c–e), which matches the general decrease in the number of stories per year (Fig. 3a) and is mostly due to the newsreel issues typically having fewer and longer stories in the 1970s and the 1980s than in the earlier period. It is, however, noteworthy that the number of mentions of foreign cities is shrinking even faster (Fig. 5c, e), emphasising the decline of the fraction of stories dedicated to international events after around 1960. The temporal patterns for some cities demonstrate a variety of interesting qualitative behaviour (Fig. 5e). Constant popularity of Leningrad/St. Petersburg seems natural in the view of its importance as the second-largest city in the USSR and the “cradle of the revolution”, the upward trend in the mentions of Minsk correlates with the rapid growth of its population in the period under consideration, and the bump in the popularity of Krasnoyarsk in the 1960s coincides with the building of the Krasnoyarsk Hydroelectric Dam, which was a topic of multiple newsreel stories. The decline of the mentions of Odesa require further historical analysis. The data for individual cities is rather sparse and noisy so extracting statistically significant information from it requires application of advanced statistical techniques and will be done in detail elsewhere.

Map showing all the cities mentioned in 1944–1992, (a) globally and (b) in Europe. The bubble size indicates the number of mentions. c Average number of mentions of top 50 cities per 1000 stories, the red line is the Soviet cities, and the blue line foreign cities. d Heatmap of city mentions per year for the top 50 most-mentioned cities (Moscow excluded due to heavy overrepresentation). e Heatmap of the top-50 most mentioned cities (Moscow excluded) per 1000 stories in the periods of 1954–1964, 1966–1976, and 1977–1992.
Crew composition
The analysis of newsreel production crews reveals production labour market dynamics and labour division between genders over time. Newsreel production crew numbers (Fig. 6a) closely follow newsreel production volumes (Fig. 3a), with ten people working on a newsreel on average. Directors who lead the productions are expectedly vastly outnumbered by other crews since newsreels contain multiple stories often shot by different cinematographers (on average nine versus a single director per newsreel). The historical labour market features several prominent directors, who lead multiple teams (as seen from high degree-centrality nodes in the director–crew network and node degree distribution in Fig. 6d–e), and who pursue long-lasting careers (Fig. 6c). The analysis of director gender composition reveals the existence of three distinct periods: gender equality during 1945–1959, a women director’s era during 1960–1974, and men director’s era during 1975–1992 (Fig. 6b).

a Number of individuals working on newsreel production over time, coloured by role. b Number of individuals working as directors over time, coloured by the assumed gender (women and men). c Director career longevity for the top-20 most productive directors. d Newsreel production crew network during 1954–1991, edges drawn from directors to other crew, coloured by role. e Degree distribution for the unipartite directed newsreel production crew network, both axes in logarithm.
Merging and explaining
As we have shown above, each dimension of analysis reveals new avenues for further qualitative and quantitative enquiry. In addition, analysing similar trends, interrelated themes, or temporal sequences overarching different dimensions of analysis, including combining them in statistical modelling, may help to explain the studied phenomenon better. In our case study, interested in the worldviews portrayed in the Soviet newsreels, bringing the results from different dimensions of analysis together points out a period with emerging shifts. The most prominent temporal change, found across all dimensions of analysis, was the time of perestroika, which introduced major political and cultural changes in the Soviet Union (1985–1991). Although some of the identified changes during this period, such as the launch of colour film (Fig. 4a), likely had little to do with the political changes, the dimensions of analysis show how profoundly the time of change was affecting different spheres of society. The number of yearly newsreel issues was cut in half, and the published issues contained far fewer news stories (1–3 stories per newsreel against the earlier number of 8–10 stories, Fig. 3a). Simultaneously, the number of filmmakers producing newsreels was rapidly decreasing following the shrinking newsreel production (Fig. 6a, b). It is possible that the collapsing Soviet economy and decentralising cultural policy together with the prevalence of television overran the outdated media of newsreels in the era characterised by a gradual increase of freedom of speech and press (Rodgers, 2014). Digging deeper via qualitative inspection, we can see that in the 1990s the newsreel contents became focused on political meetings held in Moscow, which is visible in the emphasis on political and social topics covered (Fig. 3f), and in geographical concentration on only a few cities (Fig. 5d). The newsreels of the perestroika were characterised by long shots of speeches (Fig. 3c), as many newsreel issues at the time covered extensively the political discussions on the direction of the country, which provided the public in a way first-hand knowledge of who said what in the discussions. Clearly, the worldview that the News of the Day depicted to its audiences, changed in many ways.
While many of these observations are not novel to studies on Soviet history, seeing a signal pointing out the particularity of this period in all the dimensions of analysis is important. It shows that the change of policy in the mid-1980s had way more profound effects than for example, the change of leadership from Khrushchev to Brezhnev in 1964. Quantitative analysis of large amounts of data provides the necessary contextualisation emphasising the specificity of the period, which would not be possible to show in such a concrete manner by a solely qualitative study. The signal evidence furthermore becomes visible to a broader audience, beyond experts whose formation requires years of qualitative research. Additionally, harnessing the findings of the different yet complementary dimensions of analysis together reveals trends that may be interrelated. For example, the diminishing number of crew members can partially explain the decreasing number of issues and shots, and the concentration of the newsreels in only a few cities. With fewer people, it was impossible to cover a larger volume of news material from different places. Focusing only on one dimension of analysis in our case study would not have revealed this possible connection. Finally, all these findings can be enhanced by further qualitative enquiry referencing back to the historical dimensions of the data corpus used in this study and in preceding studies, as well as statistical modelling focusing on any particular questions of interest.
Discussion and conclusions
In this paper, we proposed a framework for studying historical newsreels specifically and audiovisual news more generally in large quantities, while simultaneously maintaining an understanding of the multimodality and complexity of audiovisual data and the relational way of meaning-making associated with them. Analysing newsreels using long-term and large-scale data is beneficial for our understanding of societies in question of the global information landscape, its geographical differences, and the generic features of news content. As our case study on worldviews in the News of the Day newsreel series produced weekly in the Soviet Union during 1944–1992 has demonstrated, combining different dimensions of quantitative analysis together with qualitative enquiry, helps to understand newsreel contents in a long continuum and in a more nuanced way than previously achieved. Quantitative visualisations driven by computational analysis methods help to contextualise smaller-scale qualitative analysis, simultaneously as qualitative analysis allows to explain the detected long-term changes and their nuances. Acknowledging the complexity of the data, i.e. that new quality emerges from large quantities of data, allows for a better-rounded understanding of audiovisual culture. Necessitating a range of co-authors, our approach makes an argument for multidisciplinary research and advocates studying culture by combining different methods and approaches.
The outlined framework is the first attempt to combine the different disciplinary approaches into a comprehensive study of newsreels. Weaknesses in our proposition may of course become apparent when applying it in a variety of studies, yet we argue that this too will necessitate similar multidisciplinary expertise, collaboration, and negotiation. The case study we have presented here provides a brief glimpse into the application of the framework. One limitation of our approach is that while it selects dimensions of analysis intuitively, yet based on expertise of the crowd of co-authors, it does not explore in detail the selection of analysis methods. This will be further explored in the future. In our case study, we have focused on preliminary exploratory enquiry and less on confirmatory analysis or hypothesis testing. Examining the different ways to compare a variety of datasets, coming from different sources, has not been touched upon in this article, and should be further studied to enhance transnational approaches to the study of newsreels. This article has proposed a methodological solution for studying audiovisual news, while the questions of copyright and access to comprehensive collections of audiovisual data and corresponding metadata continue to be major obstacles to further development of this field (Arnold et al., 2021). A further potential hurdle in scaling the approach is the necessity of access to high-performance computation infrastructure for the effective processing of large-scale audiovisual data. In sum, however, with this framework, we hope to open a discussion on how to best study audiovisual news in long-term and large-scale data.
Data availability
The data is available at the company’s website (https://www.net-film.ru/). The code used for accessing the data is available at the supplementary materials.
References
Althaus SL, Britzman K (2018) Researching the issued content of American newsreels. In: Vande Winkel R, Chambers C, Jönsson M (eds.) Researching Newsreels: local, national and transnational case studies. Palgrave Macmillan, Switzerland, p 247–263
Althaus SL, Usry K, Richards S, Van Thuyle B, Aron I, Huang L, Leetaru K et al. (2018) Global news broadcasting in the pre-television era: a cross-national comparative analysis of World War II Newsreel coverage. J Broadcast Electron Media 62(1):147–167. https://doi.org/10.1080/08838151.2017.1375500
Angelov D (2020) Top2Vec: distributed representations of topics, arXiv, https://doi.org/10.48550/arXiv.2008.09470
Arnold T, Scagliola S, Tilton L, and Van Gorp J (2021) Introduction: special issue on audiovisual data in DH. Digit Hum Q 15 (1). http://digitalhumanities.org/dhq/vol/15/1/000541/000541.html
Arnold T, Tilton L (2019) Distant viewing: analyzing large visual corpora. Digit Scholarsh Hum 34:i3–16. https://doi.org/10.1093/llc/fqz013
Arnold T, Tilton L (2023) Distant viewing: computational exploration of digital images. MIT Press, Cambridge, MA. https://doi.org/10.7551/mitpress/14046.001.0001
Bain M, Nagrani A, Schofield D, Berdugo S, Bessa J, Owen J, Hockings KJ, et al. (2021) Automated audiovisual behavior recognition in wild primates. Sci Adv 7(46). https://doi.org/10.1126/sciadv.abi4883
Bakels J-H, Grotkopp M, Scherer T, Stratil J (2020) Matching computational analysis and human experience: performative arts and the digital humanities. Digit Hum Q 14:4
Beals M, Bell E (2020) The atlas of digitised newspapers and metadata: reports from oceanic exchanges. https://doi.org/10.6084/m9.figshare.11560059.v1
Bergström Å, Jönsson M (2018) Screening war and peace: newsreel pragmatism in neutral Sweden, September 1939 and May 1945. In: Vande Winkel R, Chambers C, Jönsson M (eds.) Researching newsreels: local, national and transnational case studies. Palgrave Macmillan, Switzerland, p 157–182
Bhargav S, van Noord N, Kamps J (2019) Deep learning as a tool for early cinema analysis. Proceedings of the 1st workshop on structuring and understanding of multimedia heritage contents. SUMAC ’19. Association for Computing Machinery, New York, NY, USA, p 61–68. https://doi.org/10.1145/3347317.3357240
Bojanowski P, Grave E, Joulin A, Mikolov T (2017) Enriching word vectors with subword information. Trans Assoc Comput Linguist 5:135–146. https://doi.org/10.1162/tacl_a_00051
Bordwell D (1991) Making meaning: inference and rhetoric in the interpretation of cinema. Harvard University Press, Cambridge
Brasó G, Cetintas O, Leal-Taixé L (2022) Multi-object tracking and segmentation via neural message passing. Int J Comput Vis 130(12):3035–3053. https://doi.org/10.1007/s11263-022-01678-6
Brissman E, Johnander J, Danelljan M, and Felsberg M (2022) Recurrent graph neural networks for video instance segmentation. Int J Comput Vis. https://doi.org/10.1007/s11263-022-01703-8
Broadwell P, Tangherlini TR (2021) Comparative K-Pop choreography analysis through deep-learning pose estimation across a large video corpus. Digit Hum Q 15:1
Burges J, Armoskaite S, Fox T, Mueller D, Romphf J, Sherwood E, Ullrich M (2021) Audiovisualities out of annotation: three case studies in teaching digital annotation with mediate. Digit Hum Q 15:1
Burghardt M, Heftberger A, Pause J, Walkowski N-O, Zeppelzauer M (2020) Film and video analysis in the digital humanities—an interdisciplinary dialog. Digit Hum Q 14:4
Carrive J, Beloued A, Goetschel P, Heiden S, Laurent A, Lisena P, Mazuet F, et al. (2021) Transdisciplinary analysis of a corpus of French newsreels: the ANTRACT project. Digit Hum Q 15 (1). http://digitalhumanities.org/dhq/vol/15/1/000523/000523.html
Cassirer E (1927) Das symbolproblem und seine stellung im system der philosophie. Z für ÄEsthet Allg Kunstwiss 21:295–322
Chambers C (2018) The Irish Question: newsreels and national identity. In: Vande Winkel R, Chambers C, Jönsson M (eds.) Researching newsreels: local, national and transnational case studies. Palgrave Macmillan, Switzerland, p 265–283
Chambers Ciara, Jönsson Mats, Vande Winkel Roel (eds.) (2018) Researching newsreels: local, national and transnational case studies. Palgrave Macmillan, Switzerland
Chapman, J, Glancy M, and Harper S (2007) The new film history: sources, methods, approaches. Springer
Chávez Heras D (2024) Cinema and machine vision: artificial intelligence, aesthetics and spectatorship. Edinburgh University Press, Edinburgh
Clariana-Rodagut A, Hagener M (2023) Transnational networks of avant-garde film in the interwar period. In: Roig-Sanz D, Rotger N (eds.) Global literary studies: key concepts. De Gruyter, Berlin, p 253–277
Cooper A, Nascimento F, Francis D (2021) Exploring film language with a digital analysis tool: the case of Kinolab. Digit Hum Q 15:1
CUDAN Open Lab Seminar series 2020–2024. https://www.youtube.com/@CUDANLab/videos)
Cutting JE, Brunick KL, DeLong JE, Iricinschi C, Candan A (2011) Quicker, faster, darker: changes in Hollywood film over 75 years. I-Percept 2(6):569–576. https://doi.org/10.1068/2Fi0441aap
Dang S-M (2020) Unknowable facts and digital databases: reflections on the women film pioneers project and women in film history. Digit Hum Q 14:4
Deng J, Dong W, Socher R, Li L-J, Li K, Fei-Fei L (2009) ImageNet: a large-scale hierarchical image database. In Proceedings of the IEEE conference on computer vision and pattern recognition, 248–255. https://doi.org/10.1109/CVPR.2009.5206848
Elo K (2020) Big Data, Bad Metadata: a methodological note on the importance of good metadata in the age of digital history. In: Fridlund M, Oiva M, Paju P (eds.) Digital histories. Emergent approaches within the new digital history. Helsinki University Press, Helsinki, pp 103–111 https://doi.org/10.33134/HUP-5-6
Fickers A (2021) Authenticity: historical data integrity and the layered materiality of digital objects. In: Fickers A, Schafer V, Takats S, Zaagsma G (eds.) Digital roots. Historicizing media and communication concepts of the digital age. De Gruyter Oldenbourg, Berlin, pp 299–312 https://doi.org/10.1515/9783110740202-017
Fickers A, Tatarinov J, Heijden T (2022) Digital history and hermeneutics—between theory and practice: an introduction. In: Fickers A, Tatarinov J (eds.) Digital history and hermeneutics: between theory and practice. De Gruyter Oldenbourg, Berlin, pp 1–19 https://doi.org/10.1515/9783110723991
Fielding R (2009) Newsreels. Encyclopedia of journalism, 3, SAGE Publications, Thousand Oaks, pp 992–994
Gadamer H-G (2013 (1960)) Truth and method. Bloomsbury Academic
Garrett Cooper Mark, Levavy SaraBeth, Melnick Ross, Williams Mark (eds.) (2018) Rediscovering U.S. newsfilm: cinema, television, and the archive. Routledge, London
Gentles SJ, Charles C, Nicholas DB, Ploeg J, McKibbon KA (2016) Reviewing the research methods literature: principles and strategies illustrated by a systematic overview of sampling in qualitative research. Syst Rev 5(1):172. https://doi.org/10.1186/s13643-016-0343-0
Gilburd E (2013) The Revival of Soviet Internationalism in the Mid to Late 1950s. In: Gilburd E, Kozlov D (eds.) The Thaw: Soviet Society and Culture during the 1950s and 1960s. University of Toronto Press, Toronto, p 362–401
Grootendorst M (2022) BERTopic: neural topic modeling with a class-based TF-IDF procedure. arXiv https://doi.org/10.48550/arXiv.2203.05794
Grósz T, Kallioniemi N, Kiiskinen H, Laine K, Moisio A, Römpötti T, Virkkunen A, Salmi H, Kurimo M, Laaksonen J (2022) Tracing signs of urbanity in the finnish fiction film of the 1950s: toward a multimodal analysis of audiovisual data. In: Proceedings of the 6th digital humanities in the nordic and Baltic countries conference (DHNB 2022), 3232: 63–78. https://ceur-ws.org/Vol-3232/paper05.pdf
Gulshad S, Long T, van Noord N (2023) Hierarchical explanations for video action recognition. Proceedings of the IEEE/CVF Conference on Computer Vision and Pattern Recognition, p 3703–3708. https://doi.org/10.48550/arXiv.2301.00436
Hanjalic A (2002) Shot-boundary detection: unraveled and resolved? IEEE Trans Circuits Syst Video Technol 12(2):90–105. https://doi.org/10.1109/76.988656
Hasegawa T, Kato S (2019) Dialogue mood estimation from speech sounds clusterized with speakers’ personality traits. In Proceedings of the IEEE 8th global conference on consumer electronics (GCCE): 399–401. https://doi.org/10.1109/GCCE46687.2019.9015238
He K, Zhang X, Ren S, Sun J (2015) Deep residual learning for image recognition. Proceedings of the IEEE Conference on Computer Vision and Pattern Recognition (CVPR), p. 770–778. https://doi.org/10.48550/arXiv.1512.03385
Heftberger A (2018) Digital humanities and film studies. Visualizing Dziga Vertov’s Work. Quantitative methods in the humanities and social sciences. Springer International Publishing, Switzerland, https://doi.org/10.1007/978-3-030-02864-0_4
Hickethier K (2016) The creation of cultural identity through weekly newsreels in Germany in the 1950s: as illustrated by the NEUE DEUTSCHE WOCHENSCHAU and the UFA-WOCHENSCHAU (With a Side Glance at the DEFA Weekly Newsreel DER AUGENZEUGE). In: Imesch K, Schade S, Sieber S (eds.) Constructions of cultural identities in newsreel cinema and television after 1945. Transcript Verlag, Bielefeld, p 39–54. https://doi.org/10.14361/9783839429754-003
Hielscher E (2020) The phenomenon of interwar city symphonies: a combined methodology of digital tools and traditional film analysis methods to study visual motifs and structural patterns of experimental-documentary city films. Digit Hum Q 14:4
Hoffmann K (2018) The commentary makes the difference: an analysis of the Suez War in East and West German Newsreels, 1956. In: Vande Winkel R, Chambers C, Jönsson M (eds.) Researching newsreels: local, national and transnational case studies. Palgrave Macmillan, Switzerland, p 77–92
Howell MC, Prevenier W (2001) From reliable sources: an introduction to historical methods. Cornell University Press, Ithaca
Hu X, Tang C, Chen H, Li X, Li J, Zhang Z (2022) Improving image segmentation with boundary patch refinement. Int J Comput Vis 130(11):2571–2589. https://doi.org/10.1007/s11263-022-01662-0
Imesch Kornelia, Schade Sigrid, Sieber Samuel (eds.) (2016) Constructions of cultural identities in newsreel cinema and television after 1945. Transcript Verlag, Bielefeld, 10.14361/9783839429754
Kandukuri RK, Achterhold J, Moeller M, Stueckler J (2022) Physical representation learning and parameter identification from video using differentiable physics. Int J Comput Vis 130(1):3–16. https://doi.org/10.1007/s11263-021-01493-5
Koivunen P (2016) Friends, ‘potential friends,’ and enemies: reimagining Soviet relations to the First, Second, and Third Worlds at the Moscow 1957 youth festival. In: Babiracki P, Jersild A (eds.) Socialist internationalism in the cold war. Springer International Publishing, New York, pp 219–47 https://doi.org/10.1007/978-3-319-32570-5_9
Kong Y, Fu Y (2022) Human action recognition and prediction: a survey. Int J Comput Vis 130(5):1366–1401. https://doi.org/10.1007/s11263-022-01594-9
Kordopatis-Zilos G, Tzelepis C, Papadopoulos S, Kompatsiaris I, Patras I (2022) DnS: distill-and-select for efficient and accurate video indexing and retrieval. Int J Comput Vis 130(10):2385–2407. https://doi.org/10.1007/s11263-022-01651-3
Lazer DMJ, Baum MA, Benkler Y, Berinsky AJ, Greenhill KM, Menczer F, Metzger MJ, Nyhan B, Pennycook G, Rothschild D (2018) The science of fake news. Science 359(6380):1094–1096
Levenshtein VI (1965) Binary codes capable of correcting spurious insertions and deletions of ones. Probl Inf Transm 1(1):8–17
Liu L, Ouyang W, Wang X, Fieguth P, Chen J, Liu X, Pietikäinen M (2020) Deep learning for generic object detection: a survey. Int J Comput Vis 128(2):261–318. https://doi.org/10.1007/s11263-019-01247-4
van der Maaten L, Hinton G (2008) Visualizing data using T-SNE. J Mach Learn Res 11:9
Maltby R, Biltereyst D, Meers P (eds.) (2011) Explorations in new cinema history: approaches and case studies. Wiley
Manovich L (2020) Cultural analytics. MIT Press, Cambridge, MA
Masson E, Olesen CG, Noord Nvan, Fossati G (2020) Exploring digitised moving image collections: the SEMIA project, visual analysis and the turn to abstraction. Digit Hum Q 14:4
McInnes L, Healy J, Melville J (2020) UMAP: uniform manifold approximation and projection for dimension reduction. ArXiv http://arxiv.org/abs/1802.03426
Morgan M (2008) Reality and media reality. The international encyclopedia of communication, John Wiley & Sons, New Jersey. https://doi.org/10.1002/9781405186407.wbiecr015
Mourchid Y, Renoust B, Roupin O, Văn L, Cherifi H, Hassouni ME (2019) Movienet: a movie multilayer network model using visual and textual semantic cues. Appl Netw Sci 4(1):121. https://doi.org/10.1007/s41109-019-0226-0
Navarro G (2001) A guided tour to approximate string matching. ACM Comput Surv 33(1):31–88. https://doi.org/10.1145/375360.375365
Navitski R, Poppe N (2017) Cosmopolitan film cultures in Latin America, 1896–1960. Indiana University Press, Indiana
Nazir S, Cagali T, Sadrzadeh M, Newell C (2020) Audiovisual, genre, neural and topical textual embeddings for TV programme content representation. In: Proceedings of the IEEE international symposium on multimedia (ISM): p 197–200. https://doi.org/10.1109/ISM.2020.00041
van Noord N (2022) A survey of computational methods for iconic image analysis. Digit Scholarsh Hum 37(4):1316–1338. https://doi.org/10.1093/llc/fqac003
van Noord N, Olesen CG, Ordelman R, Noordegraaf J (2021) Automatic annotations and enrichments for audiovisual archives. ICAART 1:633–640
van Noord N, Wevers M, Blanke T, Noordegraaf J, and Worring M (2022) An analytics of culture: modeling subjectivity, scalability, contextuality, and temporality. arXiv https://doi.org/10.48550/arXiv.2211.07460
Oberbichler S, Boroş E, Doucet A, Marjanen J, Pfanzelter E, Rautiainen J, Toivonen H, Tolonen M (2022) Integrated interdisciplinary workflows for research on historical newspapers: perspectives from humanities scholars, computer scientists, and librarians. J Assoc Inf Sci Technol 73(2):225–239. https://doi.org/10.1002/asi.24565
Ohm T, Canet Solá M, Karjus A, and Schich M (2023) Collection space navigator: interactive visualization interface for multidimensional datasets. https://collection-space-navigator.github.io/
Olesen CG, Kisjes I (2018) From text mining to visual classification: rethinking computational new cinema history with Jean Desmet’s digitised business archive. TMG J Media Hist 21(2):127–145. https://doi.org/10.18146/2213-7653.2018.370
Olesen CG, Masson E, Van Gorp J, Fossati G, Noordegraaf J (2016) Data-driven research for film history: exploring the Jean Desmet collection. Mov Image: J Assoc Mov Image Arch 16(1):82–105. https://doi.org/10.5749/movingimage.16.1.0082
van Oort T, Jernudd Å, Lotze K, Pafort-Overduin C, Biltereyst D, Boter J, Dibeltulo S et al. (2020) Mapping film programming across post-war Europe (1952): arts and media. Res Data J Hum Soc Sci 5(2):109–125. https://doi.org/10.1163/24523666-00502009
OpenAI (2023) GPT-4 technical report. arXiv https://doi.org/10.48550/arXiv.2303.08774
Opoku A, Ahmed V, Akotia J (2016) Choosing an appropriate research methodology. In: Ahmed V, Opoku A, Aziz Z (eds.) Research methodology in the built environment: a selection of case studies. Routledge, London, p 32–50
Paju P, Oiva M, Fridlund M (2020) Digital and distant histories: introducing emergent approaches within the new digital history. In: Fridlund M, Oiva M, Paju P (eds.) Digital readings of history. history research in the digital era. Helsinki University Press, Helsinki, p 3–18. https://doi.org/10.33134/HUP-5
Park S, Bellur A, Han DK, Elhilali M (2021) Self-training for sound event detection in audio mixtures. In Proceedings of the ICASSP 2021–2021 IEEE international conference on acoustics, speech and signal processing (ICASSP): 341–345. https://doi.org/10.1109/ICASSP39728.2021.9414450
Pérez AF, Sanguineti V, Morerio P, Murino V (2020) Audio-visual model distillation using acoustic images. In: Proceedings of the IEEE winter conference on applications of computer vision (WACV): 2843–2852. https://doi.org/10.1109/WACV45572.2020.9093307
Pozdorovkin M (2012) Khronika: Soviet newsreel at the dawn of the information age. PhD thesis, Harvard University. https://dash.harvard.edu/handle/1/9823973
Pozharliev L, Gallo González D (2018) Martin Luther King’s assassination in Spain’s NO-DOs and in Bulgaria’s Kinopregledi. In: Vande Winkel R, Chambers C, Jönsson M (eds.) Researching newsreels: local, national and transnational case studies. Palgrave Macmillan, Switzerland, p 93–117
Pustu-Iren K, Sittel J, Mauer R, Bulgakowa O, Ewerth R (2020) Automated visual content analysis for film studies: current status and challenges. Digit Hum Q 14:4
Rasheed Z, Shah M (2003) Scene detection in Hollywood movies and TV shows. In: IEEE computer society conference on computer vision and pattern recognition, 2:II–343. https://doi.org/10.1109/CVPR.2003.1211489
Ravessoud C, Haver G (2016) Art exhibitions through newsreels: an avatar for identity politics (1945–1960). In: Imesch K, Schade S, Sieber S (eds.) Constructions of cultural identities in newsreel cinema and television after 1945. Transcript Verlag, Bielefeld, p 101–116. https://doi.org/10.14361/9783839429754-006
Ren H, Renoust B, Viaud M-L, Melançon G, and Satoh S (2018) Generating ‘Visual Clouds’ from multiplex networks for TV news archive query visualization. In: Proceedings of the International Conference on Content-Based Multimedia Indexing (CBMI): 1–6. https://doi.org/10.1109/CBMI.2018.8516482
Rodgers J (2014) From Perestroika to Putin: journalism in Russia. In: Media Independence, Routledge, London, p 237–256
Roth-Ey K (2011) Moscow prime time: how the Soviet Union built the media empire that lost the cultural cold war. Cornell University Press, Ithaca
Salmi H (2020) What is digital history? Polity, Medford
Salt B (1974) Statistical style analysis of motion pictures. Film Q 28(1):13–22. https://doi.org/10.2307/1211438
Sampaio S (2022) From propaganda to attraction: reassessing the role of the public in the Newsreel Jornal Português (1938–1951). Hist J Film Radio Telev 42(3):470–492. https://doi.org/10.1080/01439685.2021.1976918
Sanguineti V, Morerio P, Del Bue A, Murino V (2022) Unsupervised synthetic acoustic image generation for audio-visual scene understanding. IEEE Trans Image Process 31:7102–7115. https://doi.org/10.1109/TIP.2022.3219228
Schich M (2017) The hermeneutic hypercycle. In: Brockman J (ed.) Know this: today’s most interesting and important scientific ideas. Harper Perennial, New York, p 561–563
Schich M (2019) Cultural analysis situs. ART-Dok eprint https://doi.org/10.11588/artdok.00006347
Senocak A, Oh T-H, Kim J, Yang M-H, Kweon IS (2018) Learning to localize sound source in visual scenes. In: Proceedings of the IEEE/CVF conference on computer vision and pattern recognition: 4358–4366. https://doi.org/10.1109/CVPR.2018.00458
Snow CP (2001) The two cultures. Cambridge University Press, London (1959)
Sommer NM, Velipasalar S, Hirshfield L, Lu Y, Kakillioglu B (2020) Simultaneous and spatiotemporal detection of different levels of activity in multidimensional data. IEEE Access 8:118205–118218. https://doi.org/10.1109/ACCESS.2020.3005633
Studer L, Alberti M, Pondenkandath V, Goktepe P, Kolonko T, Fischer A, Liwicki M, and Ingold R (2019) A comprehensive study of imagenet pre-training for historical document image analysis. In: Proceedings of the international conference on document analysis and recognition (ICDAR): 720–725. https://doi.org/10.1109/ICDAR.2019.00120
Treveri Gennari D, Sedgwick J (2022) Five Italian cities: comparative analysis of cinema types, film circulation and relative popularity in the mid-1950s. In: Sedgwick J (ed.) Towards a comparative economic history of cinema, 1930–1970. Springer International Publishing, Cham, p 249–279. https://doi.org/10.1007/978-3-031-05770-0_9
Tsivian Y (2009) Cinemetrics, part of the humanities’ cyberinfrastructure. In: Ross M, Grauer M, Freisleben B (eds.) Digital tools in media studies. analysis and research. An overview. Transcript, Bielefeld, p 93–100
Turoma Sanna, Waldstein Maxim (eds.) (2013) Empire de/centered: new spatial histories of Russia and the Soviet Union. Ashgate, Farnham
Tworek HJS (2019) News from Germany: the competition to control world communications, 1900–1945. News from Germany. Harvard University Press, Harvard, https://doi.org/10.4159/9780674240728
Valverde, FR, Valeria Hurtado J, and Valada A (2021) There is more than meets the eye: self-supervised multi-object detection and tracking with sound by distilling multimodal knowledge. In: Proceedings of the IEEE/CVF conference on computer vision and pattern recognition (CVPR): 11607–11616. https://doi.org/10.1109/CVPR46437.2021.01144
Vande Winkel R, Biltereyst D (2018) Newsreel production, distribution and exhibition in Belgium, 1908-1994. In: Vande Winkel R, Chambers C, Jönsson M (eds.) Researching newsreels: local, national and transnational case studies. Palgrave Macmillan, Switzerland, p 231–246
Veldi M, Bell S, Kuhlmann F (2019) Five-year plan in four: Kolkhoz propaganda in film and documentaries in Estonia. SHS Web Conf 63:10002. https://doi.org/10.1051/shsconf/20196310002
Verhoeven D, Coate B, Zemaityte V (2019) Re-distributing gender in the global film industry: beyond #metoo and #methree. Media Ind J 6(1):135–155. https://doi.org/10.3998/mij.15031809.0006.108
Verhoeven D, Musial K, Palmer S, Taylor S, Abidi S, Zemaityte V, Simpson L (2020) Controlling for openness in the male-dominated collaborative networks of the global film industry. PLOS One 15(6):e0234460. https://doi.org/10.1371/journal.pone.0234460
Wan S, Xu X, Wang T, Gu Z (2021) An intelligent video analysis method for abnormal event detection in intelligent transportation systems. IEEE Trans Intell Transport Syst 22(7):4487–4495. https://doi.org/10.1109/TITS.2020.3017505
Wang D, Zhang S (2022) Unsupervised person re-identification via multi-label classification. Int J Comput Vis 130(12):2924–2939. https://doi.org/10.1007/s11263-022-01680-y
Werenskjold R (2018) Around the world: the first Norwegian newsreel, 1930–1941. In: Vande Winkel R, Chambers C, Jönsson M (eds.) Researching newsreels: local, national and transnational case studies. Palgrave Macmillan, Switzerland, p 51–75
Wevers M (2021) Scene detection in De Boer historical photo collection. In: Proceedings of the 13th international conference on agents and artificial intelligence (ICAART 2021), 1:601–610. https://doi.org/10.5220/0010288206010610
Wevers M, Smits T (2020) The visual digital turn: using neural networks to study historical images. Digit Scholarsh Hum 35(1):194–207. https://doi.org/10.1093/llc/fqy085
Williams M, Bell J (2021) The Media Ecology Project: Collaborative DH synergies to produce new research in visual culture history. Digit Hum Q 15:1
Winston B (2018) Wofull News from Wales: details at 11. news, newsreels, bulletins and documentaries. In: Vande Winkel R, Chambers C, Jönsson M (eds.) Researching newsreels: local, national and transnational case studies. Palgrave Macmillan, Switzerland, p 15–33
Yang K, Russell B, Salamon J (2020) Telling left from right: learning spatial correspondence of sight and sound. In: Proceedings of the IEEE/CVF conference on computer vision and pattern recognition (CVPR): 9929–9938. https://doi.org/10.1109/CVPR42600.2020.00995
Ye K, Kovashka A (2022) Weakly-Supervised Action Detection Guided By Audio Narration. In: Proceedings of the IEEE/CVF conference on computer vision and pattern recognition workshops (CVPRW): 1527–1537. https://doi.org/10.1109/CVPRW56347.2022.00159
Zeiler M (1999) Modeling our world: the ESRI guide to geodatabase design. ESRI Press
Zhang Q, Chan AB (2022) 3D crowd counting via geometric attention-guided multi-view fusion. Int J Comput Vis 130(12):3123–3139. https://doi.org/10.1007/s11263-022-01685-7
Zhao B, Gong M, Li X (2021) AudioVisual video summarization. IEEE Transactions on Neural Networks and Learning Systems: 1–8. https://doi.org/10.1109/TNNLS.2021.3119969
Acknowledgements
European Union Horizon2020 research and innovation programme ERA Chair project for Cultural Data Analytics CUDAN (Project no. 810961); National programme of the Ministry of Education and Research of the Republic of Estonia for April 2022–February 2023 (Project no. EKKD77); Estonian Research Council Public Value of Open Cultural Data (Project no. PRG1641); European Union Horizon Europe research and innovation programme CresCine—Increasing the International Competitiveness of the Film Industry in Small European Markets (Project no. 101094988).
Author information
Authors and Affiliations
Contributions
MO, KM, VZ, TO, MT, MM, AK, DCH, MCS, and MS designed research, KM and MO acquired the data, MO, KM, VZ, MT, TO, and HHJ prepared the data, MO, KM, VZ, AK, MT, TO, MM, and MS performed the analysis, and MO, VZ, and MS wrote the manuscript. MO is the first author. MS is the supervising author.
Corresponding author
Ethics declarations
Ethical approval
This article does not contain any studies with human participants performed by any of the authors.
Informed consent
This article does not contain any studies with human participants performed by any of the authors.
Competing interests
The authors declare no competing interests.
Additional information
Publisher’s note Springer Nature remains neutral with regard to jurisdictional claims in published maps and institutional affiliations.
Supplementary information
Rights and permissions
Open Access This article is licensed under a Creative Commons Attribution 4.0 International License, which permits use, sharing, adaptation, distribution and reproduction in any medium or format, as long as you give appropriate credit to the original author(s) and the source, provide a link to the Creative Commons licence, and indicate if changes were made. The images or other third party material in this article are included in the article’s Creative Commons licence, unless indicated otherwise in a credit line to the material. If material is not included in the article’s Creative Commons licence and your intended use is not permitted by statutory regulation or exceeds the permitted use, you will need to obtain permission directly from the copyright holder. To view a copy of this licence, visit http://creativecommons.org/licenses/by/4.0/.
About this article

Cite this article
Oiva, M., Mukhina, K., Zemaityte, V. et al. A framework for the analysis of historical newsreels. Humanit Soc Sci Commun 11, 530 (2024). https://doi.org/10.1057/s41599-024-02886-w
Received:
Accepted:
Published:
DOI: https://doi.org/10.1057/s41599-024-02886-w
