
Abstract
The Johns Hopkins Learning Environment Scale (JHLES) was developed by Robert B. Shochet, Jorie M. Colbert and Scott M. Wright of the Johns hopkins university school of medicine and consists of 28 items used to evaluate perception of the academic environment. The objective was to translate and adapt the JHLES to Polish cultural conditions and to validate the Polish version of the tool. The JHLES questionnaire was completed by students of all years (first–fifth) of the faculties of dental medicine at the Medical University of Lublin and the Medical University of Gdańsk. The total surveyed population consisted of 597 students. The overall reliability of the tool was excellent. Confirmatory factor analysis was performed in order to confirm structural consistency with the original JHLES tool. Consequently, all indices had acceptable values (close to 1 or 0, depending on the case), and there was consistency in the results, which shows that the JHLES model is supported by the data. In the present study, the JHLES has been validated in a sample of dental students for the first time in Poland and Europe. Our study provided good evidence for the reliability and validity of the Polish version of the JHLES. In conclusion, the Polish-language version of the JHLES questionnaire is a reliable and valid instrument for analysing the learning environment for students, and its factor structure is supported by the data.
Introduction
Recently many authors have witnessed a trend toward increased attention being paid to the learning environment-related aspects1,2. As the needs of students evolve, universities have to meet the challenge and introduce changes that respond to these evolving demands. The learning environment encompasses a wide range of domains related to educational, physical, social, and psychological contexts that have a subsequent impact on the professional skills of the students3,4,5. Bonsaken and other authors reported that the perceived quality of the learning environment directly impacted students’ learning and exam results, their satisfaction with the course or study programme, their personal well-being and overall academic achievement3,6,7,8,9,10,11.
According to Bloom definition, the educational or learning environment concept can be defined: “the conditions, external stimuli, and forces which may be physical, social, as well as intellectual forces which challenge the individual and influence students’ learning outcomes”10,10.
Assessment of the learning environment is important for enabling improvement in the quality of the curriculum. The most often used and most available way of assessing the learning environment assessment is the evaluation of students’ perception of this environment10,13. So far, the Polish learning environment has not been assessed on a large scale and in order to carry out such assessment it is necessary to adapt the appropriate tools. The research will allow these tools to be used later to assess the learning environment of Polish medical schools.
According to the study by Rusticus et al., the learning environment can be divided into four spheres: psychological, social, cultural and physical14. Those engaged in the process of education (both the student and the educator) and also the setting have an impact on the whole learning environment15. Focusing only on one aspect, such as student’s perspective, may be insufficient for proper/comprehensive assessment of the learning environment16. Thus, it is important to conduct studies to determine the mutual influence of different aspects.
Acton and McNeil described the interrelationship between different dimensions of the learning environments such as space, pedagogy and learning17,18.
The psychological aspect of the learning environment refers to feelings as well as the preparation for learning and teaching on the part of students, academic staff and other people engaged in education (e.g. administration, technical support, etc.). Meanwhile, from the social perspective, the relationships among these stakeholders and the emotions associated with education and handling matters connected with the education process at university are relevant, as well as the motivation and expectations of both students and educators. Ideally, these expectations should be similar. An extremely important factor is cultural tolerance, especially in the case of learning environments made up of people from different cultural backgrounds. Misunderstandings due to such issues could have a very negative impact on the whole learning environment. Also, one cannot ignore the conditions of the premises where classes are held, which may also have a significant impact on the quality of education, and thus perception of learning environment. As pointed out by McNeil and Borg, it is not only about the halls and rooms where the classes take place, but also about the space available for students to meet, self-study and rest17.
Consequently, there is the need to develop a tool for the assessment of the quality of the learning environment within universities. In 1997, Roff et al. developed the Dundee Ready Educational Environment Measure (DREEM) questionnaire19, which remained the gold standard for assessment of the quality of the learning environment in medical universities for many years. Over time, more modern questionnaires emerged that raised important issues that do not have their counterparts in DREEM. For this reason, the Johns Hopkins Learning Environment Scale (JHLES) questionnaire has been used increasingly in recent years to assess the learning environments within medical universities worldwide. It is also a newer questionnaire that deals with current issues of safety and inclusion of medical students. In addition, the JHLES questionnaire is based on an earlier in-depth literature review and the criteria used to determine the strength of validity evidence in a systematic review of studies that assessed medical students’ and residents’ perceptions of the learning environment4,20
The JHLES is a 28-item assessment tool designed for measuring students’ perceptions of the academic environment. It was designed by Robert B. Shochet, Jorie M. Colbert and Scott M. Wright of the John Hopkins University School of Medicine11 The JHLES was developed using a consistent methodology starting in 2012 and a Likert scale is used to gradeits items. Assessing students’ perceptions of the institutional curriculum, environment, and possibilities, as well as their relationships with peers and university staff and their level of involvement in the academic community, is the goal of the JHLES. The JHLES has been modified, translated, and utilized in a few countries so far. In Brazil Damiano et al demonstrated reliability and validity for the JHLES. as feasible option for measuring learning environment in Brazilian medical students21. In China the JHLES was utilized to assess medical students’ perceptions of medical school learning environment; the main goal of Zhou et al study was to identify influencing factors for medical students’ perception levels22.In Malaysia Tackett et al validated the JHLES and measured the learning environment using two tools: JHLES and DREEM23,24. The JHLES has not been translated or validated for Polish conditions until now.
Materials and methods
The objective here was to translate and adapt the JHLES questionnaire to Polish cultural conditions and validate the Polish version of the tool.
This study was part of a project fully funded by the National Science Centre. The aim of the project was to validate DREEM and JHLES. The validation of the DREEM questionnaire has already been published25. The aim of the project was also to validate a more modern questionnaire that is becoming increasingly popular. In addition, there are Items in the JHLES that raise important issues (e.g. 24–26) that have no equivalent in the DREEM, both questionnaires complement each other well. The two validations are not presented in one paper, as most journals have a page or character limit for papers. The project manager decided that this route would be more accessible for future readers. Acquiring adequate research tools is crucial for analyzing the educational environment, our study will enable both methods (the JHLES and DREEM) to be employed to examine the educational environment of Polish medical schools in the future.
Evaluating the learning environment is beneficial because it can reveal how students perceive their surroundings and allow teachers to analyse, plan, and integrate effective teaching strategies to improve it.
To the best of the authors’ knowledge, neither the dental community nor the other medical students involved in this study participated in any other established process for evaluating the learning environment And it was decided that every dental student from the two colleges that were chosen would take part in this investigation.
The objective of the study consisted of the translation, cultural adaptation, and validation of the JHLES questionnaire. As no universal guidelines are available for cultural adaptation of surveys, the authors followed the methodology described in previous studies26.
The original JHLES questionnaire is presented in Table 1.
The JHLES questionnaire was completed by students of all years (first–fifth year) of the faculties of dental medicine at the Medical University of Lublin and the Medical University of Gdansk. The total surveyed population consisted of 650 studentsand their characteristics are given in Table 2. The study was carried out during April–June 2022 and was approved by the Bioethics Committees at the Medical University of Lublin and the Medical University of Gdańsk, as well as by the authorities of both universities. The deans of the various schools of dentistry gave permission for the study to be conducted and the collaborators involved with the schools received written instructions on how to implement the project. One of the authors also carried out the research in both universities.
The questionnaire was handed out to the students during their classes. Before starting the survey, each collaborator briefly clarified the aims of the study and the method by which the data will be processed, particularly emphasizing aspects of voluntary participation and anonymity. Sociodemographic data such as age, gender, academic year and origin were also collected25.
Participants and criteria for eligibility
All 418 undergraduate full-time students from the end of the first year through to the fifth year of the Medical University of Lublin and 348 from the Medical University of Gdansk present during the classes when the JHLES and DREEM were administered were invited to participate in this study. Inclusion criteria were to be a dentistry student and give consent for participation in the study. Exclusion criteria were previous participation in a pilot study; lack of consent to participate in the study; and failure to complete the questionnaire twice. Polish medical schools have a 5 years curriculum: the first 2 years are preclinical, followed by 2 years of clinical activity and the last year as mostly hospital activities. Students were informed that 35 days later they would have both the JHLES and DREEM retested. Both questtionnaires were validated simultaneously25.
Students who agreed to participate in the survey received no remuneration in any form. The first round of testing lasted approximately 30 min, and the second round about 20 min. To compare both the test and the retest data, students were asked to encode their surveys; surveys were pseudoanonymized, and the students were able to obtain a number from the random number generator. Surveys that had not been encoded or had no matching test/retest surveys were excluded from study25.
Sample size selection was based on the generally accepted rule of thumb that there must be at least 5–15 cases per estimated parameter in the confirmatory factor analysis (CFA)25.
Characteristics of the sample
The primary sample consisted of 650 undergraduate students (498 females, 152 males) recruited from various departments within the Lublin and Gdańsk universities. Of 650 observations in our sample, the 53 (8.2%) contained 1 to 6 missing values. Within each question, the proportion of missing data did not exceed 1.06% (see Fig. 1 in the Appendices section).
Translation and transcultural adaptation validity
Firstly, permission to translate and adapt the questionnaires was obtained from the authors. Secondly, the author and two other individuals with a fluent command of English while having Polish as their mother tongue translated the questionnaires into Polish. All three versions were compared and consolidated into a consensus version consistent with the original in terms of terminology, semantics, and concept. A separate consensus was reached for each questionnaire item. Minor changes were introduced to ensure the JHLES was adequate for Polish academic culture. Following the translation of both scales into Polish, they were sent to two native speakers of English who independently translated both questionnaires back into English. In this way, a total of four questionnaires were back-translated, two versions of DREEM and two versions of the JHLES. The two versions of back translations were sent to the original authors so that the final wording of the questionnaires could be determined. The final versions of the questionnaires were translated into Polish by the author and two professional translators and later submitted for consultation and a pilot study with a group of 10–15 members of the Polish Association of Dental Students. Following the consultation and pilot study, final amendments were made to the questionnaires by the Polish authors (Table 3).
The cultural adaptation involved adjusting the questionnaire to the Polish academic environment: for example, the term “School of Medicine” was replaced by “Medical University” because in Poland only medical universities exist; “faculty advisors” was replaced by “coordinators/tutors” because they fulfil a similar function in Poland; and due to the dissimilarity of the Polish language, questions were replaced by statements so that the questionnaire could be understandable and grammatically correct. Furthermore, female grammatical forms (Polish: feminatywy), female variants of performers of actions and personal characteristic names were added. Women are named in terms of their titles, fulfilled functions, held positions, practiced professions, nationality, background, faith, convictions, psychological and physical qualities, and performed activities. They represent a class of lexemes with permanent female grammatical gender that consists of syntactically independent nouns. They do not include adjectives or verbs, in the case of which gender is an inflectional category. By adding female grammatical forms, we wanted to address both female and male students25.
Questions 1, 2 and 5 were converted into statements in order to standardize the answers on the Likert scale. For each statement, students could answer: strongly agree, agree, disagree, strongly disagree, strongly disagree. If Items 1, 2 and 5 had remained questions, the answers for these three items would have had to be changed to Polish. All changes were approved by the author of the questionnaire and also checked by a professional language corrector.
Items 6 and 10 were also accepted by the author of the original questionnaire and there were no queries during the pilot study or the target study.
Statistical analysis
Basic descriptive statistics were tabulated with tests for significant differences applied as appropriate. Basic descriptive statistics were used for the study group characteristics and the JHLES results as well as for medical university, gender, and academic year.
Overall JHLES scores were computed by summing across survey items for each scale.
Spearman correlation coefficients were calculated to determine associations between each of the JHLES scales and their respective subcategories or domains.
The reliability of the JHLES questionnaire (both the global scale and the subscales) was evaluated for internal consistency using Cronbach’s α, the value of which is between 0 and 1. This coefficient reflects the homogeneity of the scale, which is the level to which it can be regarded as a measure of a single construct27. Following the methodology of Dimoliatis et al., we estimated ‘expected’ α values for the various subscales and compared them with the ‘observed’values28.
The significance level of the statistical tests in this analysis was set at α = 0.05 and the normality of the distributions of the variables was analysed using the Shapiro–Wilk test. Numerical variables with distributions that deviated from the normal distribution were reported as the median with quartiles (Mdn; Q1, Q3) and normally distributed variables as the mean and standard deviation (M; SD).
Confirmatory factor analysis
The confirmatory factor analysis (CFA) model was specified based on the theoretical framework proposed for measurement to assess students’ perceptions of the medical school learning environment. It was hypothesized that the 28-item JHLES would load onto seven latent factors: community of peers; faculty relationships; academic climate; meaningful engagement; mentoring; inclusion and safety; and physical space. Indicator variables were defined by Likert scale items with values from 1 to 5.
We conducted CFA to test our hypothesized measurement model. A diagonally weighted least squares (DWLS) estimator was performed, which is appropriate for our ordinal data and the optimization method used was NLMINB (non-linear minimization).
The model fit was assessed using several fit indices, including the comparative fit index (CFI), tucker-lewis index (TLI), and root mean square error of approximation (RMSEA), standardized root mean square residual (RSMR).
We also employed Little’s MCAR (missing completely at random) test to evaluate whether the occurrence of missing data in our dataset was completely random29.
Differences between groups
Welch’s t test was used for variables with normal distribution and two groups. The effect size was calculated using Hedges g-measure. And the effect obtained was interpreted based on Cohen’s convention30.
Welch’s ANOVA test was used for variables with a normal distribution and number of groups above and the effect size was calculated using the omega squared effect size measure. The obtained effect was interpreted based on Field’s convention31. Significance between pairs of groups was tested using the Games-Howell test. To account for multiple comparisons between pairs of groups, the significance level was adjusted using the Holm correction.
Correlation analysis
Spearman’s rank correlation coefficient (rho) was used to measure the strength and direction of association between two numerical variables when at least one variable was not normally distributed; statistical significance was calculated using the algorithm AS 8932.
Statistical environment
Analyses were conducted using the R Statistical language (version 4.1.1; R Core Team, 2021)33 on Windows 10 Pro 64 bit (OS build 19045), using the packages lavaanPlot (version 0.6.2), report (version 0.5.7; Makowski D et al., 2023), ggstatsplot (version 0.9.3; Patil I, 2021)34, lavaan (version 0.6.12)35, gtsummary (version 1.6.2)36, naniar (version 1.0.0)37, ggplot2 (version 3.4.0)38, readxl (version 1.3.1)39, dplyr (version 1.1.2)40, effectsize (version 0.8.3)41 and psych (version 2.1.6)42.
Ethical approval and consent to participate
He study was approved by the Bioethics Committees at the Medical University of Lublin (KE-0254/61/03/2022) and the Medical University of Gdańsk (KE-0254/61/03/2022) as well as by the authorities of both universities. All methods were carried out in accordance with the relevant guidelines and regulations. Informed consent was obtained from all subjects.
Results
Handling missing data
The output from Little’s MCAR test was χ2 = 1279.222, p < 0.001 providing strong evidence against the null hypothesis (data are Missing Completely At Random). This suggested that the occurrence of missing data was systematic and might be related to either observed or unobserved data. The lack of randomness prevented imputation of data, therefore observations with missing values were removed from the dataset. The characteristics of the final sample are presented in Table 2. The overall response rates were 325/418 (78%) and 272/348 (78%) respectively.
Correlation analysis
As shown by the correlation analysis (Table 4), positive corrected item-subscale and item-total correlations were identified for nearly all item pairs. Correlations between items within each subscale were stronger than those between items from different subscales. Strong positive correlations were identified within the individual subscales, with the exception of Subscale 7, where moderate correlations were identified for Item 27.
Reliability analysis
We estimated the ‘expected’ Cronbach’s α values in the different subscales and compared them with the ‘observed’ values28. The overall reliability of the tool was 0,896.
The study was carried out using a test–retest design and therefore intraclass correlation coefficients (ICC) were also determined for the purpose of reliability assessment (Table 5).
Confirmatory factor analysis
Model fit
The model fitted normally after 113 iterations. The number of parameters of final model was 77, with 597 observations.
First, we tested the baseline model, which assumes no relationships among the variables. The chi-square test of the baseline model was statistically significant: χ2 (378) = 13,611.73, p < 0.001. This result indicated a poor fit of the data to a model assuming no relationships among variables. In other words, it suggested that there were indeed significant relationships among the variables in our dataset, as the likelihood of the observed data giving a model of independence was near zero, p < 0.001.
The chi-square test of user model fit was significant: χ2 (329) = 526.77, p < 0.001. This was because the chi-square test is sensitive to sample size, and for a large sample, even minor discrepancies between the observed and model-implied covariance matrices can result in a significant chi-square value.
Other fit indices also supported the adequacy of the model: the CFI was 0.985, TLI was 0.983, RMSEA was 0.032, (90% confidence interval [90% CI] = 0.027, 0.037) and SRMR = 0.052. Results are presented in Table 643.
In summary, our model demonstrated good fit across the different fit indices, suggesting that the proposed factor structure adequately represents the relationships among the observed variables.
Parameter estimates
The standardized factor loadings were all significant, demonstrating that each item was significantly related to its respective factor. The loadings and covariance magnitudes, as well as the significance levels, can be found in the path diagram for the fitted CFA model in Fig. 1.
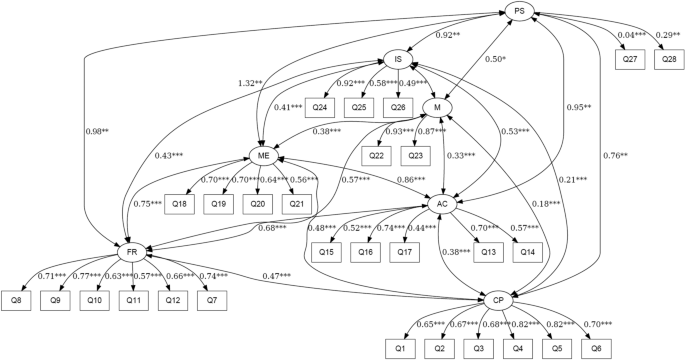
Path diagram of the confirmatory factor analysis model.
JHLES overall score
The distribution of JHLES overall scores for the group of individuals without missing data (N = 597) is shown in Fig. 2 (see Fig. 2 in the Appendices section). Visually, the distribution in the form of a histogram and density plot did not deviate from the normal distribution, as evidenced by the result of the Shapiro–Wilk test, W = 0.99, p = 0.067. The mean overall test score was 89.98 (13.75).
JHLES overall score versus year of study
The results of Welch’s ANOVA test showed a significantly higher total JHLES test score for the subjects of the first year of study, M = 97.21, SD = 13.78, compared to the other years of study, second year, M = 90.10 , SD = 13.33 , third year, M = 88.91, SD = 13.1, fourth year, M = 86.30, SD = 13.18, andfifth year, M = 87.76, SD = 12.91. The estimated effect was of moderate magnitude. No significant differences were found between the other groups. For a graphical visualization of the results, see Fig. 3 (see Fig. 3 in the Appendices section).
JHLES overall score versus gender
The results of Welch's t-test showed no significant differences between the total score of females, M = 89.81, SD = 13.67, and males, M = 90.61, SD = 14.06, p = 0.560. The effect obtained was of small size. For a graphical visualization of the results, see Fig. 4 (see Fig. 4 in the Appendices section).
JHLES overall score versus university
The results of Welch’s t-test showed that the total JHLES core in the Gdańsk University group, M = 87.9, SD = 13.69 was significantly lower than the total score in the Lublin group, M = 91.73, SD = 13.56, p < 0.001. The effect obtained was of small size (see Fig. 5 in the Appendices section).
JHLES overall score versus endorsement
The results of the Welch’s ANOVAtest showed a significantly higher total JHLES test score for the subjects with exceptional endorsement, M = 109.14, SD = 17.42, compared to the other endorsement levels, of good, M = 95.39, SD = 10.07, fair, M = 81.21, SD = 10.22, and poor, M = 68.07, SD = 11.50.
In addition, the score of the group with good endorsement was significantly higher compared to the groups with fair and poor endorsement. Conversely, the score of the fair group was significantly higher than that of the poor endorsement group. The estimated effect was of large magnitude.
For a graphical visualization of the results, see Fig. 6 (see Fig. 6 in the Appendices section).
JHLES overall score versus age
The results of the correlation analysis, rho = − 0.21, p = 0.001, showed a significant negative relationship between the JHLES total score and the age of the participants. The total score thus decreased significantly with increasing age.
Convergent validity
The convergent validity of the test can be measured by demonstrating a positive correlation between measures of related constructs. In other words, if two scales are related, a subject who scores high on one scale should also score high on the other. Pearson’s r (ranging between 1 and −1), is used to estimate correlation by revealing the strength and direction of the relationship between variables. Comparing the total results of JHLES and DREEM surveys, Pearson’s rho amounted to 0.797, (p < 0.001).
Discussion
The aim of this study was to develop the Polish-adapted version of the JHLES questionnaire. This was the first validation of this tool in Polish conditions as well as the first validation to be performed on such a large group of subjects. Validation was performed using the less common test–retest method and the CFA. Validity analysis also included corrected correlations for the original JHLES structure (item–total and item–subscale), following the recommendations established by Stuive et al44. A minimum threshold value of 0.20 was set for the absolute value of the corrected correlations in order to consider it to support construct validity45.
The validated questionnaire appears to presentgood internal reliability, as evidenced by its internal consistency and the test–retest consistency indicative of the temporal stability of the results. The overall reliability of the tool was good, near to excellent 0,896 Medium or good consistency (ICC) was demonstrated for individual items, with items 3, 17, 25 and 28 showing good consistency as assessed according to the newest and most restrictive ICC interpretation criteria46.
CFA facilitated the development of a model presenting good fitting metrics. Individual items were positively correlated with one another, with the best correlations observed between items within the same subscales. Our study featured the JHLES being used in the largest study group to date (N = 597) and the correlation between the average scores of all items of the JHLES forboth periods was very high (Pearson’s r = 0.790; p < 0.001). Factor analysis is among the most useful methods for studying and validating the internal structure of instruments47,48 and CFA specifically addresses the relationships between latent variables or factors and observed measures or indicators (e.g. test items). The chi-square testresults might indicate that the model does. Not fit well, but it is important to remember that this test is highly dependent on sample size. In this instance, the ‘relative chi-square’ (the chi-square statistic divided by its degrees of freedom) was 1.6. Thus, the relative chi-square was less than 5, and the outcome was deemed acceptable.
The fit indices also supported the adequacy of the model: the CFI was 0.985, TLI was 0.983, RMSEA was 0.032, (90% CI = 0.027, 0.037) and SRMR = 0.052, The requirements set by Hu and Bentler for an acceptable match (the CFI, TLI values above 0.95, RMSEA values below 0.06 and SRMR below 0.08) are thus met by our fit indices43. The results were consistent due to all indices being within acceptable ranges (close to 1 or 0 depending on the situation), which shows that the JHLES model is supported by the data43. The correlation coefficients between the JHLES and another tool based on a similar theoretical concept, namely the DREEM, was indicative of the relevance of the newly developed tool. Statistical analysis revealed a significant correlation. Coefficients between the total results of theJHLES and DREEM surveys (p < 0.001). The correlation was positive, i.e. higher total JHLES scores corresponding to higher total DREEM scores. Pearson’s rho amounted to 0.797 also indicating a very strong correlation25. This strong correlation coefficients between the DREEM and JHLES total scores suggesting that both questionnaires may measure the same overall concept—the learning environment.
Damiano et al also performed an adaptation of the JHLES and Medical School Learning Environment Scale (MSLES) questionnaires to obtain results with appropriate validity (in terms of content, internal structure, psychometric properties, and relation to other variables). The JHLES instrument has good reliability, with Cronbach α = 0.809. Stability was assessed using test–retest reliability via Pearson’s r and ICCs. The 45-day test–retest comparison resulted in Pearson’s r = 0.757 (p < 0.001) and a ’single measures ‘ ICC of 0.757 (p < 0.001). The MSLES global score showed a significant (p < 0.05) and positive correlation with the learning environment, both for school endorsement (r = 0.321), and overall learning environment perception (r = 0.505). Findings included good test–retest reliability and convergent validity, both of which were significantly correlated with each other, as well as with two questions on overall learning environment perception and school endorsement. The authors had validated the surveys using principal component analysis; the Brazilian version of the questionnaire contained significant differences as compared to the original, with only Factors 3 (Academic Climate), 5 (Physical Space), 6 (Inclusion and Safety), and 7 (Mentoring) maintaining the same structure as the original version. Despite the changes, all subdomains of the Brazilian JHLES and the original versions had similar Cronbach’s α coefficients for comparisons among both the original and the factor revised JHLES and its correlations with each JHLES subdomain21.
In a study by Tackett et al, the JHLES showed high internal reliability for the total JHLES score (α = 0.92) and the seven subdomains (α = 0.56–0.85). Each of its seven domains had values of Cronbach’s α within acceptable limits. Similar values were obtained in our study. According to Tackett et al., the corrected item-total correlations for the JHLES showed that all but two items had correlation coefficients above the acceptable level of 0.3023. In our study, individual items were positively correlated with one anotheraand the best correlations were observed between items within the same subscales.
Tackett et al. (2015) performed assessment of the DREEM and JHLES in Malaysian medical schools. Their result showed that the DREEM and JHLES scores were highly correlated with one another overall (r = 0.73), with stronger correlations at the Perdana University School of Medicine (r = 0.80) and Cyberjaya University College of Medical Sciences (r = 0.80) compared to Johns Hopkins University School of Medicine (r = 0.64). Our results showed a very strong correlation (r = 0.797). The very strong correlation between the DREEM and JHLES total scores suggests that both questionnaires may measure the same overall construct24. In our study, the values of Cronbach’s α for individual scales ranged between 0.554 and 0.901 (Table 7), which translated to good (Scales 1 and 2), acceptable (Scale 3 and 4), and excellent (Scale 5) reliability. The overall reliability of the tool was excellent. ICCs were also determined for reliability assessment. Medium or good consistency was demonstrated for individual items, with Items 17 and 28 showing good consistency as assessed according to the newest and most restrictive ICC interpretation criteria46. Our results showed that the correlation was positive, with higher total JHLES scores corresponding to higher total DREEM scores. Pearson’s r was 0.797, indicating a very strong correlation25.
Limitations
Our study was carried out in two of the ten medical universities in Poland, therefore careful consideration should be paid to the results obtained using the JHLES tool when attempting to generalize these results to other institutions. Furthermore, both the JHLES and DREEM questionnaires were completed on the same day, which might have resulted in the correlation between instruments being stronger than if they were completed at different times. The reason for the lower reliability of Subscale 7 is probably the lack of campus at the Medical University of Gdańsk. Polish students may not consider university buildings as a campus, as well as an important part of the learning environment.
Conclusions
Our study provided good evidence for the reliability and validity of the Polish version of the JHLES. In conclusion, the Polish-language version of the JHLES questionnaire is a reliable and valid instrument for analysing the learning environment for students, and its factor structure is supported by the data. The validated questionnaire is presented in Table 2. The use of standardized tools for the assessment of learning environments will lead to a better understanding of the local functioning of such environments and facilitate comparison of these environments with those in other countries. Improved functioning of educational environments in Poland is also to be expected.
In future studies, it will be possible to assess the factors causing differences in perception of the learning environment. It will become possible to assess the relationship between the learning environment and the professional development and clinical competencies of students of medical universities in Poland.
Data availability
The datasets generated and/or analysed during the current study are available in Mendeley Data https://doi.org/10.17632/36zpwkbny3.1
Abbreviations
- CFA:
-
Confirmatory factor analysis
- CFI:
-
Comparative fit index
- DREEM:
-
Dundee ready educational environment measure
- GFI:
-
Goodness of fit index
- ICC:
-
Intraclass correlation coefficients
- JHLES:
-
Johns Hopkins Learning Environment Scale
- MIs:
-
Modification indices
- PCA:
-
Principal component analysis
- RMSEA:
-
Root mean square eror of approximation
- SRMR:
-
Standardized root-mean-square residual
- N, n obs :
-
Sample size
- n :
-
Group size
- Mdn :
-
Median
- Q1 :
-
First quartile
- Q3 :
-
Third quartile
- M :
-
Mean
- SD :
-
Standard deviation
- p :
-
P-value of statistical test
- p Holm-adj :
-
P-value with Holm adjustment for multiple comparisons
- 90 % CI :
-
90% Confidence interval
- F Welch :
-
Welch’s ANOVA test statistic
- t Welch :
-
Student’s t-test statistic
- \({\widehat{g}}_{hedges}\) :
-
Hedges g effect size
- \({\widehat{w}}^{2}\) :
-
Omega-square effect size
- W :
-
Statistic of Shapiro–Wilk test
- χ2 :
-
Chi-square test statistic
- df :
-
Degrees of freedom
- rho :
-
The Spearman correlation coefficient
References
Sellberg, M., Palmgren, P. J. & Möller, R. A cross-sectional study of clinical learning environments across four undergraduate programs using the undergraduate clinical education environment measure. BMC Med. Educ. 21, 258 (2021).
Isba, R., Rousseva, C., Woolf, K. & Byrne-Davis, L. Development of a brief learning environment measure for use in healthcare professions education: The healthcare education micro learning environment measure (HEMLEM). BMC Med. Educ. 20, 1–9 (2020).
Hutchinson, L. Education environment. Bmj 326, 810–812 (2003).
Shochet, R. B., Colbert-Getz, J. M., Levine, R. B. & Wright, S. M. Gauging events that influence students’ perceptions of the medical school learning environment: Findings from one institution. Acad. Med. 88, 246–252 (2013).
Genn, J. AMEE medical education guide no. 23 (part 1): Curriculum, environment, climate, quality and change in medical education—A unifying perspective. Med. Teach. 23, 337–344 (2001).
Bonsaksen, T. et al. Associations between occupational therapy students’ academic performance and their study approaches and perceptions of the learning environment. BMC Med. Educ. 21, 1–8 (2021).
Aluri, V. L. & Fraser, B. J. Students’ perceptions of mathematics classroom learning environments: Measurement and associations with achievement. Learn. Environ. Res. 22, 409–426 (2019).
Bonem, E. M., Fedesco, H. N. & Zissimopoulos, A. N. What you do is less important than how you do it: The effects of learning environment on student outcomes. Learn. Environ. Res. 23, 27–44 (2020).
Thygesen, H. et al. Associations between learning environment variables and satisfaction with the education program among occupational therapy students. Ir. J. Occup. Ther. 48, 91–100 (2020).
Shrestha, E., Mehta, R. S., Mandal, G., Chaudhary, K. & Pradhan, N. Perception of the learning environment among the students in a nursing college in Eastern Nepal. BMC Med. Educ. 19, 1–7 (2019).
Shochet, R. B., Colbert-Getz, J. M. & Wright, S. M. The Johns Hopkins Learning Environment Scale: Measuring medical students’ perceptions of the processes supporting professional formation. Acad. Med. 90, 810–818 (2015).
Bloom, B. S. Stability and Change in Human Characteristics (Wiley, 1964).
Farajpour, A., Esnaashari, F. F., Hejazi, M. & Meshkat, M. Survey of midwifery students’ perception of the educational environment based on DREEM model at Islamic Azad University of Mashhad in the academic year 2014. Res. Dev. Med. Educ. 4, 41–45 (2014).
Rusticus, S. A., Pashootan, T. & Mah, A. What are the key elements of a positive learning environment? Perspectives from students and faculty. Learn. Environ. Res. 26, 161–175 (2023).
Rusticus, S. A., Wilson, D., Casiro, O. & Lovato, C. Evaluating the quality of health professions learning environments: Development and validation of the health education learning environment survey (HELES). Eval. Health Prof. 43, 162–168 (2020).
Schussler, E. E., Weatherton, M., Chen Musgrove, M. M., Brigati, J. R. & England, B. J. Student perceptions of instructor supportiveness: What characteristics make a difference?. CBE Life Sci. Educ. 20, 29 (2021).
McNeil, J. & Borg, M. Learning spaces and pedagogy: Towards the development of a shared understanding. Innov. Educ. Teach. Int. 55, 228–238 (2018).
Acton, R. Innovating lecturing: Spatial change and staff-student pedagogic relationships for learning. J. Learn. Spaces 7, 1–15 (2018).
Roff, S. et al. Development and validation of the dundee ready education environment measure (DREEM). Med. Teach. 19, 295–299 (1997).
Colbert-Getz, J. M., Kim, S., Goode, V. H., Shochet, R. B. & Wright, S. M. Assessing medical students’ and residents’ perceptions of the learning environment: Exploring validity evidence for the interpretation of scores from existing tools. Acad. Med. 89, 1687–1693 (2014).
Damiano, R. F. et al. Measuring students’ perceptions of the medical school learning environment: Translation, transcultural adaptation, and validation of 2 instruments to the Brazilian portuguese language. J. Med. Educ. Curric. Dev. 7, 238212052090218 (2020).
Zhou, Z. et al. Nomograms for predicting medical students’ perceptions of the learning environment: Multicenter evidence from medical schools in China. Front. Public Health 10, 825279 (2022).
Tackett, S. et al. Profiling medical school learning environments in Malaysia: A validation study of the Johns Hopkins Learning Environment Scale. J. Educ. Eval. Health Prof. 12, 39 (2015).
Tackett, S. et al. Learning environment assessments of a single curriculum being taught at two medical schools 10,000 miles apart. BMC Med. Educ. 15, 105 (2015).
Wójcik, D., Szalewski, L., Bęben, A., Ordyniec-Kwaśnica, I. & Roff, S. Validation of the Polish version of the DREEM questionnaire—A confirmatory factor analysis. BMC Med. Educ. 23, 1–13 (2023).
Tomás, I. et al. Psychometric validation of the Spanish version of the dundee ready education environment measure applied to dental students. Eur. J. Dent. Educ. 18, 162–169 (2014).
Taber, K. S. The use of cronbach’s alpha when developing and reporting research instruments in science education. Res. Sci. Educ. 48, 1273–1296 (2018).
Dimoliatis, I., Vasilaki, E., Anastassopoulos, P., Ioannidis, J. & Roff, S. Validation of the Greek Translation of the Dundee Ready Education Environment Measure (DREEM) 17
Little, R. J. A test of missing completely at random for multivariate data with missing values. J. Am. Stat. Assoc. 83, 1198–1202 (1988).
Cohen, J. Statistical Power Analysis for the Behavioral Sciences New York 54 (Academic, 1988).
Field, A. Discovering Statistics Using IBM SPSS Statistics (Sage, 2013).
Best, D. & Roberts, D. Algorithm AS 89: The upper tail probabilities of Spearman’s rho. J. R. Stat. Soc. Ser. C Appl. Stat. 24, 377–379 (1975).
Team RC. R: A Language and Environment for Statistical Computing. Supplemental Information References S.1 371–378 (2021)
Lishinski, A. lavaanPlot: Path Diagrams for’Lavaan’Models via’DiagrammeR’. Comprehensive R Archive Network (CRAN) (2021)
Rosseel, Y. lavaan: An R package for structural equation modeling. J. Stat. Soft. 48, 1–36 (2012).
Daniel, D. S., Whiting, K., Curry, M., Lavery, J. A. & Larmarange, J. Reproducible summary tables with the gtsummary package. R J. 13, 570–580 (2021).
Tierney, N. & Cook, D. Expanding tidy data principles to facilitate missing data exploration, visualization and assessment of imputations. J. Stat. Softw. 105, 1–31 (2023).
Wickham, H., Chang, W. & Wickham, M. H. Package ‘ggplot2’. Creat. Elegant Data Vis. Using Gramm. Gr. Vers. 2, 1–189 (2016).
Wickham, H. & Bryan, J. readxl: Read Excel Files. R Package Version 1.3. 1. (2019)
Wickham, H., François, R., Henry, L., Müller, K. dplyr: A Grammar of Data Manipulation. R Package Version 1.1.2. Computer software] https://CRAN.R-project.org/package=dplyr (2023).
Ben-Shachar, M., Lüdecke, D. & Makowski, D. effectsize: Estimation of effect size indices and standardized parameters. J. Open Sour. Softw. 5, 2815 (2020).
Revelle, W. psych: Procedures for Psychological, Psychometric, and Personality Research. Northwestern University, Evanston, Illinois R Package Version 229 (2021)
Hu, L. & Bentler, P. M. Cutoff criteria for fit indexes in covariance structure analysis: Conventional criteria versus new alternatives. Str. Equ. Model. A Multidiscip. J. 6, 1–55 (1999).
Stuive, I., Kiers, H. A., Timmerman, M. E. & ten Berge, J. M. The empirical verification of an assignment of items to subtests: The oblique multiple group method versus the confirmatory common factor method. Educ. Psychol. Meas. 68, 923–939 (2008).
Bowling, A. Research Methods in Health: Investigating Health and Health Services (McGraw-hill Education, 2014).
Bobak, C. A., Barr, P. J. & O’Malley, A. J. Estimation of an inter-rater intra-class correlation coefficient that overcomes common assumption violations in the assessment of health measurement scales. BMC Med. Res. Methodol. 18, 93 (2018).
Jöreskog, K. G. A general approach to confirmatory maximum likelihood factor analysis. ETS Res. Bull. Ser. 1967, 183–202 (1967).
Tavakol, M. & Wetzel, A. Factor analysis: A means for theory and instrument development in support of construct validity. Int. J. Med. Educ. 11, 245–247 (2020).
Funding
This research was funded in whole or in part by the National Science Centre, Poland 2021/05/X/HS6/01258. For the purpose of open access, the author has applied a CC-BY public copyright licence to any Author Accepted Manuscript (AAM) version arising from this submission.
Author information
Authors and Affiliations
Contributions
D.W. and L.S. Conceptualization, Resources, Writing-original draft, Visualization, Investigation, D.W, L.S, R.S. Methodology, Writing-review & editing D.W., L.S, A.B., I.O.K. Investigation D.W.: Formal analysis, Supervision, Project administration, Funding acquisition, All authors reviewed the manuscript.
Corresponding author
Ethics declarations
Competing interests
The authors declare no competing interests.
Additional information
Publisher's note
Springer Nature remains neutral with regard to jurisdictional claims in published maps and institutional affiliations.
Supplementary Information
Rights and permissions
Open Access This article is licensed under a Creative Commons Attribution 4.0 International License, which permits use, sharing, adaptation, distribution and reproduction in any medium or format, as long as you give appropriate credit to the original author(s) and the source, provide a link to the Creative Commons licence, and indicate if changes were made. The images or other third party material in this article are included in the article's Creative Commons licence, unless indicated otherwise in a credit line to the material. If material is not included in the article's Creative Commons licence and your intended use is not permitted by statutory regulation or exceeds the permitted use, you will need to obtain permission directly from the copyright holder. To view a copy of this licence, visit http://creativecommons.org/licenses/by/4.0/.
About this article

Cite this article
Wójcik, D., Szalewski, L., Bęben, A. et al. Validation of the Polish version of the Johns Hopkins Learning Environment Scale–a confirmatory factor analysis. Sci Rep 14, 10843 (2024). https://doi.org/10.1038/s41598-024-61391-x
Received:
Accepted:
Published:
DOI: https://doi.org/10.1038/s41598-024-61391-x
Keywords
Comments
By submitting a comment you agree to abide by our Terms and Community Guidelines. If you find something abusive or that does not comply with our terms or guidelines please flag it as inappropriate.
