
Abstract
Hypertension affects more than one billion people worldwide. Here we identify 113 novel loci, reporting a total of 2,103 independent genetic signals (P < 5 × 10⁻⁸) from the largest single-stage blood pressure (BP) genome-wide association study to date (n = 1,028,980 European individuals). These associations explain more than 60% of single nucleotide polymorphism-based BP heritability. Comparing top versus bottom deciles of polygenic risk scores (PRSs) reveals clinically meaningful differences in BP (16.9 mmHg systolic BP, 95% CI, 15.5–18.2 mmHg, P = 2.22 × 10−126) and more than a sevenfold higher odds of hypertension risk (odds ratio, 7.33; 95% CI, 5.54–9.70; P = 4.13 × 10−44) in an independent dataset. Adding PRS into hypertension-prediction models increased the area under the receiver operating characteristic curve (AUROC) from 0.791 (95% CI, 0.781–0.801) to 0.826 (95% CI, 0.817–0.836, ∆AUROC, 0.035, P = 1.98 × 10⁻³⁴). We compare the 2,103 loci results in non-European ancestries and show significant PRS associations in a large African-American sample. Secondary analyses implicate 500 genes previously unreported for BP. Our study highlights the role of increasingly large genomic studies for precision health research.
Main
Over 30% of adults worldwide have hypertension, which is a leading modifiable risk factor for cardiovascular disease and death1,2,3. Hypertension is defined by elevated levels of systolic BP (SBP) and/or diastolic BP (DBP). SBP, the maximal arterial pressure exerted as the heart is beating, continuously increases with older age, whereas DBP, the arterial pressure between heartbeats, gradually plateaus by mid-life. Pulse pressure (PP), defined as the difference between SBP and DBP, is an indicator of arterial stiffness. BP is highly heritable, and multiple genome-wide association studies (GWAS) have highlighted its complex, polygenic architecture4,5,6,7,8,9.
Two recent large-scale GWAS meta-analyses with over 750,000 participants of European descent4,5, incorporating available data from biobanks and consortia such as the UK Biobank (UKB), the International Consortium for Blood Pressure (ICBP) and the Million Veteran Program (MVP), identified more than 1,000 independent loci associated with BP. Results from these studies have been applied to fine-mapping and candidate gene prioritization follow-up studies to further investigate the underlying BP biology10,11,12. Experience from prior BP-GWAS reveals that an increase in sample size can result in an enriched catalog of BP-associated genetic loci as well as an increase in the proportion of inter-individual variation in BP explained by the lead variants.
In this study, we conducted a single-stage GWAS meta-analysis combining all available genetic data from the UKB, ICBP and MVP from the previous two papers, using their existing GWAS summary statistics data together with new data (n ~ 50,000) from Vanderbilt University’s biorepository of DNA linked to de-identified medical records (BioVU)13. We accumulated data from over one million individuals of European descent, the largest sample size to date in a single-stage GWAS for BP. The analysis was performed using ~7.5 million imputed single nucleotide polymorphisms (SNPs) with a minor allele frequency (MAF) > 1% as the contributing GWAS data focused on common variants.
Our goals were to identify novel BP variants, reveal new biology underlying BP and generate a new BP PRS. Herein, we report the discovery of 113 novel loci for BP traits. The large sample size and current statistical methods increased the SNP-based heritability (\({h}_{{\rm{SNP}}}^{2}\)) of BP traits explained by GWAS variants to >60%. We developed genome-wide BP PRSs and tested these for the prediction of BP traits and hypertension risk in two independent datasets of European and African-American ancestry individuals.
We also applied methods that leverage the statistical precision of the GWAS and independent reference data from cardiovascular tissues to infer relationships between BP traits and gene expression, and we observed evidence of association with BP biology of 500 previously unreported genes. Many of these genes are located in previously mapped regions of the genome but were not identified by nearest-gene annotations in the literature, allowing the scientific yield from BP genetic studies to advance from lists of loci to lists of genes. These analyses provide insights into both the extent to which regulatory effects mediate genetic associations with BP traits as well as a principled data-driven mapping of associated loci with linked biology. This knowledge can be used to identify potential drug targets, develop testable hypotheses in model systems and advance understanding of BP regulation at the level of tissues and systems.
Results
Within our one-stage meta-analysis study of 7,584,058 SNPs in up to 1,028,980 individuals, there are a total of 1,495, 1,504 and 1,318 significant loci (P < 5 × 10⁻⁸) from the GWAS of SBP, DBP and PP, respectively (linkage disequilibrium (LD) r2 < 0.1 and 1 Mb distance; Extended Data Fig. 1). After excluding all known loci and their correlated variants in LD (LD r2 > 0.1 at ±500 kb) and applying clumping and LD-pruning methods to the remaining SNPs to identify independent loci ≥1 Mb apart and not in strong LD (r2 < 0.1), we detected sentinel SNPs indexing 113 novel loci for robust signficant association with at least one of the three continuous BP traits: (1) achieving genome-wide significance (P < 5 × 10⁻⁸) (Fig. 1 and Tables 1–3); (2) with consistent direction of effect in all available studies (Supplementary Table 1); and (3) no evidence of heterogeneity across studies (Tables 1–3 and Supplementary Figs. 1 and 2). Of these 113 novel loci, 35 reached a more stringent one-stage significance threshold of P < 5 × 10⁻⁹. Of all 113 novel loci (Supplementary Fig. 3), 40, 42 and 31 sentinel SNPs were significantly associated with SBP, DBP and PP, respectively, as the most significant trait with consistent effect direction. As in prior studies, the newly discovered loci had smaller effect sizes than previously reported SNPs, owing to the larger sample size and increased power to detect common variants with smaller effect sizes (Extended Data Fig. 2).
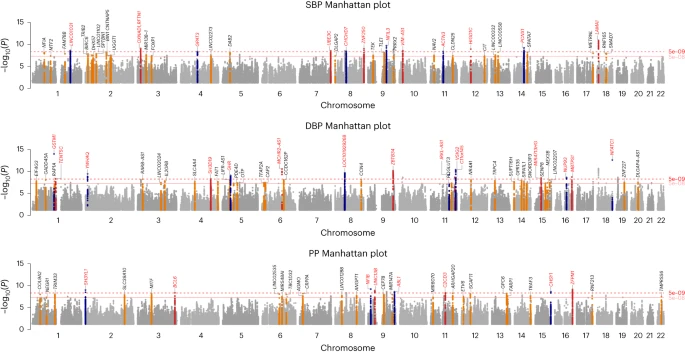
Manhattan plots from top to bottom show novel results of SBP, DBP and PP GWAS meta-analysis, respectively, using inverse variance-weighted method. All loci are reported at genome-wide significance threshold (5 × 10⁻⁸). Annotated in red are loci reaching the more stringent P value of 5 × 10⁻⁹.
LD score regression intercepts
In our overall meta-analyses, genomic inflation factors (λGC) were calculated and λGC values were 1.82, 1.76 and 1.70 for SBP, DBP and PP, respectively. We calculated the LD score regression (LDSR) intercepts in our overall GWAS meta-analysis data as well as in the GWAS data remaining after the exclusion of all known BP loci to evaluate whether inflation of our test statistics was a result of polygenicity or residual population substructure (Supplementary Table 2). Attenuation ratios14 in overall analyses were 0.0884, 0.0844 and 0.0794, while attenuation ratios in the novel partition of our results were 0.0996, 0.0722 and 0.1085 for SBP, DBP and PP, respectively. LDSR intercepts in overall analyses were 1.2254, 1.2037 and 1.1756, while intercepts in the novel partition of our results were 1.0931, 1.0624 and 1.0806 for SBP, DBP and PP, respectively. These LDSR intercepts and attenuation ratios suggest that any observed inflation in our data is caused primarily by polygenicity.
Known loci
Using our data to assign all 3,800 SNPs previously reported for BP traits into loci resulted in the identification of 1,165 independent loci that were ≥1 Mb apart and not in strong LD (r2 < 0.1) with each other or with known BP loci (Supplementary Table 3). LD pruning resulted in 1,723 pairwise-independent genetic signals from known SNPs (Supplementary Table 4).
As many of these known SNPs were previously identified using data contained within our meta-analysis, we did not seek to provide any replication of these published SNPs, but we did use the opportunity provided by our large-scale meta-analysis to present up-to-date and accurate results for the significance and effect estimates of the BP associations of all these SNPs (Supplementary Tables 4–6). Considering the sentinel SNPs of the 1,165 independent known loci, 1,092 of these were covered in our GWAS data, and 963 (88%) of these exact SNPs or close proxies (r2 > 0.8 and <500 kb) reached genome-wide significance in our data and 1,017 (93%) reached genome-wide significance at the locus level (Supplementary Tables 3 and 6), with less significant SNPs corresponding to associations originally reported from analyses of non-European ancestry, exome-chip studies or non-standard analyses that are not main-effect BP-GWAS analyses. Of 298 previously reported SNPs unavailable in our data, 227 (76%) were identified in rare-variant, non-European ancestry and/or in gene–environment interaction analyses. MAF and effect sizes of previously reported SNPs in our meta-analyses are concordant with published results (Supplementary Figs. 4 and 5).
Conditional analysis
Genome-wide conditional analysis of SBP, DBP and PP meta-analyses identified a total of 267 additional independent significant secondary SNPs reaching a significance threshold of P < 5 × 10⁻⁸ in the conditional joint model (Supplementary Table 7). Of the 267 SNPs, 203 secondary SNPs also reached P < 5 × 10⁻⁸ in our primary meta-analyses and 23 mapped to one of our 113 novel BP loci.
GWAS results summary
In summary, we report 1,723 pairwise-independent genetic signals among SNPs previously published for BP, 113 genome-wide significant novel loci from our meta-analyses and 267 additional independent significant secondary SNPs from conditional analysis, yielding a total of 2,103 independent genetic signals across all three BP traits.
Variance explained
Within the independent sample of 10,210 Lifelines participants (who were not included in the discovery GWAS), the genetic risk score (GRS) of our 113 novel loci explained a small but statistically significant proportion of BP variance: 0.06%, 0.08% and 0.02% for SBP, DBP and PP, respectively. Our findings contributed a small gain in the percentage of variance explained (%VE) for SBP, DBP and PP. For example, for SBP, the %VE by GRS increased from 6.77% for the 1,723 previously published SNPs to 6.80% after adding the 113 novel sentinel SNPs, and to 6.93% for all 2,103 independent BP genetic signals after also adding 267 independent secondary SNPs (Table 4). Furthermore, we first constructed a benchmark PRS based on the standard clumping and thresholding procedure for each BP trait (P value threshold, 1 × 10⁻³, 0.01 and 0.01 for SBP, DBP and PP, respectively). These PRSs captured a total of 7.17%, 7.83% and 4.53% of the variance in SBP, DBP and PP, respectively (Extended Data Fig. 3). Second, we calculated BP PRSs using SBayesRC15, which integrates GWAS data with functional genomic annotations and has been shown to have better prediction accuracy than other state-of-the-art PRS methods. We observed striking improvements in the percentages of variance explained by the SBayesRC PRS to 11.37%, 12.12% and 7.30% for SBP, DBP and PP, respectively (Table 4). The SBayesRC PRSs were used in all further PRS analyses in the Lifelines (European ancestry) and All-Of-Us (African ancestry) databases.
Analyses of PRS in Lifelines
The SBayesRC PRSs showed sex-adjusted differences between top and bottom deciles of the PRS distribution of 16.9 mmHg for SBP (95% CI, 15.5–18.2 mmHg, P = 2.22 × 10−126), 10.3 mmHg for DBP (95% CI, 9.5–11.1 mmHg, P = 2.96 × 10−130) and 10.0 mmHg for PP (95% CI, 9.1–11.0 mmHg, P = 3.11 × 10−94) in 10,210 Lifelines participants. In addition, we observed more than a sevenfold higher sex-adjusted odds of hypertension (odds ratio (OR), 7.33, 95% CI, 5.54–9.70, P = 4.13 × 10−44) between the top and bottom deciles of the SBayesRC PRS in Lifelines when modeling both the SBP and DBP PRSs (Fig. 2, Extended Data Fig. 4 and Supplementary Table 8a). Alternatively, compared with middle deciles of the PRS distribution, individuals in the top decile had on average 8.82 mmHg higher SBP, 5.13 mmHg higher DBP, 5.64 mmHg higher PP and over twofold higher odds of hypertension (OR, 2.48) (Supplementary Table 8b).

a,b, Plots show sex-adjusted SBP and DBP (a) and sex-adjusted odds ratios of hypertension (b) comparing each of the upper nine PRS deciles with the lowest decile. Dotted lines represent mean; error bars, s.e.m. in a and 95% CI in b.
Hypertension model performance and calibration in Lifelines
The area under the receiver operating characteristic curve (AUROC) for model 1, which included only covariates, was 0.791 (95% CI, 0.781–0.801) and increased to 0.826 (95% CI, 0.817–0.836) for model 2, which included covariates as well as the SBP and DBP SBayesRC PRSs, a small but statistically significant difference of 0.035 (P = 1.98 × 10⁻³⁴; Extended Data Fig. 5 and Supplementary Table 9a). Brier scores for model 1 (0.14) and model 2 (0.13) indicate that our models were reasonably well-calibrated. The Youden indices for model 1 and model 2 were 1.43 and 1.51, respectively, and correspond to the 58th and 60th percentile of the total sample. Hypertension prevalence in Lifelines was 23.6%. Addition of PRSs improved classification for a net of 4.72% of individuals (n = 114) with hypertension and 3.26% of individuals (n = 254) without hypertension (net reclassification index (NRI), 0.080, 95% CI, 0.063–0.097, P = 7.9 × 10⁻²²; Supplementary Table 9b).
Heritability in Lifelines
The GCTA-GREML16 SNP-based heritability (h2SNP) estimates in Lifelines data (n = 10,210) were 17.4%, 18.8% and 16.1% for SBP, DBP and PP, respectively. These GCTA-GREML16 h2SNP estimates were used in the denominator of %VE / h2SNP calculations, as both %VE and h2SNP were derived from the same dataset. Hence, the total proportions of common SNP heritability that our GWAS explained, either for all 2,103 independent BP genetic signals combined or for the full clumping and thresholding PRSs capturing all genome-wide common SNP variation, were 39.8% (6.93% out of 17.4%) and 41.2% (7.17% out of 17.4%), respectively, for SBP, 36.8% (6.92% out of 18.8%) and 41.6% (7.83% out of 18.8%), respectively, for DBP and 27.8% (4.47% out of 16.1%) and 28.1% (4.53% out of 16.1%), respectively, for PP. Our improved PRSs using SBayesRC explained 65.4% (11.37% out of 17.4%), 64.5% (12.12% out of 18.8%) and 45.3% (7.30% out of 16.1%) of the common SNP heritability for SBP, DBP and PP, respectively.
Association of BP variants in non-European ancestries
When comparing the distributions of allele frequency and effect sizes for the 2,103 independent BP-associated SNPs reported from our European meta-analysis within other ancestries, there was greater concordance within the Japanese population (Japan Biobank (JBB); n = 145,000, r = 0.69 and 0.5 correlation of effects, with 79% and 70% concordance in effect direction for known and novel SNPs, respectively) than within an African-ancestry meta-analysis sample (n = 83,890, r = 0.22 and 0.45 correlation, with 65% and 66% concordance for known and novel SNPs) (Extended Data Figs. 6 and 7 and Supplementary Table 10). Our novel loci showed weaker concordance than known loci for the Japanese comparisons but higher correlation than known loci for the African comparisons.
PRS analyses in African-American ancestry
The SBayesRC PRS generated from our European meta-analysis is also associated with higher BP in an African-American ancestry sample (n = 21,843) from the All-Of-Us cohort: for example, with sex-adjusted differences between top and bottom deciles of the PRS distribution of 10.6 mmHg for SBP (95% CI, 9.4–11.8 mmHg, P = 1.20 × 10−71) and increased sex-adjusted odds of hypertension (OR, 1.73, 95% CI, 1.5–2.0, P = 2.33 × 10⁻¹³) (Fig. 3, Extended Data Fig. 8 and Supplementary Table 11). We observe a significant (P = 1.16 × 10⁻⁵) incremental increase in the AUROC from the covariate-only model (0.671; 95% CI, 0.666–0.680) to the model also including the PRS (0.676; 95% CI, 0.670–0.685) (Supplementary Table 12 and Supplementary Fig. 6). Of note, hypertension prevalence of 37% in the African-American subset of All-Of-Us is higher than in the European Lifelines cohort (Supplementary Table 13). The addition of the PRSs led to a non-significant reclassification result (NRI, 0.01, 95% CI, 0.006–0.021, P = 7.6 × 10⁻²), with only slight improvements in classification for a net of 0.22% of individuals (n = 49) with hypertension and 0.51% of individuals (n = 111) without hypertension (Supplementary Table 14).

a,b, Plots show sex-adjusted mean SBP and DBP (a) and sex-adjusted odds ratios of hypertension (b) comparing each of the upper nine PRS deciles with the lowest decile. Dotted lines represent mean; error bars, s.e.m. in a and 95% CI in b.
Variant functions of novel loci
More than 90% of the novel sentinel SNPs lie within non-coding regions (Supplementary Table 15). One novel sentinel SNP (rs855791) and seven highly correlated SNPs (r2 > 0.8) are non-synonymous variants in genes at six novel loci: TMPRSS6, GLRX2, RLF, HELQ, ZNF235 and UNC13B; three of these non-synonymous SNPs reside in UNC13B (Supplementary Table 16).
Overlap of novel loci across BP traits and with other traits
Across all 113 novel loci, we see concordance in the associations across the three BP traits (Supplementary Figs. 7 and 8), especially between SBP and DBP and between SBP and PP, which are known to be the more highly correlated BP trait pairs, so this is consistent with previous observations4,5,7. The Pearson correlation values for comparison of the effect estimates across all 113 novel loci are r = 0.82 for SBP vs DBP; r = 0.83 for SBP vs PP; and r = 0.37 for DBP vs PP. Nine of the 113 novel loci are genome-wide significant for a second BP trait in addition to their primary associated trait (as indicated in Tables 1–3).
Shared associations with at least one other disease trait reported within the GWAS Catalog or PhenoScanner database were observed for 41 out of the 113 novel loci; that is, sentinel SNPs and all SNPs in high LD (r2 > 0.8).
The novel locus with the most shared associations was MCHR2-AS1, which has significant associations with seven disease or trait categories: anthropometric, reproductive, lipids, thyroid, cardiovascular, neurological and metabolic. Other loci showed associations with hematological traits (for example, hemoglobin, red blood cell count, white blood cell count, and so on), immune system (for example, inflammation, allergy, autoimmune, and so on), respiratory traits (for example, vital capacity, expiratory volume, expiratory flow, and so on) and minerals (for example, iron metabolism) (Extended Data Fig. 9 and Supplementary Table 17).
Inferred gene expression and colocalization analysis
Applying S-PrediXcan analysis to infer the effects of genetically predicted gene expression on BP traits, we identified 5,538 statistically significant gene–tissue combinations that are genetically predictive of BP traits (Supplementary Table 18 and Supplementary Fig. 9). These combinations correspond to 1,873 unique genes, of which 569 (30%) have been identified by nearest-gene mapping of previously reported BP SNPs or novel sentinel SNPs identified in our meta-analyses. A total of 468 (25%) unique genes were previously identified in the equivalent S-PrediXcan and colocalization analyses4. We identified 1,029 (55%) unique genes in this analysis that have not previously been reported in BP-GWAS (Supplementary Table 18). The majority of associations were observed in arterial tissues (n = 1,503 for tibial artery; n = 1,205 for aorta). Associations were evenly distributed across all three BP traits (n = 1,851 for SBP; n = 1,962 for DBP; n = 1,725 for PP).
Additionally, we used COLOC to identify the subset of significant genes for which there was a high posterior probability that a SNP in the S-PrediXcan model for each gene exhibited colocalized association with both gene expression and changes in quantitative measures of BP traits. This analysis refined our S-PrediXcan analysis by characterizing the contribution of underlying expression quantitative trait loci (eQTLs) within our gene models to the observed S-PrediXcan associations. We detected 2,793 gene–tissue pairs in which there was a statistically significant S-PrediXcan association with at least one BP trait and high posterior probability (PP.H4 > 0.9) of colocalization, corresponding to a total of 1,070 distinct genes (642, 431 and 647 genes for SBP, DBP and PP, respectively). Of these 1,070 genes, 500 (47%) have not been previously annotated for SNP associations with BP traits.
Druggable targets from transcriptome-wide association studies and colocalization results
We collated evidence for genes that mapped to our novel sentinel SNPs or mapped to our secondary SNPs but did not map from our primary GWAS or previous GWAS. We then found the intersection with genes that were significant in our inferred gene expression analyses and highlighted noteworthy examples (Table 5). We identified 38 genes satisfying this criterion, including an established drug target for BP medications (ADRA1A) and five genes targeted by other approved drugs (Supplementary Table 19).
Pathway analyses
We input all 1,070 significant genes from S-PrediXcan and colocalization analyses into downstream enrichment analyses using FUMA17 (Supplementary Figs. 10–13 and Supplementary Tables 20–23). Results for tissue specificity were similar across all BP traits, with high enrichment in cardiovascular tissues (heart, arterial and whole blood), as expected, and in brain tissues of the central nervous system, given that hypertension associates with sympathetic nervous system activity. Enrichment in liver and pancreas tissues may be representative of the broader pleiotropy of BP genes and cardiometabolic diseases. The pathway analyses reveal a total of 4,617 unique significant terms (adjusted P < 0.05) across 20 different databases of functional annotations, boasting the complex biology of BP regulation. Some newly identified gene ontology annotations, not overlapping with pathway analysis results from previous BP studies, which are robustly reported across all BP trait input genes, include endoplasmic reticulum stress, carbohydrate and/or lipid metabolism, cell polarity, response to UV, DNA damage, autophagy, apoptotic mitochondrial envelop changes and (metal) ion transport.
Discussion
In the largest single-stage common-variant GWAS of BP to date including more than one million European-ancestry adults, we report >2,000 independent BP signals from known and 113 novel loci as well as new secondary signals. The richness of results permitted the creation of PRSs that captured substantial interindividual variation in BP traits. These full PRSs are publicly accessible and can be used by the global research community to explore the contributions of BP to a variety of health outcomes.
This GWAS provides additional insights into the genetic contribution of BP and suggests that expansions of statistical power will continue to yield the discovery of additional loci primarily harboring common variants with smaller effect sizes, as has been recently achieved from GWAS of height18.
Our results demonstrate that the biology of BP is highly complex and polygenic, influenced by thousands of SNPs with extremely subtle effect sizes. In aggregate, these associations explain large differences in average BP and have a very strong influence on the risk of hypertension. Understanding the heritable influences on BP has the potential to provide foreknowledge of severe hypertension and its sequelae19,20. This study is, therefore, another key step toward understanding one of the most complex and highly regulated biological systems in humans that has significant implications for health, disease treatment and prevention.
We used a novel Bayesian method that fits genome-wide SNPs as random effects with a multi-component functionally informed prior for the PRS calculation15. These SBayesRC PRSs showed striking improvements in %VE for the different BP traits compared to the standard clumping and thresholding method, which includes only a subset of SNPs with ascertainment. For example, the SBayesRC PRS for SBP explained 65.4% of its common SNP-based heritability. This is more than double the 26.8% of the SBP h2SNP explained and previously reported5. The remarkable improvement in the variance explained for all BP traits suggests a complex genetic architecture with common causal variants enriched in functionally important genomic regions. Even though we demonstrate that a large proportion of the genetic variance in BP is discoverable by GWAS, another gap remains between the common-variant-based heritability and the total pedigree-based h2 estimates that were recently reported to range from 25–30% for SBP, DBP and PP21. This gap is probably attributable to rare variants, as has been reported recently for height and body mass index (BMI) on the basis of whole genome sequencing data22. Rare variants associated with BP have been recently reported from separate large-scale exome-chip analyses23.
Application of the SBayesRC PRS in an external independent study (Lifelines), comparing top versus bottom deciles of the PRS distribution, demonstrated large BP differences; for example, 16.9 mmHg for SBP and 7.3-fold increased odds of hypertension. AUROC analyses indicated significant improvement in discrimination and calibration with the PRS included in the predictive model for hypertension. The observed negative predictive value of 91.6% for the full model Youden index cut-off demonstrates accurate discrimination of false negatives, an important goal in the classification of hypertension susceptibility. The improved performance of our PRS may allow for the identification of causal contributions of BP for many hypertension-related diseases. Furthermore, we found that the addition of the PRS to the model significantly improved the classification of hypertension. Nonetheless, the clinical utility of even our improved PRS will remain limited, given the uncertainty in individual PRS estimation for complex traits including hypertension as shown in a recent publication24.
In addition to mapping genomic locations, our pathway analyses also demonstrate the complexity of BP biology from the vast number of biological pathways enriched by BP genes. Furthermore, we show that many loci are associated with BP traits through regulatory effects on gene expression. We identified significant colocalized associations between BP traits and genetically predicted gene expression of 1,070 genes, 500 of which have not been identified in prior BP-GWAS. Of these 500 genes, 314 remain novel, at the time of submission, after updated searches within the GWAS Catalog and cross-referencing with a recently published list of prioritized BP genes from a post-GWAS candidate gene prioritization study10.
These new gene observations can provide opportunities for further experimentation in model systems and elucidate candidate targets for drug development or repurposing.
Among novel loci, TMPRSS6 (rs855791; PP P = 3.20 × 10⁻⁸) is a promising candidate as a potential drug target. This gene, encoding transmembrane serine protease 6, has been implicated in the attenuation of dietary iron overload in heart tissue leading to cardioprotective effects25,26. Genetic variation at TMPRSS6 is also associated with biomarkers of iron overload27. SMAD7 (rs72917789; SBP P = 1.14 × 10⁻⁸) has been shown to modulate the expression of hepcidin, a key regulator of intestinal iron absorption28,29. Additionally, GSTM1 (rs36209093; DBP P = 9.94 × 10⁻¹⁵), encoding glutathione S-transferase Mu 1, has been implicated in cardiomyopathy resulting from iron overload30,31. These results suggest that altered iron metabolism may have a role in BP regulation and hypertension-related cardiovascular disease and are consistent with previous studies linking high iron stores to cardiovascular disease32.
Evaluation of the intersection of inferred gene expression and colocalization results with novel and secondary loci highlights several genes targeted by approved medications or with compelling biological evidence supporting their role in BP physiology. ADRA1A, encoding the α−1-adrenergic receptor 1A, the product of which is a well-known target for medications treating both hypertension and hypotension33, was previously unreported in BP-GWAS. Considering our conditional analysis and inferred gene expression associations at this locus, cis-regulatory variants for ADRA1 may affect the efficacy of targeted medications. ABCC8, an established diabetes GWAS locus34, the product of which is targeted by sulfonylurea medications35,36, harbors rare variants contributing to pulmonary arterial hypertension37,38,39. FGFR2, targeted by anti-angiogenesis medications in the treatment of cancer40, is involved in sexual dimorphism of the baroreflex afferent function on BP regulation in rats41 and has been implicated in parenchymal and vascular remodeling in pulmonary arterial hypertension42. These findings are biologically plausible, and the ADRA1A receptor protein is targeted to manipulate BP, demonstrating that our approach detects genes with biological and pharmacological impact. This suggests that additional genes from our analysis may be viable options for drug targeting and further study.
This study has several limitations. Owing to the large sample size, independent study samples to replicate our findings in a more traditional two-stage design are not readily available, so it is not possible to report loci with formal validation as has been done for previous two-stage BP-GWAS analyses. We have attempted to address this limitation by implementing robust reporting criteria appropriate for a single-stage discovery analysis, with rigorous post-quality-control (QC) filtering of the meta-analysis data, requiring full concordance in the direction of novel SNP effects across all four datasets in the meta-analysis in addition to no evidence of heterogeneity across these four datasets, and highlighting SNP results that meet a higher 5 × 10⁻⁹ significance threshold. Owing to the available GWAS datasets, our study is restricted to the analysis of common variants only with MAF > 1%, but it is important for future analyses to consider both common and rare variants, especially now with sample sizes exceeding one million individuals.
Although our discovery GWAS was limited to non-Hispanic white participants, we provide plots to illustrate the concordance of the effects of BP variants in Japanese and African individuals. As the levels of correlation vary between the comparisons with Japanese versus African ancestries and between novel versus known loci, it highlights the importance of further testing of BP variants derived from European studies within different non-European populations in the future, to clarify which genetic signals are shared and which may have ancestry-specific effects43.
We do show a significant association of our European-derived PRS with BP and hypertension in an African-American sample. However, the nominal increases in AUROC or NRI statistics when adding the PRS into hypertension-prediction models in African-American individuals shows that substantial studies that include individuals of non-European ancestry, or alternative methodological approaches44, are essential to understand ancestrally related disparities in hypertension, observations that mirror those for other complex traits45,46.
Our study results suggest that efforts should continue for future BP-GWAS to leverage large-scale biobank resources and cohort studies to expand the sample size further, as well as extending to diverse ancestries. The benefits of this approach may include improved homogeneity of associations if the data are collected under uniform conditions, as in the UKB47. Our data also show high concordance in GWAS results between studies of different designs (Supplementary Fig. 14), supporting a continuing role for the inclusion of large electronic health record (EHR)-derived studies within meta-analysis projects. Future studies should also continue to evaluate associations with genetically predicted gene expression to stimulate other avenues of investigation. These goals, if accomplished, will provide researchers with translational knowledge to mitigate disparities and reduce the global impact of health outcomes for which hypertension is a highly common risk factor.
Methods
We conducted a single-stage BP-GWAS meta-analysis of individuals of European ancestry, evaluating common SNPs, as the GWAS summary statistics data used had already previously been filtered to MAF ≥ 1%. SBP, DBP and PP GWAS summary statistics from each study were obtained from linear regression models analyzing SNP associations adjusted for age at BP measurement, age2, sex, BMI and the top ten genetic principal components. Inferences were limited to SNPs with imputation quality (INFO) scores of 0.1 or higher, Hardy–Weinberg equilibrium P values of ≥1 × 10⁻⁶ and MAF ≥ 1%. PP was calculated in each study as the difference between SBP and DBP.
Study populations
The total sample size for this investigation was up to 1,028,980 adults from the meta-analysis of four existing BP-GWAS datasets: UKB, ICBP, MVP and BioVU. Characteristics of these studies are presented in Supplementary Table 24. We acknowledge the different demographics of MVP, being predominantly male (only 7.1% female compared to 58.4% and 54.2% for BioVU and UKB, respectively), and note the higher proportion of individuals taking anti-hypertensive medication (48.9% and 59.5% for MVP and BioVU, respectively, compared to only 20.6% for UKB) probably because the data were drawn from EHR data within a clinical environment. ICBP is a large meta-analysis of 77 studies; therefore, descriptive characteristics were not available. More detailed information on study populations is provided in the Supplementary Notes.
Study-level QC
We applied a harmonized QC procedure for each BP trait in all four studies (that is, 12 GWAS datasets in total) using the GWASInspector R package48. The 1000 Genomes Project reference panel49, supplemented with the Haplotype Reference Consortium data panel50,51,52,53, was used as the reference dataset for appropriate flipping and/or switching of the alleles, checking for allele frequency concordance with the 1000 Genomes reference, annotating dbSNP rs accession numbers and constructing harmonized identifiers for meta-analyses. Allele frequency differences between the reference and individual GWAS data were not used for filtering the variants unless an unexplained off-diagonal cross line could be distinguished in the correlation scatterplot. In this case, we used a difference of 0.25 between the reference and individual GWAS data as the cut-off to filter out variants with seemingly flipped alleles. This was the case for only a very small number of variants within the MVP cohort, requiring the removal of about 12,000 SNPs (<0.15% of the data). SNP effect sizes from ICBP were considered as the reference to validate the reported effect sizes from the other three GWAS datasets (Supplementary Figs. 15–17)7,54.
The following criteria were then used for filtering the GWAS datasets: (1) SNPs only (that is, no insertions or deletions, copy number variants, and so forth); (2) MAF ≥ 1%; (3) INFO scores greater than 0.1; (4) Hardy–Weinberg equilibrium P ≥ 1 × 10⁻⁶. Effective sample size was calculated as the product of the total sample size and INFO for each SNP.
Meta-analysis
We initially applied LDSR14 to the summary statistics for three of our four component datasets (UKB, MVP and BioVU) to calculate the LDSR intercepts that were used to correct for pre-meta-analysis genomic inflation. ICBP summary statistics, as a meta-analysis of 77 independent cohorts, were previously corrected for genomic inflation5. HapMap3 (ref. 55) SNP alleles and pre-calculated LD scores from 1000 Genomes Project49 European reference data supplied with the package were used to calculate LDSR intercepts. Observed LDSR intercepts for SBP, DBP and PP, respectively were as follows for each dataset: 1.2177, 1.2195 and 1.1851 for UKB; 1.0530, 1.0247 and 1.0413 for MVP; and 1.0288, 1.0127 and 1.0207 for BioVU. Inverse variance-weighted fixed-effects meta-analysis of common (MAF ≥ 0.01) bi-allelic SNPs with INFO scores greater than or equal to 0.1 across our four studies was performed using METAL56 software. No further GC correction was applied to the meta-analysis results, which combined our four datasets.
QC of the meta-analysis results
Similar to study-level QC, we used the GWASInspector R package48 to ensure standardization and perform QC of post-meta-analysis summary statistics. Analyses included checks of allele frequency concordance with the 1000 Genomes reference and concordance of effect sizes with ICBP (Supplementary Fig. 18) as well as evaluation of Q–Q plots and genomic inflation factors (Supplementary Fig. 18) and evaluation of bivariate scatterplots of key summary statistics to identify patterns indicating the presence of low-quality SNPs (Supplementary Fig. 19).
These analyses revealed the presence of SNPs in our data with low effective sample sizes and large standard errors as well as a sub-peak of SNPs with higher effective sample sizes and large standard errors. Based on these observations, we applied a filtering threshold for SNPs that were present in at least three of our four studies or SNPs that reached an effective sample size greater than or equal to 60% of the maximum (Supplementary Figs. 20–22). Application of these criteria to achieve an optimal balance between the quality of retained SNPs and sample size resulted in 7,584,058 SNPs available for analysis.
Distinguishing known from novel loci
Published BP SNPs
We collated published BP-GWAS and compiled all 3,800 unique BP SNPs reported to date (Supplementary Tables 5 and 25). In many BP-GWAS papers, the list of previously reported BP variants has focused on the lead sentinel variant, with validated evidence from independent replication. To expand to a fully comprehensive list of known variants, we curated a list of all published common and rare variants, including results from studies conducted in non-European ancestries, all types of methodological analyses including interaction analyses, results from both one-stage and two-stage study designs, and secondary variants reported from conditional or fine-mapping analyses. We began with the list of all 984 SNPs from the total of 901 previously known and novel loci previously reported5, then added (1) any secondary SNPs reported from conditional analyses in publications up to 2018 (refs. 5,7,9,57); (2) SNPs reported from a large one-stage discovery analysis before 2018 (ref. 8); (3) SNPs reported in a previous publication from 2019 (ref. 4) and all other SNPs from GWAS published between 2018 and the end of 2020 (refs. 23,58,59,60,61,62,63). We removed duplicated SNPs to generate a unique set of ~3,800 SNPs. Subsequent checks of our results in GWAS Catalog64 and PhenoScanner65 confirmed that all published BP variants had been successfully captured. For QC purposes, we compared the allele frequencies and the resulting effect estimates of these published SNPs in our GWAS meta-analysis data with the published data.
LD analyses
LD was calculated using PLINK-2 (ref. 66) with 1000 Genomes Project49 phase 3 version 5 European reference genotypes. LD proxies were captured for the ~3,800 previously reported BP SNPs at an r2 threshold of >0.8 and a maximum distance of 500 kb. Furthermore, we identified the most strongly associated SNP within 500 kb of each known SNP regardless of LD (that is, ‘distance proxies’). The strongest trait-specific associations of these previously reported SNPs, their best LD proxies and best distance proxies in our meta-analyses are presented in Supplementary Table 6.
We partitioned our data into known and unknown subsets. To identify the ‘unknown’ portion of our GWAS results, we removed previously reported SNPs, SNPs within 500 kb of previously reported SNPs, LD proxies for previously reported SNPs at an r2 threshold of >0.1 and a maximum distance of 5 Mb, and SNPs within the human leukocyte antigen region of chromosome 6 (25–34 Mb) from each of our meta-analyses. Q–Q plots of all SNPs versus unknown SNPs are shown in Supplementary Fig. 23.
Reporting criteria for novel loci
All remaining SNPs reaching genome-wide significance (P < 5 × 10⁻⁸) and consistent direction of effect in all available studies were clumped into 1 Mb regions, and the most significant SNP for any trait was selected from each region as a sentinel variant for the locus. Novel sentinel SNPs were checked for pairwise LD against all other novel sentinel SNPs at an r2 > 0.1 to confirm independence. Considering our one-stage study design, we imposed two additional stringent reporting criteria in addition to achieving genome-wide significance. To declare a novel sentinel SNP, we required genome-wide significance P < 5 × 10⁻⁸ in the meta-analysis; consistent direction of effect across all the available sub-datasets; and no evidence of heterogeneity across the four datasets with heterogeneity P < 1 × 10⁻⁴. We also highlight how many of these novel loci reach a stricter significance threshold of P < 5 × 10⁻⁹.
Categorizing known variants into independent loci
Similarly, previously reported SNPs, their best LD proxy if the SNP was unavailable in our data or the best distance proxy if neither was available, were clumped into 1 Mb regions and the most significant SNP for any trait was selected. Selected SNPs were then checked for pairwise LD against all other selected SNPs at an r2 > 0.1 to confirm independence. The most significant SNP for any trait was selected within each LD block, and these independent SNPs were designated as known sentinel SNPs.
LDSR approach for determination of polygenicity
We applied LDSR to each of our three meta-analyses (SBP, DBP and PP) as well as the novel proportion of each meta-analysis and compared these values with genomic inflation factors to determine whether inflation of our test statistics was a result of population substructure or polygenicity.
Functional annotation and associations of novel loci
Novel signals were extended to their correlated variants in LD (r2 > 0.5) using an in silico sequencing approach67. PLINK66 was used for LD calculations and ANNOVAR68 software was used to annotate the nearest genes for novel signals and to annotate variant functions. Then the extended loci (r2 > 0.8) were used to search the GWAS Catalog64 as well as PhenoScanner65 for shared associations (P < 5 × 10⁻⁸).
Conditional analysis
Genome-wide joint conditional analysis was performed using GCTA-COJO v1.93 (ref. 69), specifying a 5 Mb LD window and a genome-wide significance threshold of 5 × 10⁻⁸ and using UKB European-ancestry sample genotypes as the LD reference. For each of our three BP traits, summary statistics were analyzed by chromosome to build a stepwise joint conditional model that selected independently associated SNPs. Pairwise LD was calculated in both the 1000 Genomes Project49 phase 3 version 5 European reference genotypes and UKB European-ancestry sample genotypes. SNPs in LD (r2 > 0.1 in either UKB or 1000 Genomes reference at ±5 Mb) with known or novel sentinel SNPs from our primary analysis or in LD with known SNPs not available in our data were excluded. Among SNPs identified in the conditional analysis, the most significant SNP for any trait was selected within each LD block, and these independent SNPs were designated as secondary SNPs. Secondary SNPs were further evaluated to determine whether they fell within the novel portion of our data.
GRS and PRS construction and variance explained
For our study, GRS is defined as a risk score comprising SNPs reaching genome-wide significance (P < 5 × 10⁻⁸) in our analyses or in previously published studies, and PRS is a full genome-wide risk score calculated by the standard clumping and thresholding method or SBayesRC15 (R package v.0.2.2). We calculated GRS and PRS and assessed variance explained in the Lifelines data (Extended Data Fig. 10). Both GRS and PRS were calculated as the sum of an individual’s risk alleles, weighted by BP trait-specific risk allele effect sizes. In SBayesRC, the risk allele effects of genome-wide SNPs were estimated from the GWAS data with a multi-normal mixture prior incorporating functional genomic annotations from BaselineLD (v.2.2)70. In addition to the SNP QC above, we further removed around 5,000 SNPs for which the per-SNP sample size in the meta-analyzed GWAS result was more than four standard deviations away from the mean value, before the SBayesRC analysis.
To calculate the percentage of BP variance explained by genetic variants in an independent dataset, we generated the residuals from a regression of each BP trait against sex, age, age2 and BMI in 10,210 Lifelines individuals71. We then fit a second linear model for the trait residuals with the top ten principal components and a third linear model for the trait residuals with ten principal components plus GRS. The difference in the adjusted R2 between the third and the second model is the estimation of the percentage of variance of the dependent (BP) variable explained by the GRS. To evaluate the contribution of previously reported BP loci as well as novel and secondary loci detected in our analyses, to observed variance in BP traits and to test the predictive value of our genome-wide results, we constructed four different GRSs and two PRSs: (1) GRS of 1,723 pairwise-independent (LD-pruned with r2 < 0.1) SNPs from published known loci; (2) GRS of 113 sentinel SNPs at genome-wide significant (P < 5 × 10⁻⁸) novel loci; (3) GRS of 1,723 known SNPs plus 113 sentinel SNPs at genome-wide significant novel loci; (4) GRS of 1,723 known SNPs plus 113 SNPs from novel loci plus 267 secondary SNPs; (5) standard clumping and thresholding PRSs at optimally selected P value thresholds (1 × 10⁻³, 0.01 and 0.01 for SBP, DBP and and PP, respectively) that maximized variance explained in the Lifelines data; and (6) full PRS calculated using SBayesRC, a Bayesian method that incorporates functional genomic annotations into the PRS calculation15. SBayesRC has been shown to have better prediction accuracy in both European ancestry and trans-ancestry prediction than other state-of-the-art PRS methods15.
We generated GRS and PRS by multiplying the risk allele dosages for each SNP by its respective effect size as weight and then summed all SNPs in the score. For PRS calculated by SBayesRC, the functional annotation-informed effect sizes were used as SNP weights. The four different GRS included the same set of SNPs for all three BP traits (SBP, DBP and PP) but were weighted by the trait-specific beta coefficients from the GWAS results for SBP, DBP and PP. Summary statistics for all SNPs in the GRS are displayed in Supplementary Table 4.
For each BP trait, we calculated full PRS by the clumping and thresholding approach72. Summary statistics of final GWAS results for each trait and the LD reference panel of 503 European ancestry samples from 1000 Genomes phase 3 (ref. 49) were used. SNPs with ambiguous strands (A/T or C/G) were removed for the score derivation. An LD-driven clumping procedure was then performed by PLINK version 1.90 (r2 < 0.1, 1,000 kb window). Finally, the clumping and thresholding PRSs were generated at 17 selected P value thresholds (1 × 10⁻⁸, 5 × 10⁻⁸, 1 × 10⁻⁷, 5 × 10⁻⁷, 1 × 10⁻⁶, 5 × 10⁻⁶, 1 × 10⁻⁵, 5 × 10⁻⁵, 1 × 10⁻⁴, 5 × 10⁻⁴, 1 × 10⁻³, 5 × 10⁻³, 0.01, 0.05, 0.1, 0.5 and 1). For optimum P value thresholds maximizing the variance explained in each trait, summary statistics of all SNPs are displayed in Supplementary Table 26a–c. We also applied the SBayesRC algorithm15 on summary statistics of final GWAS results for each BP trait and derived the effect estimates weighted by the functional annotations. These new effect estimates were made publicly available through the Polygenic Score Catalog (www.pgscatalog.org). We compared the performance of the PRS calculated by the classic clumping and thresholding approach with the PRS calculated by SBayesRC. The PRS method that explained more variance in BP traits of the Lifelines data was used in all further PRS analyses as described below.
Decile analyses of BP PRS in Lifelines
To evaluate to what extent BP PRS were predictive for SBP, DBP, PP and hypertension, we tested the PRS of SBP, DBP and PP for decile analyses of their respective traits and modeled the joint effect of the PRS for SBP and DBP for hypertension analyses. Then we applied linear and logistic regression with adjustment for sex to compare BP levels and risk of hypertension, respectively, in all deciles versus the bottom decile of the PRS distribution of 10,210 Lifelines individuals. We also compared BP levels and risk of hypertension, respectively, in all deciles versus the middle deciles of the PRS distribution. P values were calculated from the normal distribution for BP traits and from a chi-squared distribution with two degrees of freedom for hypertension.
Hypertension model performance and calibration in Lifelines
Hypertension-prediction model discrimination and calibration were examined by calculating the AUROC73,74 and Brier score75,76, respectively. Discrimination AUROC quantifies the ability of a model to classify cases and controls correctly, and specifically is the probability that a randomly chosen case will have a higher posterior probability of being a case than a randomly chosen control. Calibration quantifies the similarity of the posterior probability of being a case with the observed proportion of cases in that quantile of the ranked posterior probabilities from the model. These analyses were implemented using the pROC R package77 with tenfold cross-validation to mitigate overfitting, which occurs when predictions are made using the same data on which the model parameters were estimated. An AUROC value of 0.5 indicates no discrimination or random classification, while a value of 1 is perfect discrimination or perfect classification. The Brier score is the average squared difference between predicted probability and observed outcome, with values approaching zero indicating high calibration. The cut-off value of hypertension odds to predict high risk were identified using the Youden index (max(sensitivity + specificity)), the point on the AUROC at which sensitivity and specificity are maximized. Other cut-off points could be chosen to maximize performance for other parameters, but the Youden index is a reasonable starting point that balances several aspects of predictive performance. Statistics were calculated for two models: a model including covariates used in GWAS meta-analyses (sex, age, age2, BMI; model 1); and a model including covariates and PRS for SBP and DBP (model 2). We also calculated the NRI to indicate what proportion of the subjects are reclassified as high-risk or low-risk when the PRSs are added to the model.
Comparison of restricted maximum likelihood methods to calculate heritability
The h2SNP of BP traits has previously been calculated within the n ~ 457,000 UKB cohort GWAS dataset using the restricted maximum likelihood (REML) method BOLT-REML v2.3 (ref. 78); for example, with h2SNP = 21.3% for SBP5. To check the consistency across different software and to compare to previously published results, we calculated h2SNP of SBP within the UKB BP-GWAS dataset using GCTA-GREML69. The full imputed genetic data was converted from BGEN dosage format into hard-call genotyped PLINK format. SNPs were filtered according to MAF > 1% and high imputation quality with INFO ≥ 0.9 from the central UKB QC and then restricted to only the set of SNPs present in our full meta-analysis dataset. Owing to the high amount of RAM that GCTA software requires, we selected a representative subset from UKB for our analysis. We calculated percentiles of principal components PC1 and PC2 of all individuals from the centrally provided UKB QC data and extracted the most homogeneous subset of individuals centered around the median data points with both PC1 and PC2 within the 40–60th percentile range, resulting in a subset sample size of n = 19,410. Within GCTA, the genetic relatedness matrix was generated for each autosome separately, then merged together and filtered for relatedness according to a 0.2 cut-off to remove any first-degree and second-degree relatives. Then h2SNP for SBP was calculated with adjustment of the same covariates applied to the UKB BP-GWAS; namely sex, age, age2, BMI, genotyping chip array and the top ten PCs. One-tailed P values were calculated according to the h2SNP and standard error results in base R.
This SNP-based heritability analysis of SBP in the small subset of the UKB data (n = 19,410) yielded an h2SNP estimate of 22.8%, which is consistent with the estimate of 21.3% reported previously5 using BOLT-REML, demonstrating that the GCTA-GREML approach is also appropriate to use for calculation of heritability within our other smaller Lifelines cohort.
Heritability analyses in Lifelines data
We used GCTA-GREML16 to calculate h2SNP for BP in the same Lifelines dataset as in the %VE analyses (n = 10,210). SNPs in Lifelines were restricted to the same list of SNPs used in the UKB GCTA-GREML16 analyses. Then h2SNP for SBP, DBP and PP was calculated with adjustment of sex, age, age2, BMI and ten PCs.
BP-GWAS in African-Americans from All-Of-Us (n = 21,843)
We performed regression association tests with additive models for untransformed medication-adjusted BP traits (SBP, DBP, PP) and hypertension case or control status using HAIL (https://doi.org/10.5281/zenodo.6807412). Models were adjusted for age, age2, sex at birth, BMI and ten PCs. For quantitative BP traits, age at median SBP was used. Age at first hypertension ICD9/10 code was used for cases with a hypertension phecode, and age at median SBP measurement was used for controls and cases with only anti-hypertensive medication use. Sex was restricted to male or female at birth. BMI on the date of, or nearest to, median SBP measurement was extracted from the EHR and was restricted to the range of 10–100 kg m−2.
Association of BP variants in other ancestries
We looked up the lead SNP at each of the 2,103 BP-associated loci reported in our European meta-analysis, within two different non-European ancestry samples. We extracted results from a BP-GWAS on over 145,000 individuals from the JBB79. We also performed a new African-ancestry BP-GWAS meta-analysis (AA-meta) comprising n = 83,890 African-ancestry individuals from four different datasets: UKB (n = 3,277), BioVU (n = 9,277) and MVP (n = 49,493) with existing GWAS results; plus results from a new BP-GWAS that we conducted in n = 21,843 African-American ancestry individuals from the All-Of-Us cohort. Of the total 2,103 SNPs, 1,671 and 2,102 were available and 1,613 and 2,092 SNPs remained in the JBB and AA-meta-datasets, respectively, after excluding any SNPs that were rare (MAF < 0.01) in either of the non-European datasets, for comparison of common SNPs only. We then compared the allele frequencies and the effect sizes between our European meta-analysis and each of the two non-European datasets by calculating Pearson correlations and the percentage of concordance in the direction of SNP effects. We used only the best associated BP trait for each SNP with the same trait from the non-European dataset and performed our comparisons for novel, secondary and known SNPs separately.
BP PRS association analyses in African-American ancestry
To evaluate to what extent BP PRSs were predictive for hypertension in non-European ancestry individuals, we performed analyses of our European ancestry PRS within an African-American ancestry sample (n = 21,843) from the All-Of-Us cohort. We conducted the same PRS analysis pipeline as used for the European Lifelines cohort (Methods).
In silico transcriptome-wide association study
Genetically predicted gene expression analysis
Our in silico transcriptome-wide association study of inferred gene expression was performed using S-PrediXcan80, an approach that imputes genetically predicted gene expression in a given tissue and tests predicted expression for association with a GWAS outcome using SNP-level summary statistics. For this study, input included summary statistics from each of the meta-analyses (SBP, DBP and PP) and gene-expression references for five tissues from GTEx81 v.7 including aorta, tibial artery, left ventricle, atrial appendage and whole blood. Our analyses incorporated covariance matrices based on 1000 Genomes49 European populations to account for LD structure. The Bonferroni-corrected significance threshold was 1.55 × 10⁻⁶ to account for the total number of gene models assessed across all tissues in these analyses.
Colocalization analysis
The hypothesis that a single variant underlies GWAS and eQTL associations at a given locus (that is, colocalization) was tested using COLOC82, a Bayesian gene-level test that evaluates GWAS and eQTL association summary statistics at each SNP at the locus and provides gene-level and SNP-level posterior probabilities for colocalization. For this analysis, inputs included results for common variants in our study and eQTL summary statistics corresponding to the gene-expression references used in the S-PrediXcan analysis, restricting to only variants included in the S-PrediXcan models. Output includes posterior probabilities for the null hypothesis (PP.H0) that SNPs at the locus are associated with neither gene expression nor the outcome (that is SBP, DBP or PP), the first alternative hypothesis (PP.H1) that SNPs are associated with expression but not the outcome, the second alternative hypothesis (PP.H2) that SNPs are associated with the outcome but not expression, the third alternative hypothesis (PP.H3) that SNPs are associated with both expression and the outcome but not colocalized and the fourth alternative hypothesis (PP.H4) that SNPs associated with both expression and the outcome are colocalized. Also included are annotations of the SNPs with the highest PP.H4 at each locus and the corresponding posterior probability. A PP.H4 of greater than 90% was considered evidence of colocalization.
Pathway analyses
Downstream analyses were performed using the functional mapping and annotation of genome-wide association studies (FUMA-GWAS)17,83 online software tool. The list of all 1,070 genes from the inferred gene expression analyses that were significant from S-PrediXcan and filtered after the colocalization and eQTL analyses was used as the input into FUMA, and Genotype–Tissue Expression (GTEx) v.7 was used as the gene expression dataset. All other parameters selected were chosen to be consistent with the options used for the S-PrediXcan analysis. We conducted FUMA analyses for tissue specificity tests and for gene set enrichment analyses to yield pathway analysis results according to different pathway datasets: KEGG, Reactome and WikiPathways. Four different analyses were performed according to different BP traits: a ‘unified’ analysis based on the list of all unique significant genes across all three BP traits and three trait-specific analyses for each of SBP, DBP and PP. When presenting the outputs, the adjusted P value results take multiple testing into account, and all results tables are filtered by adjusted P < 0.05.
Ethics statement
Our study is based on meta-analysis of previously published, publicly available data for which appropriate site-specific Institutional Review Boards and ethical review at local institutions have previously approved the use of this data.
Reporting summary
Further information on research design is available in the Nature Portfolio Reporting Summary linked to this article.
Data availability
Full GWAS summary statistics of our meta-analyses are publicly available on the GWAS Catalog website data repository (https://www.ebi.ac.uk/gwas) with data accession codes GCST90310294, GCST90310295 and GCST90310296 for SBP, DBP and PP, respectively. The SBayesRC PRS data for SBP, DBP and PP are deposited on the PGS Catalog website (https://www.pgscatalog.org), with data accession codes PGS004603, PGS004604 and PGS004605 for SBP, DBP and PP, respectively, alongside publication ID PGP000581. The standard clumping and threshold PRSs for SBP, DBP and PP; summary statistics for sentinel SNPs for each BP trait as well as optimized PRS; and statistically significant reports for S-PrediXcan results for all five tissues for all BP traits evaluated are available in the Supplementary Tables.
Code availability
All software programs used in the study are publicly available as described in Methods and the Reporting Summary.
References
Mills, K. T. et al. Global disparities of hypertension prevalence and control: a systematic analysis of population-based studies from 90 countries. Circulation 134, 441–450 (2016).
GBD 2017 Causes of Death Collaborators. Global, regional, and national age-sex-specific mortality for 282 causes of death in 195 countries and territories, 1980–2017: a systematic analysis for the Global Burden of Disease Study 2017. Lancet 392, 1736–1788 (2018).
GBD 2017 Risk Factor Collaborators. Global, regional, and national comparative risk assessment of 84 behavioural, environmental and occupational, and metabolic risks or clusters of risks for 195 countries and territories, 1990–2017: a systematic analysis for the Global Burden of Disease Study 2017. Lancet 392, 1923–1994 (2018).
Giri, A. et al. Trans-ethnic association study of blood pressure determinants in over 750,000 individuals. Nat. Genet. 51, 51–62 (2019).
Evangelou, E. et al. Genetic analysis of over 1 million people identifies 535 new loci associated with blood pressure traits. Nat. Genet. 50, 1412–1425 (2018).
Wain, L. V. et al. Novel blood pressure locus and gene discovery using genome-wide association study and expression data sets from blood and the kidney. Hypertension. 70, e4–e19 (2017).
Warren, H. R. et al. Genome-wide association analysis identifies novel blood pressure loci and offers biological insights into cardiovascular risk. Nat. Genet. 49, 403–415 (2017).
Hoffmann, T. J. et al. Genome-wide association analyses using electronic health records identify new loci influencing blood pressure variation. Nat. Genet. 49, 54–64 (2017).
Ehret, G. B. et al. The genetics of blood pressure regulation and its target organs from association studies in 342,415 individuals. Nat. Genet. 48, 1171–1184 (2016).
Kamali, Z. et al. Large-scale multi-omics studies provide new insights into blood pressure regulation. Int. J. Mol. Sci. 23, 7557 (2022).
Eales, J. M. et al. Uncovering genetic mechanisms of hypertension through multi-omic analysis of the kidney. Nat. Genet. 53, 630–637 (2021).
van Duijvenboden S. et al. Integration of genetic fine-mapping and multi-omics data reveals candidate effector genes for hypertension. Am J Hum Genet. 110, 1718–1734 (2023).
Roden, D. M. et al. Development of a large-scale de-identified DNA biobank to enable personalized medicine. Clin. Pharmacol. Ther. 84, 362–369 (2008).
Bulik-Sullivan, B. K. et al. LD score regression distinguishes confounding from polygenicity in genome-wide association studies. Nat. Genet. 47, 291–295 (2015).
Zheng, Z. et al. Leveraging functional genomic annotations and genome coverage to improve polygenic prediction of complex traits within and between ancestries. Nat. Genet. https://doi.org/10.1038/s41588-024-01704-y (2024).
Yang, J., Lee, S. H., Goddard, M. E. & Visscher, P. M. GCTA: a tool for genome-wide complex trait analysis. Am. J. Hum. Genet. 88, 76–82 (2011).
Watanabe, K., Taskesen, E., van Bochoven, A. & Posthuma, D. Functional mapping and annotation of genetic associations with FUMA. Nat. Commun. 8, 1826 (2017).
Yengo, L. et al. A saturated map of common genetic variants associated with human height. Nature 610, 704–712 (2022).
Sakaue, S. et al. Trans-biobank analysis with 676,000 individuals elucidates the association of polygenic risk scores of complex traits with human lifespan. Nat. Med. 26, 542–548 (2020).
Vaura, F. et al. Polygenic risk scores predict hypertension onset and cardiovascular risk. Hypertension 77, 1119–1127 (2021).
Tegegne, B. S. et al. Heritability and the genetic correlation of heart rate variability and blood pressure in >29000 families: the Lifelines Cohort Study. Hypertension 76, 1256–1262 (2020).
Wainschtein, P. et al. Assessing the contribution of rare variants to complex trait heritability from whole-genome sequence data. Nat Genet. 54, 263–273 (2022).
Surendran, P. et al. Discovery of rare variants associated with blood pressure regulation through meta-analysis of 1.3 million individuals. Nat. Genet. 52, 1314–1332 (2020).
Ding, Y. et al. Large uncertainty in individual polygenic risk score estimation impacts PRS-based risk stratification. Nat. Genet. 54, 30–39 (2022).
Du, X. et al. The serine protease TMPRSS6 is required to sense iron deficiency. Science 320, 1088–1092 (2008).
Truksa, J. et al. Suppression of the hepcidin-encoding gene Hamp permits iron overload in mice lacking both hemojuvelin and matriptase-2/TMPRSS6. Br. J. Haematol. 147, 571–581 (2009).
Benyamin, B. et al. Novel loci affecting iron homeostasis and their effects in individuals at risk for hemochromatosis. Nat. Commun. 5, 4926 (2014).
Charlebois, E. & Pantopoulos, K. Iron overload inhibits BMP/SMAD and IL-6/STAT3 signaling to hepcidin in cultured hepatocytes. PLoS One 16, e0253475 (2021).
Kautz, L. et al. Iron regulates phosphorylation of Smad1/5/8 and gene expression of Bmp6, Smad7, Id1, and Atoh8 in the mouse liver. Blood 112, 1503–1509 (2008).
Singh, M. M., Kumar, R., Tewari, S. & Agarwal, S. Association of GSTT1/GSTM1 and ApoE variants with left ventricular diastolic dysfunction in thalassaemia major patients. Hematology 24, 20–25 (2019).
Wu, K.-H. et al. Glutathione S-transferase M1 gene polymorphisms are associated with cardiac iron deposition in patients with β-thalassemia major. Hemoglobin 30, 251–256 (2006).
Salonen, J. T. et al. High stored iron levels are associated with excess risk of myocardial infarction in eastern Finnish men. Circulation 86, 803–811 (1992).
Martínez-Salas, S. G. et al. α1A-Adrenoceptors predominate in the control of blood pressure in mouse mesenteric vascular bed. Auton. Autacoid. Pharmacol. 27, 137–142 (2007).
Mahajan, A. et al. Fine-mapping type 2 diabetes loci to single-variant resolution using high-density imputation and islet-specific epigenome maps. Nat. Genet. 50, 1505–1513 (2018).
Hambrock, A., Löffler-Walz, C. & Quast, U. Glibenclamide binding to sulphonylurea receptor subtypes: dependence on adenine nucleotides. Br. J. Pharmacol. 136, 995–1004 (2002).
Qin, X., Zhong, J. & Lan, D. The use of glimepiride for the treatment of neonatal diabetes mellitus caused by a novel mutation of the ABCC8 gene. J. Pediatr. Endocrinol. Metab. 33, 1605–1608 (2020).
Lago-Docampo, M. et al. Characterization of rare ABCC8 variants identified in Spanish pulmonary arterial hypertension patients. Sci. Rep. 10, 15135 (2020).
Le Ribeuz, H. et al. Implication of potassium channels in the pathophysiology of pulmonary arterial hypertension. Biomolecules 10, 1261 (2020).
Southgate, L., Machado, R. D., Gräf, S. & Morrell, N. W. Molecular genetic framework underlying pulmonary arterial hypertension. Nat. Rev. Cardiol. 17, 85–95 (2020).
Eichholz, A., Merchant, S. & Gaya, A. M. Anti-angiogenesis therapies: their potential in cancer management. Onco. Targets Ther. 3, 69–82 (2010).
Chen, P. et al. FGF-21 ameliorates essential hypertension of SHR via baroreflex afferent function. Brain Res. Bull. 154, 9–20 (2020).
El Agha, E. et al. Is the fibroblast growth factor signaling pathway a victim of receptor tyrosine kinase inhibition in pulmonary parenchymal and vascular remodeling? Am. J. Physiol. Lung Cell. Mol. Physiol. 315, L248–L252 (2018).
Qiao, J. et al. Evaluating significance of European-associated index SNPs in the East Asian population for 31 complex phenotypes. BMC Genomics 24, 324 (2023).
Kurniansyah, N. et al. Evaluating the use of blood pressure polygenic risk scores across race/ethnic background groups. Nat. Commun. 14, 3202 (2023).
Fritsche, L. G. et al. On cross-ancestry cancer polygenic risk scores. PLoS Genet. 17, e1009670 (2021).
Barroso, I. The importance of increasing population diversity in genetic studies of type 2 diabetes and related glycaemic traits. Diabetologia 64, 2653–2664 (2021).
Bycroft, C. et al. The UK Biobank resource with deep phenotyping and genomic data. Nature 562, 203–209 (2018).
Ani, A., van der Most, P. J., Snieder, H., Vaez, A. & Nolte, I. M. GWASinspector: comprehensive quality control of genome-wide association study results. Bioinformatics 37, 129–130 (2021).
1000 Genomes Project Consortium. A global reference for human genetic variation. Nature 526, 68–74 (2015).
McCarthy, S. et al. A reference panel of 64,976 haplotypes for genotype imputation. Nat. Genet. 48, 1279–1283 (2016).
Loh, P.-R. et al. Reference-based phasing using the Haplotype Reference Consortium panel. Nat. Genet. 48, 1443–1448 (2016).
Das, S. et al. Next-generation genotype imputation service and methods. Nat. Genet. 48, 1284–1287 (2016).
Marchini, J., Howie, B., Myers, S., McVean, G. & Donnelly, P. A new multipoint method for genome-wide association studies by imputation of genotypes. Nat. Genet. 39, 906–913 (2007).
International Consortium for Blood Pressure Genome-Wide Association Studies. Genetic variants in novel pathways influence blood pressure and cardiovascular disease risk. Nature 478, 103–109 (2011).
Altshuler, D. M. et al. Integrating common and rare genetic variation in diverse human populations. Nature 467, 52–58 (2010).
Willer, C. J., Li, Y. & Abecasis, G. R. METAL: fast and efficient meta-analysis of genomewide association scans. Bioinformatics 26, 2190–2191 (2010).
Surendran, P. et al. Trans-ancestry meta-analyses identify rare and common variants associated with blood pressure and hypertension. Nat. Genet. 48, 1151–1161 (2016).
Feitosa, M. F. et al. Novel genetic associations for blood pressure identified via gene–alcohol interaction in up to 570 K individuals across multiple ancestries. PLoS One 13, e0198166 (2018).
Takeuchi, F. et al. Interethnic analyses of blood pressure loci in populations of East Asian and European descent. Nat. Commun. 9, 5052 (2018).
de Las Fuentes, L. et al. Gene–educational attainment interactions in a multi-ancestry genome-wide meta-analysis identify novel blood pressure loci. Mol. Psychiatry 26, 2111–2125 (2021).
Sung, Y. J. et al. A multi-ancestry genome-wide study incorporating gene–smoking interactions identifies multiple new loci for pulse pressure and mean arterial pressure. Hum. Mol. Genet. 28, 2615–2633 (2019).
Sung, Y. J. et al. A large-scale multi-ancestry genome-wide study accounting for smoking behavior identifies multiple significant loci for blood pressure. Am. J. Hum. Genet. 102, 375–400 (2018).
Kichaev, G. et al. Leveraging polygenic functional enrichment to improve GWAS power. Am. J. Hum. Genet. 104, 65–75 (2019).
Buniello, A. et al. The NHGRI-EBI GWAS Catalog of published genome-wide association studies, targeted arrays and summary statistics 2019. Nucleic Acids Res. 47, D1005–D1012 (2019).
Staley, J. R. et al. PhenoScanner: a database of human genotype–phenotype associations. Bioinformatics 32, 3207–3209 (2016).
Purcell, S. et al. PLINK: a tool set for whole-genome association and population-based linkage analyses. Am. J. Hum. Genet. 81, 559–575 (2007).
Vaez, A. et al. In silico post genome-wide association studies analysis of C-reactive protein loci suggests an important role for interferons. Circ. Cardiovasc. Genet. 8, 487–497 (2015).
Wang, K., Li, M. & Hakonarson, H. ANNOVAR: functional annotation of genetic variants from high-throughput sequencing data. Nucleic Acids Res. 38, e164 (2010).
Yang, J. et al. Conditional and joint multiple-SNP analysis of GWAS summary statistics identifies additional variants influencing complex traits. Nat. Genet. 44, 369–375 (2012).
Gazal, S. et al. Linkage disequilibrium-dependent architecture of human complex traits shows action of negative selection. Nat. Genet. 49, 1421–1427 (2017).
Scholtens, S. et al. Cohort Profile: LifeLines, a three-generation cohort study and biobank. Int. J. Epidemiol. 44, 1172–1180 (2015).
International Schizophrenia Consortium. Common polygenic variation contributes to risk of schizophrenia and bipolar disorder. Nature 460, 748–752 (2009).
Bilimoria, K. Y. et al. Development and evaluation of the universal ACS NSQIP surgical risk calculator: a decision aid and informed consent tool for patients and surgeons. J. Am. Coll. Surg. 217, 833–842.e1–3 (2013).
Pencina, M. J. & D’Agostino, R. B. Evaluating discrimination of risk prediction models: the C statistic. JAMA 314, 1063–1064 (2015).
Steyerberg, E. W. et al. Assessing the performance of prediction models: a framework for traditional and novel measures. Epidemiology 21, 128–138 (2010).
Arkes, H. R. et al. The covariance decomposition of the probability score and its use in evaluating prognostic estimates. SUPPORT Investigators. Med. Decis. Making 15, 120–131 (1995).
Robin, X. et al. pROC: an open-source package for R and S+ to analyze and compare ROC curves. BMC Bioinf. 12, 77 (2011).
Loh, P.-R., Kichaev, G., Gazal, S., Schoech, A. P. & Price, A. L. Mixed-model association for biobank-scale datasets. Nat. Genet. 50, 906–908 (2018).
Sakaue, S. et al. A cross-population atlas of genetic associations for 220 human phenotypes. Nat. Genet. 53, 1415–1424 (2021).
Barbeira, A. N. et al. Exploring the phenotypic consequences of tissue specific gene expression variation inferred from GWAS summary statistics. Nat. Commun. 9, 1825 (2018).
GTEx Consortium. Human genomics. The Genotype–Tissue Expression (GTEx) pilot analysis: multitissue gene regulation in humans. Science 348, 648–660 (2015).
Giambartolomei, C. et al. Bayesian test for colocalisation between pairs of genetic association studies using summary statistics. PLoS Genet. 10, e1004383 (2014).
Functional Mapping and Annotation of Genome-Wide Association Studies; https://fuma.ctglab.nl/
Acknowledgements
J.N.H. is supported by the National Institutes of Health (grant no. K12HD04348; principal investigator K. E. Hartmann). T.E. and A.M. were supported by the Council of Europe (grant no. 2014-2020.4.01.15-0012) and Estonian Research Council (grant no. PRG1291). Z.K. is supported by Isfahan University of Medical Sciences (3400581) and Iran’s National Elites Foundation (grant no. ISF140100108). J.N.D. holds a British Heart Foundation Professorship and a National Institute for Health Research Senior Investigator Award. The views expressed are those of the authors and not necessarily those of the NHS, the NIHR or the Department of Health and Social Care. Cohort support was provided by the Million Veteran Program (MVP) VA Award BX004821 (to P.W.F.W. and K.C.). Individual cohort acknowledgements are provided in the Supplementary Notes. We dedicate this paper to the memory of Evangelos Evangelou (the first author of our previous BP-GWAS paper5), who sadly passed away in July 2023.
Author information
Authors and Affiliations
Consortia
Contributions
J.M.K., Z.K., T.X., A.V., A. Williams, S.B.G., A.A., E.E., J.N.H. and H.R.W. analyzed the data. J.M.K., Z.K., T.X., A.V., A.A., Z.Z., J.Z., E.E., J.N.H., J.C.D., D.L., T.L.E., P.B.M., H. Snieder and H.R.W. wrote the first draft of the paper. J.M.K., Z. Kutalik, T.X., A.V., A.A., Z.Z., J.Z., E.E., J.N.H., L.Y., W.J.Y., M. Traylor, A. Giri, P.M.V., D.I.C., A.P.M., M.J.C., S.H., J.S.K., D.C., J.R.A., A.C.M., R.J.L., K.K., R.S., A.A.H., P.P.P., C.P.N., N.J.S., L.R., U.G., O.M., H.R., J.F.W., H.C., B.M.P., Y.L., J.I.R., X.G., K.M.R., P.V., J.S., C.L., M.D.T., V. Giedraitis, J.L., J.T., Z.K., S.R., V.S., G.G., S.T., J.W.J., P.v.d.H., P.M.R., F.G., V.V., A. Goel, H.W., S.E.H., I.J.D., P.J.v.d.M., A.J.O., B.D.K., C.H., A.C., M.B., L.J.S., T.B., C. Mamasoula, M.J., A.P., C.G., E.G.L., F.C., J.H., P.K., S.E., M.H.D., O.P., M.P.C., E.C., M.C., R.L., E.H., H. Schmidt, B.S., M.W., D.P.S., M. Laan, A.T., M.D., V. Gudnason, J.P.C., D.R., I.K., E.B., M. Traglia, T.L., O.T.R., A.D.J., C.N., M.J.B., A.F.D., P.J.S., N.P., J.C.C., R.E., D.S., T.E., A.M., R.J.S., M. Laakso, A.H., J.H., E.d.G., A.D.M., C.N.P., I.M.N., Y.M., J.M., A. Wright, E.Z., J.M.H., C.J.O., T.S., M.A.N., E.M.S., Y.L., C.M.v.D., A.S.B., J.N.D., C. Menni, N.J.W., K.K., J.C.D., D.L., T.L.E., P.B.M., H. Snieder and H.R.W. edited the paper. D.L., T.L.E., P.B.M., H. Snieder and H.R.W. led and supervised the project.
Corresponding authors
Ethics declarations
Competing interests
The participation of M.A.N. in this project was part of a competitive contract awarded to Data Tecnica International by the National Institutes of Health to support open science research. He also currently serves on the scientific advisory board for Clover Therapeutics and is an advisor to Neuron23 as a data science fellow. B.M.P. serves on the steering committee of the Yale Open Data Access Project funded by Johnson & Johnson. P.V. received an unrestricted grant from GlaxoSmithKline to build the CoLaus study (2003). V.S. has received honoraria for consulting from Novo Nordisk and Sanofi and has ongoing research collaboration with Bayer (all unrelated to this project). R.L. is a part-time consultant of Metabolon. M.J.C. is Chief Scientist for Genomics England, a UK Government company. M. Traylor and J.M.M.H. are employees and stockholders of Novo Nordisk. C.J.O. is currently employed by Novartis Institutes for Biomedical Research (unrelated to this project) and remains credentialed as a ‘without compensation’ researcher with the Veterans Administration. T.S. is co-founder of Zoe Ltd. A.S.B. reports institutional grants from AstraZeneca, Bayer, Biogen, BioMarin, Bioverativ, Novartis, Regeneron and Sanofi. J.N.D. reports grants, personal fees and non-financial support from Merck Sharp & Dohme (MSD), grants, personal fees and non-financial support from Novartis, grants from Pfizer and grants from AstraZeneca outside the submitted work. J.N.D. sits on the International Cardiovascular and Metabolic Advisory Board for Novartis (since 2010); the Steering Committee of UK Biobank (since 2011); the MRC International Advisory Group (ING) member, London (since 2013); the MRC High Throughput Science Omics Panel Member, London (since 2013); the Scientific Advisory Committee for Sanofi (since 2013); the International Cardiovascular and Metabolism Research and Development Portfolio Committee for Novartis; and the AstraZeneca Genomics Advisory Board (2018). E.E was co-founder and has received consultation fees from Open DNA (unrelated to this project). The other authors declare no competing interests.
Peer review
Peer review information
Nature Genetics thanks Norihiro Kato, Guillaume Lettre and the other, anonymous, reviewer(s) for their contribution to the peer review of this work.
Additional information
Publisher’s note Springer Nature remains neutral with regard to jurisdictional claims in published maps and institutional affiliations.
Extended data
Extended Data Fig. 1 Manhattan plots of meta-analysis full results.
Manhattan plots of meta-analysis full results using inverse variance-weighted method, showing 1,495, 1,504, and 1,318 significant loci for systolic (SBP, top plot), diastolic (DBP, middle plot), and pulse pressure (PP, bottom plot) in total (r2 < 0.05 and 1 Mb distance).
Extended Data Fig. 2 Comparison of the newly discovered loci with the known loci in effect size distribution.
Comparison of the newly discovered loci with the known loci in effect size distribution, plotting Minor Allele Frequency (MAF) on the x-axis, vs GWAS effect estimate size on the y-axis, from the meta-analysis for SBP (a), DBP (b), PP (c).
Extended Data Fig. 3 Variance explained by Polygenic Risk Scores (PRSs) at different P value thresholds.
Variance explained by clumping and threshold Polygenic Risk Scores (PRSs) at different P value thresholds of inverse variance- weighted meta-analysis results, for SBP, DBP and PP, in the independent Lifelines cohort data.
Extended Data Fig. 4 Relationship of deciles of the SBayesRC PRS with Pulse Pressure (PP) in Lifelines.
Relationship of deciles of the SBayesRC PRS with Pulse Pressure (PP) in Lifelines of European ancestry (n = 10,210). Plot shows sex-adjusted mean PP comparing each of the upper nine PRS deciles with the lowest decile. Dotted lines represent 95% confidence intervals.
Extended Data Fig. 5 Area under the ROC curve of the two models for Hypertension prediction in Lifelines.
Area under the ROC curve (AUROC) of the two models (covariates only and covariates plus SBayesRC PRS) for Hypertension prediction in Lifelines (n = 10,210) cohort of European ancestry.
Extended Data Fig. 6 Pairwise allele frequency and effect size comparisons of 2103 GRS SNPs between our Mega-meta results and Japan Biobank.
Pairwise allele frequency (a) and effect size (b) comparisons of 2103 GRS SNPs between our Mega-meta results and Japan Biobank (JBB) (n∼145k). Comparisons are separately made for the 113 novel SNPs (‘Novel’), 267 additional novel SNPs from conditional analysis (‘Secondary’), and 1723 known SNPs (‘Known’). Black, red and blue represent SNPs with SBP, DBP, and PP as the best associated traits, respectively. r = Pearson’s Correlation coefficient. ‘concordant’ means the proportion of SNPs showing directional concordance between European and Japanese populations. Please note that JBB effect sizes are standardized by Z-score transformation.
Extended Data Fig. 7 Pairwise allele frequency and effect size comparisons of 2103 GRS SNPs between our Mega-meta results and a meta-analysis of African-American ancestry individuals.
Pairwise allele frequency (a) and effect size (b) comparisons of 2103 GRS SNPs between our Mega-meta results and a meta-analysis of African-American ancestry individuals (N = 83,890). Comparisons are separately made for the 113 novel SNPs (‘Novel’), 267 additional novel SNPs from conditional analysis (‘Secondary’), and 1723 known SNPs (‘Known’). Black, red and blue represent SNPs with SBP, DBP, and PP as the best associated traits, respectively. r = Pearson’s Correlation coefficient. ‘concordant’ means the proportion of SNPs showing directional concordance between European and African-American populations.
Extended Data Fig. 8 PRS for PP in AA.
Relationship of deciles of the SBayesRC PRS with PP in African-American Ancestry individuals from All-Of-Us Cohort (n = 21,843). Plots show sex-adjusted mean PP comparing each of the upper nine PRS deciles with the lowest decile. Dotted lines represent 95% confidence intervals.
Extended Data Fig. 9 Cross-trait associations for 41 Blood Pressure novel loci with other diseases/traits.
Cross-trait associations for 41 of the 113 Blood Pressure novel loci with other disease/trait categories from lookups within GWAS Catalog and Phenoscanner. Segment size depends on the number of locus-trait category associations.
Extended Data Fig. 10 GRSs and PRS tested for percent variance explained in Lifelines cohort.
Two PRSs were calculated: 1) a standard ‘benchmark’ clumping and thresholding PRS, and; 2) an ‘optimized’ PRS based on SBayesRC. GRS = Genetic Risk Score; PRS = Polygenic Risk Score; SNP = Single Nucleotide Polymorphism.
Supplementary information
Supplementary Information
Supplementary Notes and Figs. 1–23.
Supplementary Tables 1–26
Supplementary Tables 1–26, provided in separate sheets of a single workbook.
Rights and permissions
Open Access This article is licensed under a Creative Commons Attribution 4.0 International License, which permits use, sharing, adaptation, distribution and reproduction in any medium or format, as long as you give appropriate credit to the original author(s) and the source, provide a link to the Creative Commons licence, and indicate if changes were made. The images or other third party material in this article are included in the article’s Creative Commons licence, unless indicated otherwise in a credit line to the material. If material is not included in the article’s Creative Commons licence and your intended use is not permitted by statutory regulation or exceeds the permitted use, you will need to obtain permission directly from the copyright holder. To view a copy of this licence, visit http://creativecommons.org/licenses/by/4.0/.
About this article

Cite this article
Keaton, J.M., Kamali, Z., Xie, T. et al. Genome-wide analysis in over 1 million individuals of European ancestry yields improved polygenic risk scores for blood pressure traits. Nat Genet 56, 778–791 (2024). https://doi.org/10.1038/s41588-024-01714-w
Received:
Accepted:
Published:
Issue Date:
DOI: https://doi.org/10.1038/s41588-024-01714-w
