
Volume 25 Issue 8, August 2020
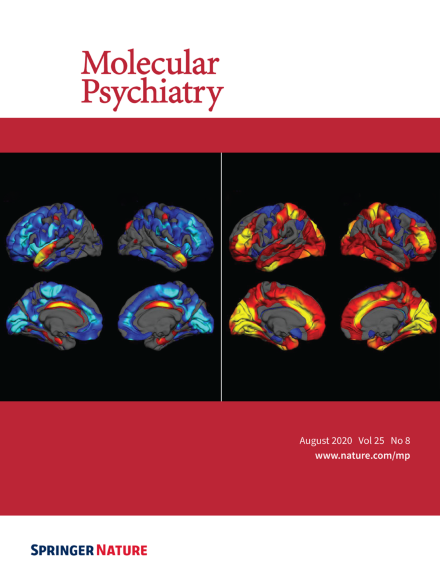
Vertex-Wise Mapping of Difference in CT and SA between 22q11DS and Healthy Control Subjects. The left panel shows vertex-wise differences in CT, and the right panel shows vertex-wise differences in SA. Colored areas show p-values for group differences after FDR correction (q = 0.05) for all vertices across both left and right cortical surfaces. Blue colors represent significant increases in 22q11DS subjects compared to healthy controls, whereas red-yellow colors represent significant reductions in 22q11DS subjects. Compared to controls, subjects with 22q11DS showed greater CT and smaller SA, most prominently in the posterior medial cortex including bilateral cuneus, precuneus, lingual gyrus, pericalcarine cortex, and bilateral medial and lateral frontal cortex. Subjects with 22q11DS showed a distinctive reduction of both CT and SA in bilateral cingulate cortex. They also had reduced CT in the superior temporal gyrus, and greater SA in the superior parietal cortex and rostral middle frontal gyrus. For more information, see the article by Sun et al. on pages 1822-1834.
Image
-
Advertisement
