
Volume 17 Issue 9, September 2012
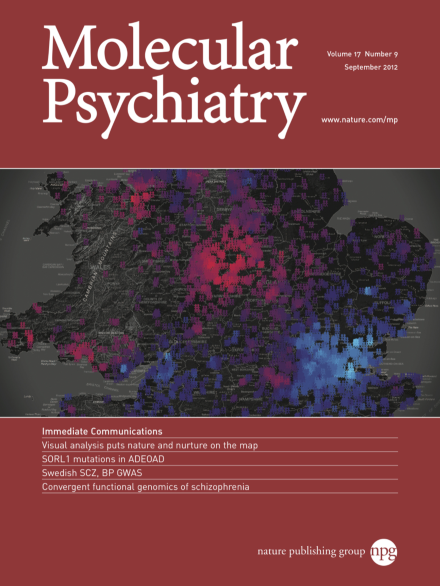
Twin data, geocoded and visualized. Comparing the resemblance of identical and fraternal twins for a phenotype allows us to estimate the relative contributions of genes and environments—nature and nurture. However, as Davis et al. explain on pages 867–874, the balance of nature and nurture depends on where we grow up. The researchers used a novel method to integrate spatial information into the twin model, and produced a visual analysis tool for exploring the results. This approach highlights hotspots of genetic or environmental influence that can be followed up with specific structural equation models. The cover shows areas of high (red) and low (blue) genetic influence for adolescent ratings on the Antisocial Process Screening Device (APSD) across England and Wales. Red regions represent areas where the environment favors the expression of genetic risk, whereas blue regions represent areas where the environment trumps genetics in accounting for phenotypic variation—an interaction between genotype and geographical location. Plotting points reflect the local density of data, but do not denote the location of study participants. For more info on this topic, please refer to the article by Davis et al. on pages 867–874.
Image
-
Advertisement
