
Abstract
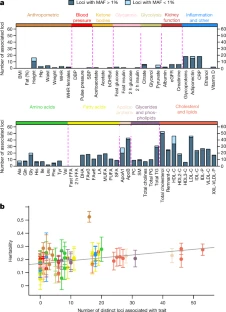
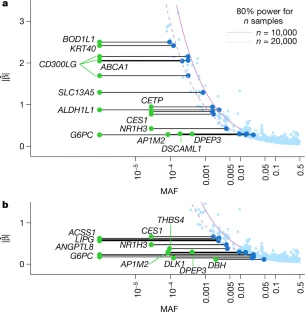
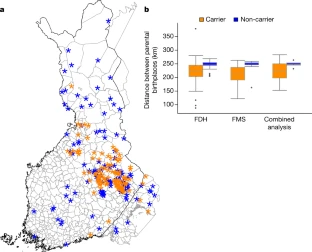
Exome-sequencing studies have generally been underpowered to identify deleterious alleles with a large effect on complex traits as such alleles are mostly rare. Because the population of northern and eastern Finland has expanded considerably and in isolation following a series of bottlenecks, individuals of these populations have numerous deleterious alleles at a relatively high frequency. Here, using exome sequencing of nearly 20,000 individuals from these regions, we investigate the role of rare coding variants in clinically relevant quantitative cardiometabolic traits. Exome-wide association studies for 64 quantitative traits identified 26 newly associated deleterious alleles. Of these 26 alleles, 19 are either unique to or more than 20 times more frequent in Finnish individuals than in other Europeans and show geographical clustering comparable to Mendelian disease mutations that are characteristic of the Finnish population. We estimate that sequencing studies of populations without this unique history would require hundreds of thousands to millions of participants to achieve comparable association power.
This is a preview of subscription content, access via your institution
Access options
Access Nature and 54 other Nature Portfolio journals
Get Nature+, our best-value online-access subscription
$29.99 / 30 days
cancel any time
Subscribe to this journal
Receive 51 print issues and online access
$199.00 per year
only $3.90 per issue
Buy this article
- Purchase on Springer Link
- Instant access to full article PDF
Prices may be subject to local taxes which are calculated during checkout
Data availability
The sequencing data can be accessed through dbGaP (https://www.ncbi.nlm.nih.gov/gap/) using study numbers phs000756 and phs000752. Association results can be accessed at http://pheweb.sph.umich.edu/FinMetSeq/ and are searchable via the Type 2 Diabetes Knowledge Portal (http://www.type2diabetesgenetics.org/). Summary statistics are also available through the NHGRI-EBI GWAS Catalog at https://www.ebi.ac.uk/gwas/downloads/summary-statistics.
Change history
04 November 2019
An Amendment to this paper has been published and can be accessed via a link at the top of the paper.
References
Samocha, K. E. et al. Regional missense constraint improves variant deleteriousness prediction. Preprint at https://www.bioRxiv.org/content/10.1101/148353v1 (2017).
Marouli, E. et al. Rare and low-frequency coding variants alter human adult height. Nature 542, 186–190 (2017).
Flannick, J. et al. Exome sequencing of 20,791 cases of type 2 diabetes and 24,440 controls. Nature 570, 71–76 (2019).
Timpson, N. J., Greenwood, C. M. T., Soranzo, N., Lawson, D. J. & Richards, J. B. Genetic architecture: the shape of the genetic contribution to human traits and disease. Nat. Rev. Genet. 19, 110–124 (2018).
Zuk, O. et al. Searching for missing heritability: designing rare variant association studies. Proc. Natl Acad. Sci. USA 111, E455–E464 (2014).
Xue, Y. et al. Enrichment of low-frequency functional variants revealed by whole-genome sequencing of multiple isolated European populations. Nat. Commun. 8, 15927 (2017).
Southam, L. et al. Whole genome sequencing and imputation in isolated populations identify genetic associations with medically-relevant complex traits. Nat. Commun. 8, 15606 (2017).
Manolio, T. A. et al. Finding the missing heritability of complex diseases. Nature 461, 747–753 (2009).
Jakkula, E. et al. The genome-wide patterns of variation expose significant substructure in a founder population. Am. J. Hum. Genet. 83, 787–794 (2008).
Polvi, A. et al. The Finnish disease heritage database (FinDis) update—a database for the genes mutated in the Finnish disease heritage brought to the next-generation sequencing era. Hum. Mutat. 34, 1458–1466 (2013).
Manning, A. et al. A low-frequency inactivating AKT2 variant enriched in the Finnish population is associated with fasting insulin levels and type 2 diabetes risk. Diabetes 66, 2019–2032 (2017).
Lim, E. T. et al. Distribution and medical impact of loss-of-function variants in the Finnish founder population. PLoS Genet. 10, e1004494 (2014).
Service, S. K. et al. Re-sequencing expands our understanding of the phenotypic impact of variants at GWAS loci. PLoS Genet. 10, e1004147 (2014).
Würtz, P. et al. Quantitative serum nuclear magnetic resonance metabolomics in large-scale epidemiology: a primer on -omic technologies. Am. J. Epidemiol. 186, 1084–1096 (2017).
Laakso, M. et al. The Metabolic Syndrome in Men study: a resource for studies of metabolic and cardiovascular diseases. J. Lipid Res. 58, 481–493 (2017).
Borodulin, K. et al. Forty-year trends in cardiovascular risk factors in Finland. Eur. J. Public Health 25, 539–546 (2015).
Abraham, G. et al. Genomic prediction of coronary heart disease. Eur. Heart J. 37, 3267–3278 (2016).
Sabatti, C. et al. Genome-wide association analysis of metabolic traits in a birth cohort from a founder population. Nat. Genet. 41, 35–46 (2009).
Pulizzi, N. et al. Interaction between prenatal growth and high-risk genotypes in the development of type 2 diabetes. Diabetologia 52, 825–829 (2009).
Fagerberg, L. et al. Analysis of the human tissue-specific expression by genome-wide integration of transcriptomics and antibody-based proteomics. Mol. Cell. Proteomics 13, 397–406 (2014).
Corsetti, J. P. et al. Thrombospondin-4 polymorphism (A387P) predicts cardiovascular risk in postinfarction patients with high HDL cholesterol and C-reactive protein levels. Thromb. Haemost. 106, 1170–1178 (2011).
Zhang, X. J. et al. Association between single nucleotide polymorphisms in thrombospondins genes and coronary artery disease: a meta-analysis. Thromb. Res. 136, 45–51 (2015).
Beygo, J. et al. New insights into the imprinted MEG8-DMR in 14q32 and clinical and molecular description of novel patients with Temple syndrome. Eur. J. Hum. Genet. 25, 935–945 (2017).
Wallace, C. et al. The imprinted DLK1-MEG3 gene region on chromosome 14q32.2 alters susceptibility to type 1 diabetes. Nat. Genet. 42, 68–71 (2010).
Day, F. R. et al. Genomic analyses identify hundreds of variants associated with age at menarche and support a role for puberty timing in cancer risk. Nat. Genet. 49, 834–841 (2017).
Perry, J. R. et al. Parent-of-origin-specific allelic associations among 106 genomic loci for age at menarche. Nature 514, 92–97 (2014).
Cleaton, M. A. et al. Fetus-derived DLK1 is required for maternal metabolic adaptations to pregnancy and is associated with fetal growth restriction. Nat. Genet. 48, 1473–1480 (2016).
Chaves, J. A. et al. Genomic variation at the tips of the adaptive radiation of Darwin’s finches. Mol. Ecol. 25, 5282–5295 (2016).
Surakka, I. et al. The impact of low-frequency and rare variants on lipid levels. Nat. Genet. 47, 589–597 (2015).
Ding, Y. et al. Plasma glycine and risk of acute myocardial infarction in patients with suspected stable angina pectoris. J. Am. Heart Assoc. 5, e002621 (2015).
Wittemans, L. B. L. et al. Assessing the causal association of glycine with risk of cardio-metabolic diseases. Nat. Commun. 10, 1060 (2019).
Perry, R. J. et al. Acetate mediates a microbiome–brain–β-cell axis to promote metabolic syndrome. Nature 534, 213–217 (2016).
Tabbassum, R. et al. Genetics of human plasma lipidome: understanding lipid metabolism and its link to diseases beyond traditional lipids. Preprint at https://www.biorxiv.org/content/10.1101/457960v1 (2018).
Casanova, M. L. et al. Exocrine pancreatic disorders in transsgenic mice expressing human keratin 8. J. Clin. Invest. 103, 1587–1595 (1999).
Surendran, P. et al. Trans-ancestry meta-analyses identify rare and common variants associated with blood pressure and hypertension. Nat. Genet. 48, 1151–1161 (2016).
Liu, C. et al. Meta-analysis identifies common and rare variants influencing blood pressure and overlapping with metabolic trait loci. Nat. Genet. 48, 1162–1170 (2016).
Palmer, C. & Pe’er, I. Statistical correction of the winner’s curse explains replication variability in quantitative trait genome-wide association studies. PLoS Genet. 13, e1006916 (2017).
Norio, R. Finnish Disease Heritage I: characteristics, causes, background. Hum. Genet. 112, 441–456 (2003).
Service, S. et al. Magnitude and distribution of linkage disequilibrium in population isolates and implications for genome-wide association studies. Nat. Genet. 38, 556–560 (2006).
Chiang, C. W. K. et al. Genomic history of the Sardinian population. Nat. Genet. 50, 1426–1434 (2018).
Rivas, M. A. et al. Insights into the genetic epidemiology of Crohn’s and rare diseases in the Ashkenazi Jewish population. PLoS Genet. 14, e1007329 (2018).
Bastarache, L. et al. Phenotype risk scores identify patients with unrecognized Mendelian disease patterns. Science 359, 1233–1239 (2018).
Niemi, M. E. K. et al. Common genetic variants contribute to risk of rare severe neurodevelopmental disorders. Nature 562, 268–271 (2018).
Surakka, I. The rate of false polymorphisms introduced when imputing genotypes from global imputation panels. Preprint at https://www.biorxiv.org/content/10.1101/080770v1 (2016).
Collins, F. S. & Varmus, H. A new initiative on precision medicine. N. Engl. J. Med. 372, 793–795 (2015).
Stancáková, A. et al. Changes in insulin sensitivity and insulin release in relation to glycemia and glucose tolerance in 6,414 Finnish men. Diabetes 58, 1212–1221 (2009).
Borodulin, K. et al. Cohort profile: the National FINRISK Study. Int. J. Epidemiol. 47, 696–696i (2017).
Wu, J. et al. A summary of the effects of antihypertensive medications on measured blood pressure. Am. J. Hypertens. 18, 935–942 (2005).
Tobin, M. D., Sheehan, N. A., Scurrah, K. J. & Burton, P. R. Adjusting for treatment effects in studies of quantitative traits: antihypertensive therapy and systolic blood pressure. Stat. Med. 24, 2911–2935 (2005).
Liu, D. J. et al. Exome-wide association study of plasma lipids in >300,000 individuals. Nat. Genet. 49, 1758–1766 (2017).
Friedewald, W. T., Levy, R. I. & Fredrickson, D. S. Estimation of the concentration of low-density lipoprotein cholesterol in plasma, without use of the preparative ultracentrifuge. Clin. Chem. 18, 499–502 (1972).
DePristo, M. A. et al. A framework for variation discovery and genotyping using next-generation DNA sequencing data. Nat. Genet. 43, 491–498 (2011).
Jun, G. et al. Detecting and estimating contamination of human DNA samples in sequencing and array-based genotype data. Am. J. Hum. Genet. 91, 839–848 (2012).
Tan, A., Abecasis, G. R. & Kang, H. M. Unified representation of genetic variants. Bioinformatics 31, 2202–2204 (2015).
Davis, J. P. et al. Common, low-frequency, and rare genetic variants associated with lipoprotein subclasses and triglyceride measures in Finnish men from the METSIM study. PLoS Genet. 13, e1007079 (2017).
Das, S. et al. Next-generation genotype imputation service and methods. Nat. Genet. 48, 1284–1287 (2016).
The Haplotype Reference Consortium. A reference panel of 64,976 haplotypes for genotype imputation. Nat. Genet. 48, 1279–1283 (2016).
McLaren, W. et al. The Ensembl Variant Effect Predictor. Genome Biol. 17, 122 (2016).
Adzhubei, I. A. et al. A method and server for predicting damaging missense mutations. Nat. Methods 7, 248–249 (2010).
Chun, S. & Fay, J. C. Identification of deleterious mutations within three human genomes. Genome Res. 19, 1553–1561 (2009).
Schwarz, J. M., Cooper, D. N., Schuelke, M. & Seelow, D. MutationTaster2: mutation prediction for the deep-sequencing age. Nat. Methods 11, 361–362 (2014).
Kumar, P., Henikoff, S. & Ng, P. C. Predicting the effects of coding non-synonymous variants on protein function using the SIFT algorithm. Nat. Protoc. 4, 1073–1081 (2009).
Kang, H. M. et al. Variance component model to account for sample structure in genome-wide association studies. Nat. Genet. 42, 348–354 (2010).
Buniello, A. et al. The NHGRI-EBI GWAS Catalog of published genome-wide association studies, targeted arrays and summary statistics 2019. Nucleic Acids Res. 47, D1005–D1012 (2019).
Kettunen, J. et al. Genome-wide study for circulating metabolites identifies 62 loci and reveals novel systemic effects of LPA. Nat. Commun. 7, 11122 (2016).
Kettunen, J. et al. Genome-wide association study identifies multiple loci influencing human serum metabolite levels. Nat. Genet. 44, 269–276 (2012).
Teslovich, T. M. et al. Identification of seven novel loci associated with amino acid levels using single-variant and gene-based tests in 8545 Finnish men from the METSIM study. Hum. Mol. Genet. 27, 1664–1674 (2018).
Inouye, M. et al. Novel loci for metabolic networks and multi-tissue expression studies reveal genes for atherosclerosis. PLoS Genet. 8, e1002907 (2012).
Lee, S. et al. Optimal unified approach for rare-variant association testing with application to small-sample case–control whole-exome sequencing studies. Am. J. Hum. Genet. 91, 224–237 (2012).
Peterson, C. B., Bogomolov, M., Benjamini, Y. & Sabatti, C. Many phenotypes without many false discoveries: error controlling strategies for multitrait association studies. Genet. Epidemiol. 40, 45–56 (2016).
Loh, P. R. et al. Reference-based phasing using the Haplotype Reference Consortium panel. Nat. Genet. 48, 1443–1448 (2016).
Howie, B. N., Donnelly, P. & Marchini, J. A flexible and accurate genotype imputation method for the next generation of genome-wide association studies. PLoS Genet. 5, e1000529 (2009).
Manichaikul, A. et al. Robust relationship inference in genome-wide association studies. Bioinformatics 26, 2867–2873 (2010).
Lawson, D. J., Hellenthal, G., Myers, S. & Falush, D. Inference of population structure using dense haplotype data. PLoS Genet. 8, e1002453 (2012).
Chang, C. C. et al. Second-generation PLINK: rising to the challenge of larger and richer datasets. Gigascience 4, 7 (2015).
Pirinen, M. et al. biMM: efficient estimation of genetic variances and covariances for cohorts with high-dimensional phenotype measurements. Bioinformatics 33, 2405–2407 (2017).
Acknowledgements
We thank T. Teshiba for coordinating ethical permissions and samples; S. Kerminen, D. Lawson and G. Busby for discussions and providing scripts to run fineSTRUCTURE. S.R. was supported by the Academy of Finland Center of Excellence in Complex Disease Genetics (312062), Academy of Finland (285380), the Finnish Foundation for Cardiovascular Research, the Sigrid Juselius Foundation, Biocentrum Helsinki and University of Helsinki HiLIFE Fellow grant. V.R. acknowledges support by RFBR, research project 18-04-00789 A. V.S. was supported by the Finnish Foundation for Cardiovascular Research. C.S. and L.S. received funding from HG006695, HL113315 and MH105578. M.A.-K. is supported by a Senior Research Fellowship from the National Health and Medical Research Council (NHMRC) of Australia (APP1158958) and works in a unit that is supported by the University of Bristol and UK Medical Research Council (MC_UU_12013/1). The Baker Institute is supported in part by the Victorian Government’s Operational Infrastructure Support Program. A.U.J., D.R., L.J.S., H.M.S., R.W., P.Y., X.Y. and M.B. received funding from DK062370. S.K.S., C.W.K.C. and N.B.F. received funding from HL113315 and NS062691. The METSIM study was supported by grants from Academy of Finland (321428), the Sigrid Juselius Foundation, the Finnish Foundation for Cardiovascular Research, Kuopio University Hospital and the Centre of Excellence of Cardiovascular and Metabolic Diseases is supported by the Academy of Finland (M.L.). Sequencing was funded by 5U54HG003079. A.E.L., K.M.S., H.J.A., C.C.C., C.J.K., K.L.K., D.C.K., D.E.L., J.N., T.J.N., S.K.D., N.O.S., I.M.H. and R.K.W. were funded by 5U54HG003079 and 5UM1HG008853-03.
Author information
Authors and Affiliations
Consortia
Contributions
A.E.L., L.J.S., R.K.W., A. Palotie, V.S., M.L., S.R., M.B. and N.B.F. designed the study. A.E.L., K.M.S., H.J.A., R.S.F., D.C.K., D.E.L., J.N., T.J.N. and J.V. produced and quality-controlled the sequence data. A.E.L., A.S.H., A.U.J., A. Pietilä, H.M.S., M.A.-K., V.S. and M.L. collected, quality-controlled and/or prepared the clinical data for association analysis. A.E.L., K.M.S., C.W.K.C., S.K.S., A.S.H., L.S., M.P., C.C.C., A.U.J., C.J.K., K.L.K., V.R., D.R., J.V., R.W., P.Y. and X.Y. analysed data. A.S.H., J.G.E., M.A.-K., M.-R.J. and M.M. collected, quality-controlled and analysed replication data. H.L., S.K.D., N.O.S., I.M.H., C.S., S.R., M.B. and N.B.F. supervised experiments and analyses. A.E.L., K.M.S., C.W.K.C., S.K.S., C.S., M.B. and N.B.F. wrote the paper.
Corresponding authors
Ethics declarations
Competing interests
: V.S. has participated in a conference trip sponsored by Novo Nordisk and received a honorarium from the same source for participating in an advisory board meeting. He also has ongoing research collaboration with Bayer. H.L. is a member of the Nordic Expert group unconditionally supported by Gedeon Richter Nordics and has received an honorarium from Orion. All other authors have no competing interests.
Additional information
Publisher’s note: Springer Nature remains neutral with regard to jurisdictional claims in published maps and institutional affiliations.
Peer review information Nature thanks Timothy Frayling, Alan Shuldiner, André G. Uitterlinden, Daniel E. Weeks for their contribution to the peer review of this work.
Extended data figures and tables
Extended Data Fig. 1 Allele frequency comparisons between FinMetSeq and NFE from gnomAD.
a, Distribution of allelic frequencies between FinMetSeq and gnomAD NFE. The comparison of allele frequencies shows the excess of variants at higher frequency in Finland as a result of the multiple bottlenecks experienced in Finnish population history. b, Proportional site frequency spectra between FinMetSeq and gnomAD NFE by variant annotation class. In general, we find a depletion of the variants in the rarest frequency class, as well as enrichment of variants in the intermediate to common frequency range. The site frequency spectra were down-sampled to 18,000 chromosomes for each data set. c, Comparison of MAFs for trait-associated variants in FinMetSeq and NFE gnomAD. Plotted in the grey background is a two-dimensional histogram of variants with non-zero allele frequencies in both gnomAD and FinMetSeq but no trait associations. Variants associated with at least one trait are coloured and scaled inversely proportional to the logarithm of the association P value. Variants >10× enriched in FinMetSeq compared to NFE are pink, those <10× enriched are in blue. The dashed line is the line of equal frequency. Two-sided uncorrected P values are from a regression of trait on the count of alternative allele at each variant. The number of independent individuals used in each point is listed in Supplementary Table 5.
Extended Data Fig. 2 Heritability of and correlations between traits.
a, b, Traits are in the same order, clockwise in a, and left to right and top to bottom in b, following the trait group colour key. a, Heritability estimated in 13,342 unrelated individuals (for abbreviations see Supplementary Table 4; for details see Supplementary Table 6). b, Heat map of the absolute Pearson correlations of standardized trait values (top right triangle) and the absolute values of estimated pairwise genetic correlations (bottom left triangle). Genetic correlations are estimated in 13,342 unrelated individuals. Values in grey below the diagonal had trait heritability less than 1.5× the s.e. of heritability.
Extended Data Fig. 3 Properties of associations shared between traits.
a, Shared genomic associations by pairs of traits. For traits x and y, colour in row x and column y reflects the number of loci associated with both traits divided by the number of loci associated with trait x. Traits are presented in the same order as in Extended Data Fig. 2a, and the side and top colour bars reflect trait groups. b, Relationship between estimated genetic correlation and extent of sharing of genetic associations. For each trait pair, the extent of locus sharing is defined as the number of loci associated with both traits divided by the total number of loci associated with either trait. Analysis using the absolute value of the Pearson correlation of the residual series results in a very similar pattern. The number of trait pairs in each x-axis category is as follows: 0–1%, 819; 1–10%, 204; 11–20%, 102; 21–30%, 41; 31–40%, 29; 41–50%, 16; >50%, 13. The bar within each box is the median, the box represents the upper and lower quartiles, whiskers extend to 1.5× the interquartile range and points represent outliers.
Extended Data Fig. 4 Gene-based association of extremely rare variants in APOB with serum total cholesterol.
Top, the distribution of the covariate-adjusted and inverse-normal transformed phenotype. Bottom, the association statistics for each variant included in the gene-based test along with the trait value for minor allele carriers of each variant (orange triangles). SV.P is the P value from the analysis of each variant in a single-variant analysis. The number of independent individuals in the analysis is 19,291.
Extended Data Fig. 5 Gene-based association of rare variants in SECTM1 with HDL2 cholesterol.
Top, the distribution of the covariate-adjusted and inverse-normal transformed phenotype. Bottom, the association statistics for each variant included in the gene-based test, along with the trait value for minor allele carriers of each variant (orange triangles). SV.P is the P value from the analysis of each variant in a single-variant analysis. The number of independent individuals in the analysis is 10,984.
Extended Data Fig. 6 Gene-based association of extremely rare variants in ALDH1L1 with glycine levels.
Top, the distribution of the covariate-adjusted and inverse-normal transformed phenotype. Bottom, the association statistics for each variant included in the gene-based test, along with the trait value for minor allele carriers of each variant (orange triangles). SV.P is the P value from the analysis of each variant in a single-variant analysis. The number of independent individuals in the analysis is 8,206.
Extended Data Fig. 7 Population structure of the FinMetSeq dataset, by region.
Population structure, by region, from a principal component analysis of exome-sequencing variant data (MAF > 1%) for 14,874 unrelated individuals with known parental birthplaces. Colour indicates individuals with both parents born in the same region; grey indicates individuals with different parental birth regions or missing information for one parent. Ctf, Central Finland; COs, Central Ostrobothnia; Kai, Kainuu; Khm, Kanta-Hame; Kyl, Kymenlaakso; Lap, Lapland; Nka, Northern Karelia; NOs, Northern Ostrobothnia; NSv, Northern Savonia; Nfi, individuals born outside Finland and lacking data on parental birthplace; Osb, Ostrobothnia; Phm, Paijat-Hame; Prk, Pirkanmaa; SKa, Southern Karelia; SuK, surrendered Karelia; SOs, Southern Ostrobothnia; SSv, Southern Savonia; Stk, Satakunta; Swf, Southwest Finland; Usm, Uusimaa; X, split parental birthplaces. Large solid circles represent the centre of each region. A map of Finland with regions labelled is supplied for reference.
Extended Data Fig. 8 Hierarchical clustering tree produced by fineSTRUCTURE.
We identified 16 subpopulations within the FinMetSeq dataset by applying a haplotype-based clustering algorithm, fineSTRUCTURE, on 2,644 unrelated individuals born by 1955 whose parents were both born in the same municipality (Methods). Each subpopulation is named based on the most common parental birth location among its members. Kai, Kainuu; Lap, Lapland; NKa, North Karelia; NOs, North Ostrobothnia; NSv, North Savonia; SOs, South Ostrobothnia; SuK, Surrendered Karelia. A map of Finland with regions labelled is supplied for reference. If multiple subpopulations share the same location label, the subpopulation is further distinguished with a numeral. NSv3 is used as an internal reference for the enrichment analysis. See Supplementary Table 17 for more detailed demographic descriptions of each subpopulation.
Extended Data Fig. 9 Regional variation in allele frequencies by functional annotation.
Enrichment of variants by allelic class in regional subpopulations of late-settlement Finland (defined in Supplementary Table 17). Each bin represents the ratio of variants in the subpopulation compared to the reference subpopulation (NSv3), after down-sampling the frequency spectra of all populations to 200 chromosomes. Pink cells represent enrichment (ratio >1), blue cells represent depletion (ratio <1). Sample sizes and confidence intervals for each enrichment ratio and the associated P values are presented in Supplementary Table 18. The results are consistent with multiple bottlenecks in late-settlement Finland, particularly for populations in Lapland and Northern Ostrobothnia. *P < 0.05; **P < 0.01; ***P < 0.005.
Supplementary information
Supplementary Information
This file contains the Supplementary Results, Supplementary Methods, Supplementary References and a full list of members of FinnGen.
Supplementary Tables
This file contains Supplementary Tables 1–22 with a full guide.
Rights and permissions
About this article

Cite this article
Locke, A.E., Steinberg, K.M., Chiang, C.W.K. et al. Exome sequencing of Finnish isolates enhances rare-variant association power. Nature 572, 323–328 (2019). https://doi.org/10.1038/s41586-019-1457-z
Received:
Accepted:
Published:
Issue Date:
DOI: https://doi.org/10.1038/s41586-019-1457-z
This article is cited by
-
Deciphering the genetic structure of the Quebec founder population using genealogies
European Journal of Human Genetics (2024)
-
Mineral Metabolism and Polycystic Ovary Syndrome and Metabolic Risk Factors: A Mendelian Randomization Study
Reproductive Sciences (2024)
-
Genome-wide characterization of circulating metabolic biomarkers
Nature (2024)
-
Causal associations between type 1 diabetes mellitus and cardiovascular diseases: a Mendelian randomization study
Cardiovascular Diabetology (2023)
-
KIF15 missense variant is associated with the early onset of idiopathic pulmonary fibrosis
Respiratory Research (2023)
Comments
By submitting a comment you agree to abide by our Terms and Community Guidelines. If you find something abusive or that does not comply with our terms or guidelines please flag it as inappropriate.
