
Figures, tables and video
From the following article
Robert Lee and Ravinder Mittal
GI Motility online (2006)
doi:10.1038/gimo75
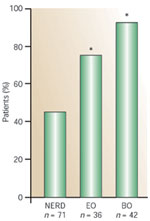
Figure 1
Distribution of acid reflux times in patients with nonerosive esophageal reflux disease (NERD), erosive esophagitis (EE), and Barrett's esophagus (BE).
Full size figure and legend (15K)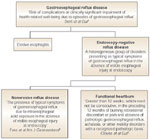
Figure 2
Proposed algorithm for defining gastroesophageal reflux disease based on endoscopic findings and the results of pH studies.
Full size figure and legend (66K)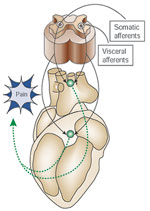
Figure 3
Schematic of visceral pain. Visceral pain is mediated by visceral afferents that are processed in the dorsal root ganglion.
Full size figure and legend (28K)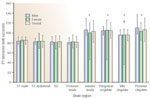
Figure 4
Latency of cortical responses to painful esophageal stimuli based on neuroanatomy and gender.
Full size figure and legend (40K)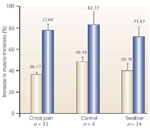
Figure 5
Esophageal wall thickness in patients with chest pain and controls.
Full size figure and legend (19K)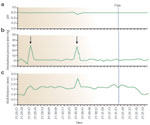
Figure 6
Esophageal pH (a), manometric pressure (b), and esophageal wall thickness (c) as measured by high-frequency intraluminal ultrasound.
Full size figure and legend (42K)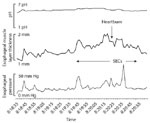
Figure 7
Simultaneous readings of esophageal pH, muscle layer thickness, and manometric pressure in patients with heartburn.
Full size figure and legend (32K)
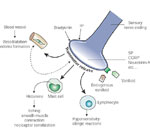
Figure 9
VR1 activation in nerve endings triggers the release of substance P (SP), calcitonin gene-related-peptide (CGRP), and neurokinin A.
Full size figure and legend (26K)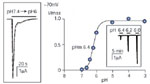
Figure 10
Acid-sensing ion channels (ASIC) function as proton-gated channels.
Full size figure and legend (18K)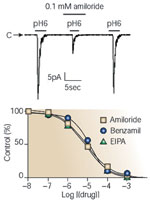
Figure 11
Anion-sensing ion channel 1 (ASIC1) is inhibited by amiloride and its derivatives.
Full size figure and legend (19K)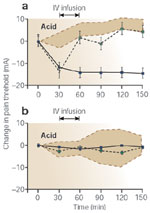
Figure 12
The effect of ketamine on acid-induced pain thresholds in the proximal esophagus and the foot.
Full size figure and legend (26K)